Informasi Dokumen
- Penulis:
- Douglas C. Montgomery
- George C. Runger
- Sekolah: Arizona State University
- Mata Pelajaran: Applied Statistics and Probability
- Topik: Applied Statistics and Probability for Engineers
- Tipe: textbook
- Tahun: 2014
- Kota: Hoboken
Ringkasan Dokumen
I. The Role of Statistics in Engineering
This chapter introduces the fundamental role of statistics in engineering, emphasizing its importance in decision-making and problem-solving. It outlines how statistical methodologies assist engineers in analyzing variability in data, which is crucial for designing and improving products and processes. The chapter also discusses the engineering method and its integration with statistical thinking, highlighting the iterative nature of problem-solving in engineering contexts. By establishing a clear understanding of how statistics can inform engineering decisions, this chapter sets the foundation for subsequent discussions on probability and statistical methods.
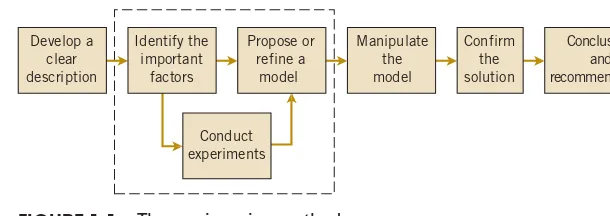
1.1 The Engineering Method and Statistical Thinking
This section details the engineering method, which is a systematic approach to problem-solving that involves defining problems, identifying variables, and proposing models. It emphasizes the role of statistical thinking in engineering, which aids in understanding and managing variability within data. This foundational concept prepares students for applying statistical methods in real-world engineering scenarios.
1.2 Collecting Engineering Data
In this subsection, various methods for collecting engineering data are discussed, including retrospective studies, observational studies, and designed experiments. Each method's advantages and limitations are analyzed, with a focus on how designed experiments can yield more reliable data for analysis. This knowledge is essential for engineers who must choose appropriate data collection techniques for their specific applications.
II. Probability
This chapter delves into the principles of probability, which form the backbone of statistical analysis. It covers essential concepts such as sample spaces, events, and the axioms of probability. By introducing various counting techniques and the rules of probability, this chapter equips students with the tools necessary to understand random phenomena in engineering contexts. The emphasis on conditional probability and independence lays the groundwork for more complex analyses in later chapters, reinforcing the significance of probability in engineering decision-making.
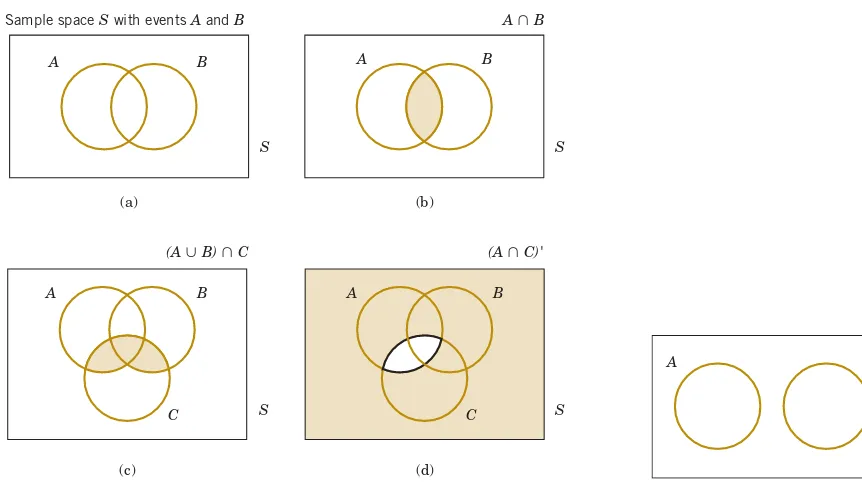
2.1 Sample Spaces and Events
This section introduces the concept of sample spaces and events, providing a foundational understanding of how outcomes are categorized in probability theory. It discusses random experiments and the importance of defining sample spaces, which is crucial for accurate probability assessments in engineering applications.
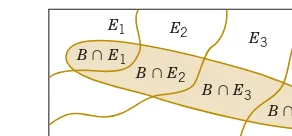
2.2 Interpretations and Axioms of Probability
Here, the interpretations of probability, including classical and subjective perspectives, are explored. The axioms of probability are presented, establishing the formal framework for probability calculations. This foundational knowledge is essential for engineers who need to apply these concepts in their statistical analyses.
III. Discrete Random Variables and Probability Distributions
This chapter focuses on discrete random variables and their associated probability distributions. It provides a comprehensive overview of important distributions such as the binomial, Poisson, and geometric distributions. By understanding these distributions, students learn how to model and analyze discrete data effectively, which is critical in various engineering applications where outcomes are countable. The chapter emphasizes the practical implications of these distributions in real-world scenarios, enhancing students' ability to apply statistical methods in their future careers.
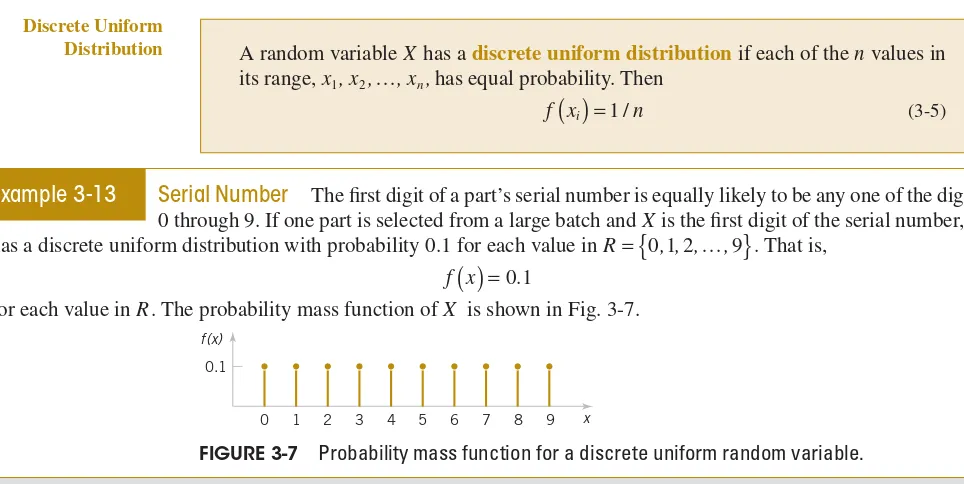
3.1 Discrete Random Variables
This section defines discrete random variables and explains their characteristics. It introduces the concept of probability mass functions (PMFs) and cumulative distribution functions (CDFs), which are fundamental for analyzing discrete data sets in engineering.
3.2 Probability Distributions and Probability Mass Functions
The focus here is on various probability distributions relevant to discrete random variables. The chapter details how to construct and interpret PMFs, providing practical examples that illustrate their application in engineering contexts, such as reliability testing and quality control.
IV. Continuous Random Variables and Probability Distributions
This chapter extends the discussion of random variables to continuous cases, introducing key concepts such as probability density functions (PDFs) and cumulative distribution functions (CDFs) for continuous random variables. It covers important distributions, including the normal, exponential, and gamma distributions, which are widely used in engineering applications. The chapter emphasizes the significance of understanding these distributions for modeling continuous data, which is often encountered in engineering fields such as manufacturing and environmental science.
4.1 Continuous Random Variables
This section defines continuous random variables and introduces the concept of probability density functions. It explains how these variables differ from discrete random variables and provides a basis for understanding continuous probability distributions.
4.2 Probability Distributions and Probability Density Functions
The chapter elaborates on the construction and interpretation of PDFs, highlighting their role in describing the distribution of continuous random variables. Practical examples demonstrate how these functions are applied in engineering contexts, such as risk assessment and process optimization.
V. Joint Probability Distributions
This chapter introduces joint probability distributions, which are essential for analyzing the relationships between multiple random variables. It covers concepts such as joint probability mass functions, marginal distributions, and conditional distributions. The chapter emphasizes the importance of understanding these relationships in engineering applications, such as system reliability and performance analysis. By exploring covariance and correlation, students learn how to assess the degree of dependence between random variables, a critical skill for engineers working with complex systems.
5.1 Two or More Random Variables
This section discusses the concept of joint distributions for two or more random variables. It introduces the notation and definitions necessary for understanding joint probability distributions, which are crucial for multivariate analysis in engineering.
5.2 Covariance and Correlation
Here, the chapter examines the concepts of covariance and correlation, which measure the degree of linear relationship between random variables. Understanding these concepts is vital for engineers, as they help in assessing the relationships between different engineering parameters.
VI. Descriptive Statistics
Descriptive statistics are crucial for summarizing and interpreting data effectively. This chapter covers various techniques for data summarization, including numerical summaries, graphical representations, and exploratory data analysis methods. By employing techniques such as histograms, box plots, and scatter diagrams, students learn how to visualize data patterns and identify trends or outliers. This foundational knowledge in descriptive statistics is essential for engineers as it informs data-driven decision-making and enhances the clarity of data presentations.
6.1 Numerical Summaries of Data
This section introduces key numerical measures such as mean, median, mode, variance, and standard deviation. These measures provide a concise summary of the central tendency and variability of data, which are essential for effective data analysis in engineering.
6.2 Stem-and-Leaf Diagrams
Stem-and-leaf diagrams are introduced as a method for visualizing the distribution of data while retaining the original values. This technique is particularly useful for small data sets, allowing engineers to identify patterns and distributions quickly.
VII. Point Estimation of Parameters and Sampling Distributions
This chapter focuses on point estimation, which involves estimating population parameters based on sample data. It introduces concepts such as sampling distributions and the central limit theorem, which are fundamental for understanding the behavior of sample statistics. The chapter emphasizes the importance of unbiased estimators and methods for point estimation, equipping students with the tools necessary for making inferences about populations based on sample data. This knowledge is vital for engineers conducting experiments and analyzing results.
7.1 Point Estimation
This section defines point estimation and discusses its significance in statistical analysis. It introduces various methods of estimation, including the method of moments and maximum likelihood estimation, which are essential for deriving estimates from sample data.
7.2 Sampling Distributions and the Central Limit Theorem
The central limit theorem is introduced, highlighting its importance in statistical inference. This section explains how sampling distributions behave and how they converge to a normal distribution, regardless of the population's distribution, as sample size increases.
VIII. Statistical Intervals for a Single Sample
This chapter addresses the concept of confidence intervals, which provide a range of values within which a population parameter is likely to fall. It covers the construction of confidence intervals for means, variances, and proportions, emphasizing the importance of sample size and variability in determining interval width. By understanding confidence intervals, students learn how to quantify uncertainty in estimates, a critical aspect of engineering analysis and decision-making.
8.1 Confidence Interval on the Mean of a Normal Distribution, Variance Known
This section explains how to construct confidence intervals for the mean when the population variance is known. It discusses the underlying assumptions and the impact of sample size on the interval's precision.
8.2 Confidence Interval on the Mean of a Normal Distribution, Variance Unknown
Here, confidence intervals for the mean are constructed when the population variance is unknown. The use of the t-distribution is introduced, highlighting its application in real-world engineering scenarios.
IX. Tests of Hypotheses for a Single Sample
This chapter focuses on hypothesis testing, a fundamental aspect of statistical inference. It discusses the formulation of null and alternative hypotheses, types of errors, and the interpretation of p-values. By understanding hypothesis testing procedures, students learn how to make data-driven decisions and draw conclusions based on sample evidence. This knowledge is crucial for engineers conducting experiments and evaluating the effectiveness of interventions.
9.1 Hypothesis Testing
This section introduces the concept of hypothesis testing, outlining the steps involved in conducting a test. It emphasizes the importance of formulating clear hypotheses and understanding the implications of statistical decisions.
9.2 Tests on the Mean of a Normal Distribution, Variance Known
Here, the chapter presents hypothesis tests for the mean when the population variance is known. It discusses test statistics and the critical value approach, providing practical examples relevant to engineering applications.
X. Statistical Inference for Two Samples
This chapter extends hypothesis testing and confidence interval concepts to two samples. It covers methods for comparing means and proportions, emphasizing the importance of understanding the differences between independent and dependent samples. By mastering these techniques, students learn how to analyze data from comparative studies, which is essential for engineers involved in product testing and quality assurance.
10.1 Inference on the Difference in Means of Two Normal Distributions, Variances Known
This section discusses hypothesis tests and confidence intervals for the difference in means when variances are known. It provides a structured approach to comparing groups in engineering studies.
10.2 Inference on the Difference in Means of Two Normal Distributions, Variances Unknown
Here, the focus shifts to cases where variances are unknown. The chapter discusses the application of the t-test and the implications for engineering data analysis.
XI. Simple Linear Regression and Correlation
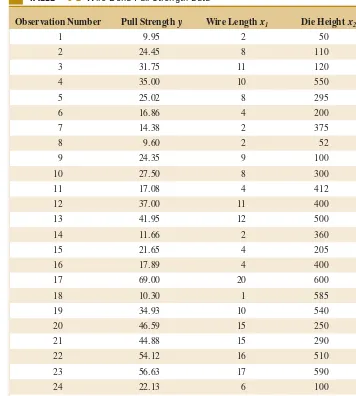
This chapter introduces simple linear regression, a powerful tool for modeling relationships between two variables. It covers the formulation of regression models, estimation of parameters, and hypothesis testing for regression coefficients. By understanding these concepts, students learn how to analyze and interpret linear relationships in engineering data, which is vital for predictive modeling and decision-making.
11.1 Empirical Models
This section discusses the role of empirical models in engineering, highlighting how they are used to describe relationships between variables based on observed data. It sets the stage for the introduction of regression analysis.
11.2 Simple Linear Regression
The chapter provides a detailed exploration of simple linear regression, including model formulation, least squares estimation, and interpretation of results. Practical examples illustrate the application of regression analysis in engineering contexts.
XII. Multiple Linear Regression
This chapter expands on the concepts of linear regression by introducing multiple linear regression, which allows for the analysis of relationships involving multiple independent variables. It covers model formulation, estimation, hypothesis testing, and model diagnostics. By mastering multiple regression techniques, students learn how to handle complex engineering problems where multiple factors influence outcomes.
12.1 Multiple Linear Regression Model
This section introduces the multiple linear regression model, explaining how it extends simple regression to include multiple predictors. It discusses the assumptions underlying the model and the importance of variable selection.
12.2 Hypothesis Tests in Multiple Linear Regression
Here, hypothesis testing for multiple regression coefficients is explored. The chapter emphasizes the use of t-tests and F-tests to assess the significance of predictors in engineering models.
XIII. Design and Analysis of Single-Factor Experiments: The Analysis of Variance
This chapter discusses the design and analysis of single-factor experiments using analysis of variance (ANOVA). It covers the principles of experimental design, data analysis, and interpretation of results. By understanding ANOVA, students learn how to assess the effects of a single factor on a response variable, which is essential for engineers conducting experiments in various fields.
13.1 Designing Engineering Experiments
This section introduces the principles of experimental design, emphasizing the importance of randomization, replication, and blocking in obtaining valid results. It sets the groundwork for understanding ANOVA.
13.2 Completely Randomized Single-Factor Experiment
The chapter details the analysis of variance for completely randomized designs, providing examples and explanations of how to interpret ANOVA results in engineering contexts.
XIV. Design of Experiments with Several Factors
This chapter extends the discussion of experimental design to multiple factors. It covers factorial designs and their analysis, emphasizing the importance of understanding interactions between factors. By mastering these concepts, students learn how to design experiments that consider multiple variables, which is crucial for comprehensive engineering analysis.
14.1 Introduction
This section provides an overview of the design of experiments involving multiple factors, highlighting the advantages of factorial designs in exploring interactions and main effects.
14.2 Factorial Experiments
The chapter discusses the statistical analysis of factorial experiments, including the interpretation of results and the importance of understanding complex interactions in engineering applications.
XV. Statistical Quality Control
This chapter introduces statistical quality control (SQC), emphasizing its role in monitoring and improving manufacturing processes. It covers control charts, process capability analysis, and the fundamentals of statistical process control. By understanding SQC techniques, students learn how to apply statistical methods to ensure product quality and consistency, which is vital in engineering and manufacturing environments.
15.1 Quality Improvement and Statistics
This section discusses the relationship between quality improvement initiatives and statistical methods. It emphasizes the importance of data-driven decision-making in achieving quality goals.
15.2 Introduction to Control Charts
The chapter introduces control charts as a tool for monitoring process stability and performance. It discusses the design and interpretation of control charts in engineering contexts.
Referensi Dokumen
- Deming, W. Edwards ( Deming )
- Fisher’s LSD method ( Fisher )
- Logistic regression model ( Logistic )
- Method of maximum likelihood ( Maximum Likelihood )
- Regression analysis ( Regression )