Approval Date: 2014-08-17 Posted Date: 2014-06-26 Reference number of this document: OGC 14-028r1 Reference URL for this document: http://www.opengis.net/doc/ER/testbed10/cloud-performance Category: Engineering Report Editors: Edric Keighan, Benjamin Pross, Hervé Caumont
Testbed 10 Performance of OGC
®Services in the Cloud:
The WMS, WMTS, and WPS cases.
Copyright © 2014 Open Geospatial Consortium.
To obtain additional rights of use, visit http://www.opengeospatial.org/legal/.
This document is not an OGC Standard. This document is an OGC Public Engineering Report created as a deliverable in an OGC Interoperability Initiative and is not an official position of the OGC membership. It is distributed for review and comment. It is subject to change without notice and may not be referred to as an OGC Standard. Further, any OGC Engineering Report should not be referenced as required or mandatory technology in procurements.
Document type: OGC® Engineering Report Document subtype: NA
License Agreement
Permission is hereby granted by the Open Geospatial Consortium, ("Licensor"), free of charge and subject to the terms set forth below, to any person obtaining a copy of this Intellectual Property and any associated documentation, to deal in the Intellectual Property without restriction (except as set forth below), including without limitation the rights to implement, use, copy, modify, merge, publish, distribute, and/or sublicense copies of the Intellectual Property, and to permit persons to whom the Intellectual Property is furnished to do so, provided that all copyright notices on the intellectual property are retained intact and that each person to whom the Intellectual Property is furnished agrees to the terms of this Agreement.
If you modify the Intellectual Property, all copies of the modified Intellectual Property must include, in addition to the above copyright notice, a notice that the Intellectual Property includes modifications that have not been approved or adopted by LICENSOR.
THIS LICENSE IS A COPYRIGHT LICENSE ONLY, AND DOES NOT CONVEY ANY RIGHTS UNDER ANY PATENTS THAT MAY BE IN FORCE ANYWHERE IN THE WORLD.
THE INTELLECTUAL PROPERTY IS PROVIDED "AS IS", WITHOUT WARRANTY OF ANY KIND, EXPRESS OR IMPLIED, INCLUDING BUT NOT LIMITED TO THE WARRANTIES OF MERCHANTABILITY, FITNESS FOR A PARTICULAR PURPOSE, AND NONINFRINGEMENT OF THIRD PARTY RIGHTS. THE COPYRIGHT HOLDER OR HOLDERS INCLUDED IN THIS NOTICE DO NOT WARRANT THAT THE FUNCTIONS CONTAINED IN THE INTELLECTUAL PROPERTY WILL MEET YOUR REQUIREMENTS OR THAT THE OPERATION OF THE INTELLECTUAL PROPERTY WILL BE
UNINTERRUPTED OR ERROR FREE. ANY USE OF THE INTELLECTUAL PROPERTY SHALL BE MADE ENTIRELY AT THE USER’S OWN RISK. IN NO EVENT SHALL THE COPYRIGHT HOLDER OR ANY CONTRIBUTOR OF
INTELLECTUAL PROPERTY RIGHTS TO THE INTELLECTUAL PROPERTY BE LIABLE FOR ANY CLAIM, OR ANY DIRECT, SPECIAL, INDIRECT OR CONSEQUENTIAL DAMAGES, OR ANY DAMAGES WHATSOEVER RESULTING FROM ANY ALLEGED INFRINGEMENT OR ANY LOSS OF USE, DATA OR PROFITS, WHETHER IN AN ACTION OF CONTRACT, NEGLIGENCE OR UNDER ANY OTHER LEGAL THEORY, ARISING OUT OF OR IN CONNECTION WITH THE IMPLEMENTATION, USE, COMMERCIALIZATION OR PERFORMANCE OF THIS INTELLECTUAL PROPERTY.
This license is effective until terminated. You may terminate it at any time by destroying the Intellectual Property together with all copies in any form. The license will also terminate if you fail to comply with any term or condition of this Agreement. Except as provided in the following sentence, no such termination of this license shall require the termination of any third party end-user sublicense to the Intellectual Property which is in force as of the date of notice of such termination. In addition, should the Intellectual Property, or the operation of the Intellectual Property, infringe, or in LICENSOR’s sole opinion be likely to infringe, any patent, copyright, trademark or other right of a third party, you agree that LICENSOR, in its sole discretion, may terminate this license without any compensation or liability to you, your licensees or any other party. You agree upon termination of any kind to destroy or cause to be destroyed the Intellectual Property together with all copies in any form, whether held by you or by any third party.
Except as contained in this notice, the name of LICENSOR or of any other holder of a copyright in all or part of the Intellectual Property shall not be used in advertising or otherwise to promote the sale, use or other dealings in this Intellectual Property without prior written authorization of LICENSOR or such copyright holder. LICENSOR is and shall at all times be the sole entity that may authorize you or any third party to use certification marks, trademarks or other special designations to indicate compliance with any LICENSOR standards or specifications.
This Agreement is governed by the laws of the Commonwealth of Massachusetts. The application to this Agreement of the United Nations Convention on Contracts for the International Sale of Goods is hereby expressly excluded. In the event any provision of this Agreement shall be deemed unenforceable, void or invalid, such provision shall be modified so as to make it valid and enforceable, and as so modified the entire Agreement shall remain in full force and effect. No decision, action or inaction by LICENSOR shall be construed to be a waiver of any rights or remedies available to it.
Preface
For many years the OGC has been developing a suite of web service standards for geospatial processing. The suite includes a web map service (WMS), a web map tiling service (WMTS), a web feature service (WFS), a web coverage service (WCS), a web processing service (WPS), a web catalogue service (CS-W), and others. These service standards have been widely adopted and deployed across the world but little information has filtered out regarding the performance and scalability of products based on OGC standards. Easy access to large IT computing resources such as the Amazon EC2 Cloud infrastructure provides an opportunity to use a flexible and low cost IT resource
environment to investigate the performance and scalability of products based on OGC standards. This document presents the web mapping and other geo-processing use cases as a way to characterize the performance of OGC data services deployed in Cloud infrastructures.
Contents
1 Introduction ...1
1.1 Scope ...1
1.2 Document contributor contact points ...1
1.3 Revision history ...1
1.4 Future work ...2
1.4.1 Performance of OGC WMS and WMTS in the Cloud (Section 1) ...2
1.4.2 Performance enhancements of Geodata processing using a Hybrid Cloud (Section 2) ...2
1.4.3 Performance enhancements of DinSAR processing using a Hybrid Cloud (Section 3) ...2
1.5 Forward ...3
2 References ...3
3 Terms and definitions ...4
4 Conventions ...6
4.1 Abbreviated terms ...6
5 Performance of OGC Services in the Cloud ...7
5.1 Performance of OGC WMT and WMTS data services in the Cloud (Section 1) ...8
5.1.1 Introduction ...8
5.1.2 Project plan ...9
5.1.3 Performance and Scalability Use Case - Access to OGC map services ...10
5.1.4 Assumptions and methodology ...11
5.1.5 Use of Cloud computing resources ...13
5.1.6 Architecture diagram ...13
5.1.6.1 Amazon EC2 with Elastic Block Storage (EBS) ...13
5.1.6.2 Amazon EC2 with Simple Storage Service (S3) ...14
5.1.7 Performance results ...15
5.1.7.1 Results from Amazon EC2 with Elastic Block Storage (EBS) ....16
5.1.7.2 Results from Amazon EC2 with Simple Storage Service (S3) ....18
5.1.7.3 Additional tests using Amazon EC2 with Simple Storage Service (S3) ...20
5.1.8 Discussion on performance results ...21
5.1.9 Conclusion ...22
5.2 Performance enhancements of Geodata processing using a Hybrid Cloud (Section 2) ...25
5.2.2 Project Plan ...25
5.2.3 Performance criteria ...25
5.2.4 Architecture ...25
5.2.5 Implementation ...27
5.2.6 Performance enhancement use case ...30
5.2.7 Performance enhancement results – Single server deployment ...30
5.2.8 Performance enhancement results – Private Cloud ...31
5.2.9 Performance enhancement results – Hybrid Cloud ...32
5.2.10 References ... Error! Bookmark not defined. 5.3 Performance enhancements of DinSAR processing using a Hybrid Cloud ...33
5.3.1 Scope of work ...34
5.3.1.1 Scientific data processing leveraging Cloud Computing ...34
5.3.1.2 Interoperability goals and performance requirements ...35
5.3.1.3 Recommended approach ...36
5.3.2 Project plan ...36
5.3.3 Architecture ...37
5.3.4 Implementation ...37
5.3.4.1 Data casting service with OGC OpenSearch interface ...38
5.3.4.2 Data staging service between multi-tenant Cloud resources ...38
5.3.4.3 Data processing service with OGC WPS-Hadoop ...39
5.3.4.4 OGC-enabled Client application ...40
5.3.4.5 Cloud Marketplace for OGC-enabled services ...41
5.3.4.6 Cloud Appliance contextualization ...41
5.3.4.7 Cloud deployment on AWS ...42
5.3.5 Demo storyline and schedule ...42
5.3.5.1 The "Cloud Appliances Marketplace" ...42
5.3.5.2 The "Cloud Appliance contextualization" ...42
5.3.5.3 The "data staging" from a Cloud storage third party ...42
5.3.5.4 The "results repatriation" ...43
5.3.6 Performance enhancement results ...44
5.3.6.1 Cloud compute resources scaling ...44
5.3.6.2 Connectivity for inter-Cloud data staging ...45
5.3.6.3 SBAS compute times per processing steps ...46
Figures
Figure 1 – Diagram illustrating concurrent user access to OGC-compliant map servers using an
Amazon EC2 with an EBS direct disk-attached storage configuration ... 14
Figure 2 - Diagram illustrating concurrent user access to OGC-compliant map servers using an Amazon EC2 with an S3 network attached storage configuration ... 15
Figure 3 – Comparative average response time for serving maps from WMS and WMTS using a single Amazon “c3.8xlarge” computer instance ... 16
Figure 4 – Number of maps per seconds satisfied by the WMS and WMTS servers ... 17
Figure 5 – Average response time for delivering maps from a WMTS service to a large number of concurrent users ... 18
Figure 6 - Average response time for serving maps from a WMTS server using an EBS direct attached storage vs a S3 network attached storage service ... 19
Figure 7 – Number of satisfied requests per second from a WMTS server using an EBS direct attached storage VS an S3 network attached storage environment ... 20
Figure 8 - Hybrid cloud conceptual architecture (source [2]) ... 26
Figure 9 - Hybrid cloud implementation architecture (source [3]) ... 28
Figure 10 - 52°North Cloud Dashboard used for coordinate transformations ... 30
Figure 11 - Average response time according to the number of simultaneously served requests in a single server deployment (source [2]) ... 31
Figure 12 - Average response time according to the number of simultaneously served requests in a Private Cloud deployment (source [2]) ... 32
Figure 13 - Average response time according to the number of simultaneously served requests in a Hybrid Cloud deployment (source [2]) ... 33
Figure 14 - The SAR Interferometry technique involved with the SBAS Cloud deployment ... 34
Figure 15 – the GEO Supersites Virtual Archive area of interest (OpenSearch query result rendered in Google Maps), featuring a set of ENVISAT ASAR products used for the OWS-10 SBAS testbed ... 38
Figure 16 - Developer Cloud Sandboxes service: data processing with OGC WPS-Hadoop ... 40
Figure 17 – The integrated OGC Client Application to configure a CSW OpenSearch query over a remote catalogue and stage data to the WPS triggered, Hadoop-enabled SBAS processing chain ... 41
Figure 18 - The 4 phases of the OWS-10 SBAS Demo storyline ... 43
Figure 19 – Resources scaling scenarios for the SBAS processing ... 44
Figure 20 - Inter-Cloud Data staging network assessment ... 45
Tables
Table 1 - Map Statistics from 81,000 concurrent users: ... 21
Table 2 - Tile statistics from 81,000 concurrent users: ... 21
OGC
®Performance of OGC Services in the Cloud
1 Introduction
1.1 Scope
This document characterizes the performance and scalability of OGC data services in the Cloud. Three use cases highlighting different geo-processing aspects of OGC data services have been developed, implemented, and benchmarked. Each use case is
presented in a separate section of this document with performance results and discussions. This document contains useful information for any organization anticipating the
deployment of OGC data publishing services in an operational environment supported by a Cloud infrastructure. It is important to note that Cloud service costs and business models applied to the use of Cloud infrastructures are out-of-scope for this project.
1.2 Document contributor contact points
All questions regarding this document should be directed to the editor or the contributors:
Name Organization Email Address
Edric Keighan CubeWerx Inc. ekeighan [at] cubewerx.com
Benjamin Pross 52North b.pross [at] 52north.org
Hervé Caumont Terradue herve.caumont [at] terradue.com
1.3 Revision history
Date Release Editor Primary clauses modified
Description
21/02/2014 Rev1 E. Keighan Creation of the document & section 1
21/02/2014 Rev1 B. Pross Creation of section 2
14/04/2014 Rev1 H. Caumont Creation of section 3
14/04/2014 Rev2 E.Keighan Completion & revision of section 1
22/04/2014 Rev2 B. Pross Completion & revision of section 2
29/04/2014 Final H. Caumont Completion & revision of section 3
30/04/2014 Final E. Keighan Final revision of the document
1.4 Future work
1.4.1 Performance of OGC WMS and WMTS in the Cloud (Section 1)
Cloud infrastructures offer geospatial data providers a unique opportunity to reduce their technology risks, reduce operational costs, promote the use of open and interoperable interfaces and deploy enterprise-wide geospatial services and very large geospatial solutions in a collaborative and distributed environment.
Section 1 of this document identified future improvements on additional testbed activities in the following Cloud infrastructure areas:
Explore deployment of collaborative geo-processing services such as collaborative WMTS services. Of interest are the anticipated potential benefits from:
Deploying large distributed geospatial services.
Collaborative maintenance of geospatial services.
Incremental updates to imagery services.
Explore and demonstrate an optimal business costing model to reduce computer costs by a group of partner organizations interested in exchanging geospatial data and sharing geospatial services.
1.4.2 Performance enhancements of Geodata processing using a Hybrid Cloud (Section 2)
Section 2 of this document identified future improvements on conducting additional Hybrid Cloud tests. The benchmarks conducted with the Hybrid Cloud were initial basic tests. The test results could be diversified using different test set-ups. Another public cloud provider could be used and the performance of the Hybrid Cloud could be tested between the different cloud providers. Also we envision the use of raster datasets for the tests. In general, the processes used in the Hybrid Cloud could be examined for their fitness to be parallelized, so that single requests could be split up in sub-tasks that each could be send to a dedicated WPS instance in the Cloud. This could further boost performance.
Major issues in Cloud Computing are security and trust aspects. Data needs to be stored in a secure way and also the execution of a process needs to be constrained if it uses sensible data. Suitable methods to enable secure and trusted processing of data in the Cloud need to be investigated.
1.4.3 Performance enhancements of DinSAR processing using a Hybrid Cloud (Section 3)
Section 3 of this document identified future improvements by investigating the use and benefits of a Cloud infrastructure in support of multi-tenant geospatial services
1.5 Forward
Attention is drawn to the possibility that some of the elements of this document may be the subject of patent rights. The Open Geospatial Consortium shall not be held
responsible for identifying any or all such patent rights.
Recipients of this document are requested to submit, with their comments, notification of any relevant patent claims or other intellectual property rights of which they may be aware that might be infringed by any implementation of the standard set forth in this document, and to provide supporting documentation.
2 References
The following documents are referenced in this document. For dated references, subsequent amendments to, or revisions of, any of these publications do not apply. For undated references, the latest edition of the normative document referred to applies. Amazon S3 (http://aws.amazon.com/s3/)
Baranski, B., Foerster, T., Schäffer, B. and Lange, K. (2011), Matching INSPIRE Quality of Service Requirements with Hybrid Clouds. Transactions in GIS, 15: 125–142. doi: 10.1111/j.1467-9671.2011.01265.x
Differential Interferometry Synthetic Aperture Radar
( http://www.irea.cnr.it/en/index.php?option=com_k2&view=item&id=77:differential-interferometry-synthetic-aperture-radar&Itemid=139)
INSPIRE Network Services Drafting Team (2009). Draft Technical Guidance for INSPIRE Coordinate Transformation Services. Available online:
http://inspire.jrc.ec.europa.eu/documents/Network_Services/INSPIRE_Draft_Technical_ Guidance_Coordinate_Transformation_(Version_2.0).pdf (accessed 2014-01-28)
OGC Blog "Accessing the Cloud with OGC Services" (http://www.opengeospatial.org/blog/1866)
OGC Web Map Service (WMS) Interface Standard (http://www.opengeospatial.org/standards/wms)
OGC Web Map Tile Service (WMTS) Interface Standard (http://www.opengeospatial.org/standards/wmts)
OGC Web Processing Service (WPS) Interface Standard (http://www.opengeospatial.org/standards/wps)
OGC® Web Services Common Standard
OGC® OpenSearch Geo and Time Extensions
(http://www.opengeospatial.org/standards/opensearchgeo)
Schäffer, B. (2011). Cloud Computing as a means to reach Inspire Performance Requirements. Presentation at the AGILE 2011. Available online:
http://sdi-testbed.eu/index.php?option=com_docman&task=doc_download&gid=55&Itemid=8 (accessed 2014-01-28)
3 Terms and definitions
For the purposes of this report, the definitions specified in Clause 4 of the OWS Common Implementation Standard [OGC 06-121r3] shall apply. In addition, the following terms and definitions apply.
3.1
attribute <XML>
name-value pair contained in an element [ISO 19136:2007]
Note: In this document an attribute is an XML attribute unless otherwise specified.
3.2
association
named or typed connection between two web resources
3.3
client
software component that can invoke an operation from a server [ISO 19128:2005]
3.4
coordinate
one of a sequence on n numbers designating the position of a point in n-dimensional space [ISO 19111:2007]
3.5
coordinate reference system
coordinate system that is related to an object by a datum [ISO 19111:2007]
3.6
coordinate system
3.7
element <XML>
basic information item of an XML document containing child elements, attributes and character data
[ISO 19136:2007]
3.8
feature
abstraction of real world phenomena [ISO 19010:2002]
NOTE: A feature can occur as a type or an instance. The term “feature type” or “feature instance” should be used when only one is meant.
3.9
feature identifier
identifier that uniquely designates a feature instance
3.10
filter expression
predicate expression encoded using XML [ISO 19143]
3.11
Harvest operation
an operation defined by the CSW standard that may be used to automatically register resources (e.g. services) with the catalogue
3.12
interface
named set of operations that characterize the behavior of an entity
3.13
link
synonym for association
3.14
link relation
identifies the semantics of a link
NOTE: Typically specified using the “rel” attribute of a link or association
3.15
namespace <XML>
collection of names, identifier by a URI reference which are used in XML documents as element names and attribute names
3.16
operation
specification of a transformation or query that an object may be called to execute [ISO 19119:2005]
3.17
property
face or attribute of an object, referenced by name [ISO 19143]
3.18
response
result of an operation returned from a server to a client [ISO 19128:2005]
3.19
server
particular instance of a service [ISO 19128:2005]
3.20
service
distinct part of the functionality that is provided by an entity through interfaces [ISO 19119:2005]
3.21
service metadata
metadata describing the operations and geographic information available at a server [ISO 19128:2005]
3.22
Uniform Resource Identifier
unique identifier for a resource, structured in conformance with IETF RFC 3986 [ISO 19136:2007]
NOTE: The generate syntax is <scheme>::<scheme-specified-part>. The hierarchical syntax with a namespace is <scheme>://<authority><path>?<query>
3.23
web resource
referent of any uniform resource identifier (see RFC 3986), or internationalized resource identifier (see RFC 3987).
4 Conventions
4.1 Abbreviated terms
AWS Amazon Web Services CSW Catalogue Service Web EBS Elastic Block Storage EC2 Elastic Cloud Compute EC European Commission ESA European Space Agency GEO Group on Earth Observations
GEOSS Global Earth Observation System of Systems
DInSAR Differential Synthetic Aperture Radar Interferometry GSS GeoSynchronization Service
IaaS Infrastructure as a Service
INSPIRE Infrastructure for Spatial Information in Europe ONe OpenNebula
PaaS Platform as a Service SaaS Software as a Service
SSEP SuperSites Exploitation Platform URL Uniform Resource Location URI Uniform Resource Identifier VM Virtual Machine
WMS Web Map Service WMTS Web Map Tiling Service WFS Web Feature Service WCS Web Coverage Service WPS Web Processing Service
5 Performance of OGC Services in the Cloud
This document is composed of three (3) sections. Each one presenting a particular geo-processing use case with its own methodology, assumptions, deployment configurations, and the use of independent Cloud software and hardware resources.
The topics covered in the three sections are:
Section 2 - Performance enhancements of Geodata processing using a Hybrid Cloud in the context of INSPIRE
Section 3 - Performance enhancements of DinSAR processing using a Hybrid Cloud in the context of GEOSS
5.1 Performance of OGC WMS and WMTS data services in the Cloud (Section 1)
In recent years we have observed a significant shift in the use of spatial data. Needs for spatial data today are multi-disciplinary in scope, travel far from surveyors and GIS professionals alone, and often include business IT systems and link a myriad of users from truck drivers to mayors to scientists in their paths. Many of the ‘new’ geospatial firms consider themselves to be part of the information technology industry, rather than GIS.
As data provider organizations are being pressured to publish more geospatial data over the web to larger audiences, there is a need to investigate the performance and scalability of OGC data services in support of more robust and operational geospatial services. This use case explores the performance behavior of accessing OGC WMS and WMTS services in a Cloud environment. After many years of effort and large investments from many OGC sponsors across the world, it is still unclear how the performance of products based on OGC data service standards match up with other mapping services in the market such as those from Google or Microsoft. How would an interoperable and decentralized business model using OGC data services compare with a centrally managed and
proprietary infrastructure? Considering that organizations across the world have invested large sums of money into deploying OGC data services over the last 10 years, it is
surprising to note the lack of leadership in deploying large scale operational systems using OGC data services in a distributed computing environment. This Engineering Report sheds some light on the performance and scalability issues encountered when deploying OGC Web mapping services in a Cloud infrastructure.
For OGC Testbed 10, Amazon, Inc. donated the resources of their Amazon Web Services (AWS) cloud offering for these purposes.
5.1.1 Introduction
One objective of the OGC Testbed 10 is to explore the state of the art in geospatial Cloud computing. One aspect of the requirements is the use of OGC data services through Cloud infrastructures like AWS, and the need to investigate the performance and scalability of OGC-compliant Geospatial services.
This Engineering Report describes the project plan, methodology, assumptions, benchmarking activities, and performance results. The intent of this project is to shed some light on the performance of well-known OGC web map services when deployed in the Cloud. Cost benefits are also inherent in the use of such a Cloud infrastructure, but no efforts have been made in this project to quantify such benefits or investigate an optimal business model for exchanging geospatial data in the Cloud.
5.1.2 Project plan
The project plan was as follows:
a) deploy OGC-compliant WMS and WMTS data services in AWS using two different but well known system configurations
b) evaluate and compare the performance and scalability of the data services for each configuration, and
c) discuss the results and trade-offs that should be considered when deploying OGC data services in the Cloud..
The use of two system configurations is possible because AWS allows for multiple data storage solutions. One solution is designed to support traditional file systems with direct disk-attached storage and the other is based on network storage available as a web service (network attached storage). Each system configuration relies on the use of different Cloud resources delivering different performance and scalability characteristics.
The first system configuration, the one that supports traditional file system usage uses an Amazon Elastic Compute Cloud (EC2) with storage provided by the Elastic Block Storage (EBS) service. This configuration mimics the use of traditional computing resources deployed at existing geospatial provider sites. With this configuration, disk storage resources are directly attached to a virtual machine. In an AWS infrastructure, this corresponds to the usage of EBS disk storage mounted directly to a specific EC2 instance such as the c3.8xlarge EC2 instance type.
The second system configuration uses Amazon EC2 with Simple Storage Service (S3) resources, Amazon S3. With this configuration, AWS is offering network attached storage for accessing geospatial data. With this configuration, developers can benefit from the large bandwidth and caching infrastructure deployed by Amazon to support access to very large volumes of data. But contrary to the EBS, where access to the data is performed using a standard file I/O system, the second system configuration uses a cloud object store called Simple Storage Service (S3). This storage infrastructure uses a web API to
systems, but best practice for S3 is to support both read and write operations directly from a client application.
The use of a web interface for accessing data may cause performance latencies for any intensive read and write operations. The slowness of read and write operations may also cause data inconsistencies for large volume transactions and synchronized update
operations. In practice, the use of a large network-based storage system optimized for user proximity offers the potential to scale OGC data services, meet performance and
scalability requirements of large and small data providers and support large numbers of concurrent users at much lower costs than a typical direct disk-attached storage system. Because most OGC standards are web services, they are well adapted to perform in the web services environment of the Cloud. It is also important to note that the slowness of I/O operations and performance latencies can be mitigated by the use of parallel
asynchronous operations.
The S3 system configuration also offers the possibility of deploying a large network of caching nodes that can deliver data and achieve performance that is on par with that of high-volume offerings such as Google Maps and Bing Maps. The S3 system can also be optimized based on the proximity of the user to the network node hosting the data. Compared with the typical direct disk-attached storage system, the S3 configuration is more scalable for access but will require software service oriented architecture design changes and a re-design of geo-processing operations that deal with changes to the data. Static data services with no changes to the data are not affected by an S3 configuration. In practice an S3-based system should scale up and serve a much larger user-base when compared to a direct disk-mounted system configuration.
5.1.3 Performance and Scalability Use Case - Access to OGC map services
This use case investigates the performance characteristics of web mapping using OGC WMS and WMTS services from imagery deployed in an Amazon environment. It covers access to maps only and meets the needs of most geospatial data providers wishing to publish their geospatial data to the largest possible number of map users through OGC web map services. Performance testing based on incremental updates to images (data currency use case) was considered out-of-scope for this project.
and promote the use of open and interoperable geospatial services solutions through the use of OGC standards.
5.1.4 Assumptions and methodology
To respond to the “access to OGC map services” use case, assumptions were made regarding how end-users access OGC map services with client software applications. More specifically, a model for accessing maps was developed and a method for simulating large numbers of concurrent users was implemented. The objective was to stress the map server by emulating continuous access from a large number of concurrent users, gather statistics, and report our findings. The following assumptions were made regarding the methodology used for the tests:
The duration of the test – A period of 10 minutes was selected for the duration of any test. This time period was considered sufficient for the virtual machine to achieve stable conditions allowing us to monitor the behavior characteristics of the VM.
Numbers of concurrent users – A number of tests were conducted using an incremental number of users in order to understand the physical limits of a single Virtual Machine and determine the ability of the VM to deliver maps to concurrent users within acceptable time limits. Tests were performed using 10, 50, 100, 200, 300, 400, 500, 600, 700, 800, 900, 1,000, 1,200, 1,400, 1,600, 1,800, 2,000, 2,200, 2,400, 2,600, 2,800, 3,000, 3,500, 4,000, 4,500, 5,000, 5,500, 6,000, 8,000, 10,000 and 20,000 concurrent users. A test with 81,000 concurrent users was also
performed with the S3 system configuration. For each test performance statistics were recorded.
Acceptable response time from the map server – The acceptable response time from the server was established at 2 seconds or less.
Statistics captured during the test – For each test, the following statistical information was captured:
oNumber of concurrent users
oTotal number of map requests sent to the map server
o% of acceptable requests (less than 2 min.) satisfied by the map server oNumber of map requests satisfied per sec.
oAvg. map response time in sec.
oMax first byte received in sec.
oHighest observed request load average oServer bandwidth usage (MB/sec.)
Concurrent users for the test – For each test, users were added incrementally to the test. This was done to avoid an initial overloading condition on the VM. Each user was added to the VM within a period that corresponds to 10% of the duration of the test. (i.e. for the 1,000 concurrent users test, one user was added to the test every 0.06 sec.).
Generation of map requests – For all tests, each map request was generated randomly by a custom stress-tester tool within a window covering 95% of the image data set. Each request was randomly generated from each user every 4 seconds. Each map request was issued within a large geographic region at one of the selected multiple resolutions. No caching mechanisms were used and all cache images that were temporarily generated during the test by the client application and the web server were cleared after each test.
Distribution of map requests – For all tests, each map was generated following a known distribution of map requests based on image resolution. The map request distribution was selected to match a typical map request pattern from someone using a GIS or a web browser application for accessing maps from an OGC-compliant map server:
o30% of map requests were selected between 0.5m and 4m (per pixel), o40% of map requests were selected between 4m and 50m, and
5.1.5 Use of Cloud computing resources
Assumptions were made regarding the use of resources required for the project. For the “EBS configuration”, we used the following resources:
A “c3.8xlarge” EC2 instance (64 bit) with 18TB of standard direct disk-attached EBS storage. Because the maximum size of an EBS volume is 1TB we recreated a RAID 0 set of 18 EBS volumes. The c3.8xlarge is described by AWS as a
compute optimized VM with 32 hardware hyperthreads running on 2.8 GHz Intel Xeon E5-2680 v2 (Ivy Bridge) processors with 60GB of available memory on a 10 Gigabit ethernet network.
WMS and WMTS data servers.
Stress tester software was deployed on “m3.2xlarge” instances. Of the many EC2 types available, the m3.2xlarge is categorized by AWS as a general purpose VM type. The stress tester tool was used to generate random map requests as per the methodology described above.
For the “S3 configuration”, we used the same resources as above except for the data storage:
A “c3.8xlarge” EC2 instance (64 bit) with S3 network attached storage. The c3.8xlarge is described by AWS as a compute optimized VM with 32 hardware hyperthreads running on 2.8 GHz Intel Xeon E5-2680 v2 (Ivy Bridge) processors with 60GB of available memory on a 10 Gigabit ethernet network.
WMS and WMTS data servers.
Stress tester software was deployed on Amazon “m3.2xlarge” instances. Of the many EC2 types available, the m3.2xlarge is categorized by AWS as a general purpose VM type. The stress tester tool was used to generate random map requests as per the methodology described above.
5.1.6 Architecture diagram
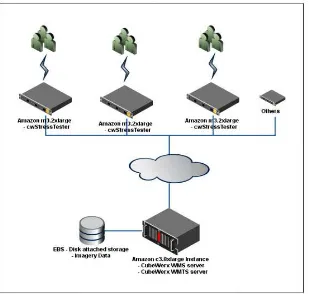
5.1.6.1 Amazon EC2 with Elastic Block Storage (EBS)
The architecture diagram presented below illustrates resources used at typical data provider sites for deploying OGC map services. Whether the data provider uses a virtual or standard computer, the approach is the same. In the diagram below, we simulate access to map services by using a “stress tester” tool, deployed on a number of “m3.2xlarge” computer instances. These computers were used as client computers to generate
This use case aims to measure the performance and scalability of a single Virtual computer and its ability to support the largest possible number of concurrent users requesting maps from both OGC-compliant WMS and WMTS servers. Since the
objective is to measure the capacity of the data service to serve maps to users, data latency between the client environment and the map server environment was kept to the
minimum. To that end, the “stress tester” tool was deployed in the same AWS availability zone as the map server. This was done to avoid masking the performance and scalability results with client side latency issues.
The diagram in Figure 1 below illustrates the Amazon EC2 with an EBS configuration. Each m3.2xlarge computer resource is used to simulate end-users requesting maps from the map server on a continuous basis. Each m3.2xlarge computer could support 1,600 open connections to the c3.8xlarge instance hosting the map server.
Figure 1 – Diagram illustrating concurrent user access to OGC-compliant map servers using an Amazon EC2 with an EBS direct disk-attached storage configuration
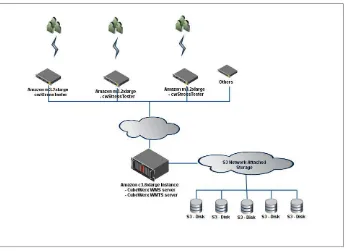
5.1.6.2 Amazon EC2 with Simple Storage Service (S3)
Figure 2 - Diagram illustrating concurrent user access to OGC-compliant map servers using an Amazon EC2 with an S3 network attached storage configuration
5.1.7 Performance results
The section below presents results from performance and scalability tests using the following two system configurations: a) Amazon EC2 with ABS, and b) Amazon EC2 with S3. All tests were conducted using a single Amazon computer instance (c3.8xlarge) for serving maps and all map requests were generated by the stress tester tool deployed on multiple computer instances (m3.2xlarge). Each map request was randomly generated and no map results were cached.
Amazon EC2 with EBS
The performance tests conducted with this configuration are listed below:
Comparative average response time for serving maps from WMS and WMTS using a single “c3.8xlarge” computer instance.
Number of maps per seconds satisfied by the WMS and WMTS servers.
Average response time for delivering maps from a WMTS service to a large number of concurrent users.
Amazon EC2 with S3
Average response time for serving maps from a WMTS server using an EBS direct attached storage VS an S3 network attached storage service.
Number of satisfied requests per second from a WMTS server using an EBS direct attached storage VS an S3 network attached storage service.
Results from the largest test we performed using EC2 and S3.
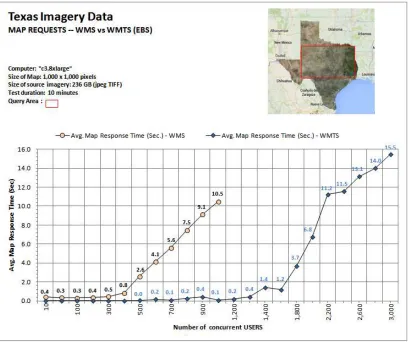
5.1.7.1 Results from Amazon EC2 with Elastic Block Storage (EBS)
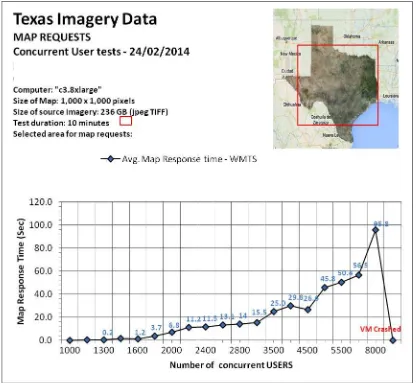
The first observation that can be made from the results in Figure 3 is that the WMTS service scales a lot better than the WMS does, as was expected.
If we establish an acceptable response time for returning a map at 2 seconds, results in Figure 3 below indicate that a single “c3.8xlarge” virtual computer can easily serve 450 concurrent users with a good response time while a WMTS service can serve maps to 1,700 concurrent users. This makes the WMTS service almost 4 times more efficient at returning maps from imagery than the WMS.
Additional statistics captured during the performance tests also indicate that the WMS service returned 35,170 maps within 10 minutes (to 400 users) while the WMTS returned 148,578 maps to 1,600 users within the same period of time. The WMS service peaked at 62 maps per second and could not return maps faster. Of course since more users were added on a continuous basis, the map service became overloaded and the average response time became unacceptable. With 1,000 users, the WMS server was still delivering maps but the average response time was 10.6 seconds and only 1.3% of all requests were returned within an acceptable time of 2 seconds.
During the same test period of 10 minutes, the WMTS service was able to serve 1,700 users and deliver 248 maps per second. The WMTS server was still returning maps with a performance of less than 2 seconds for 94% of all maps requested.
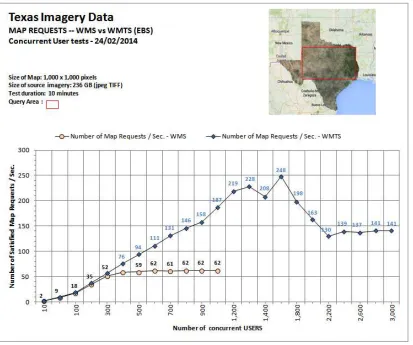
Figure 4 – Number of maps per seconds satisfied by the WMS and WMTS servers
not likely wait on line for more than 10 seconds for a response from a map server, certainly not 95 seconds. This implies that in a real life scenario, the WMTS server may auto regulate itself between 1,700 and 1,900 concurrent users and the WMS may auto regulate itself between 400 and 500 concurrent users.
Figure 5 – Average response time for delivering maps from a WMTS service to a large number of concurrent users
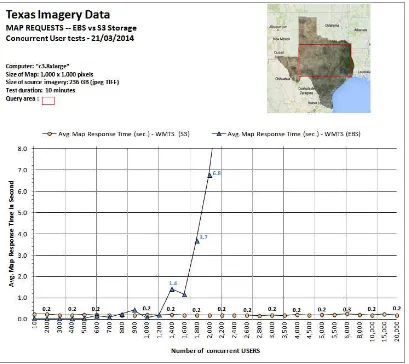
5.1.7.2 Results from Amazon EC2 with Simple Storage Service (S3)
The first observation that can be made from the results in Figure 6 is that access to the S3 network storage scales a lot better than the EBS direct attached storage for the same WMTS service and the same data. This was somewhat expected but the difference is breathtaking. While the results show that the performance of access to a direct attached EBS environment offers better performance (0.03 sec.) for 500 or less concurrent users, access to maps from S3 shows a linear and very stable performance up to 20,000
Figure 6 - Average response time for serving maps from a WMTS server using an EBS direct attached storage vs a S3 network attached storage service
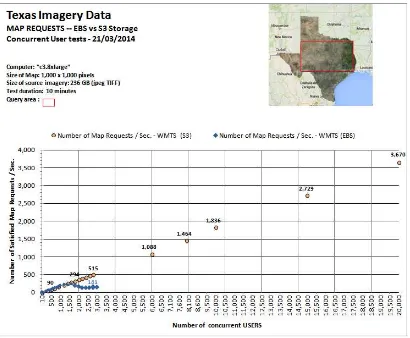
The linearity of the performance is better shown in Figure 7 below, presenting the number of map requests satisfied by the WMTS server between the two different system
configurations. While the EBS environment reached a peak at 248 maps per second with 1,700 users and stabilized at 141 maps per second up to 3,000 users, the S3 environment is still showing a straight line, delivering 3,670 maps per second with no sign of
Figure 7 – Number of satisfied requests per second from a WMTS server using an EBS direct attached storage VS an S3 network attached storage environment
5.1.7.3 Additional tests using Amazon EC2 with Simple Storage Service (S3)
Following the amazing results above we decided to perform the largest concurrent user test we could, considering the number of computers we had at our disposal for submitting the performance jobs and monitoring the results.
The results presented below with 81,000 concurrent users required 72 m1.xlarge instances. Each instance was supporting 1,125 open connections with the c3.8xlarge instance hosting the WMTS server.
Table 1 - Map Statistics from 81,000 concurrent users
Duration of the test 10 minutes
Instances used to generate concurrent map requests 72
Maps requested in 10 minutes 6.9 million
Number of maps satisfied per second 11,548 Average response time for all maps requested 1.7 seconds
Average map file size 589,453 bytes
Server bandwidth usage 6,807 MB/second
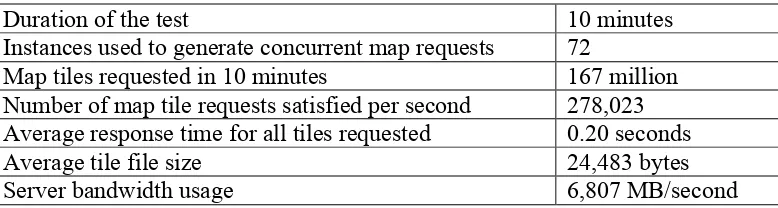
We have also compiled the statistics regarding access to map tiles (as opposed to maps). Since the size of the map requested was 1,000x1,000 pixels, the number of tiles required to fill up a map view was about 24 map tiles on average. The statistics below indicate that each tile was delivered from S3 at an average of 0.2 second/tile to 81,000 concurrent users.
Table 2 - Tile statistics from 81,000 concurrent users
Duration of the test 10 minutes
Instances used to generate concurrent map requests 72
Map tiles requested in 10 minutes 167 million Number of map tile requests satisfied per second 278,023 Average response time for all tiles requested 0.20 seconds
Average tile file size 24,483 bytes
Server bandwidth usage 6,807 MB/second
5.1.8 Discussion on performance results
When to use a WMS vs a WMTS ?
Results in Figure 3 and Figure 4 above indicate that the WMTS service is at least 4x more efficient at serving maps than the WMS. This is to be expected since the WMTS server serves pre-rendered maps while the WMS generates each map either on-the-fly or renders the map based on end-user requirements. There is an obvious processing cost for
generating and re-rendering a map. The trade-off for using the WMS versus the WMTS comes down to flexibility versus better performance and scalability. Both OGC WMS and WMTS map services meet important mapping requirements. In situations where a map is composed of a large number of geographic features and the properties of the features are important considerations for mapping, the WMS is still the best option. Using a WMTS in this situation would imply that all possible combinations of features and attributes would need to be pre-rendered. In most cases, this approach would not be realistic and would translate into larger storage costs for the tiled maps and data management problems for serving current maps.
reference system. In similar conditions, an OGC WMTS service can deliver, as demonstrated by the performance results above, performance and scalability
characteristics that are on par with commercial map services. Even the OGC WMS can achieve similar performance for a limited number of concurrent users. But the WMS will not scale up to a level comparable to the OGC WMTS or its proprietary commercial equivalents.
When to use EBS vs S3 data storage ?
S3 is well suited for exchanging large volumes of geographic features and deploying OGC WMTS to serve very large numbers of concurrent users in a collaborative and interoperable enterprise-wide environment. Performance and scalability results presented above indicate that the Amazon S3 configuration offers geospatial data providers an infrastructure that can be used to meet map publishing requirements of both small and large data provider organizations.
An Amazon EBS solution will also deliver very good performance but will not scale up to the level offered by S3.
Opportunities to develop more scalable and interoperable geospatial solutions:
The combination of OGC services with easy access to a Cloud infrastructure is offering, for the first time, the opportunity to deliver new geospatial solutions. They can match the performance and scalability characteristics of commercial web mapping products, support service integration between OGC and private commercial data services, and the
deployment of more robust service solutions in a distributed and collaborative environment.
5.1.9 Conclusion
Performance results presented above represent fantastic business opportunities to all players in the Geospatial Services industry including OGC.
First, these results should help dispel the false but persistent rumors regarding the poor performance of software products based on OGC standards. While it is true that each software implementation presents their own performance characteristics, results from these performance tests indicate that OGC-based service products can deliver
performance equivalent to commercial, mass market map offerings.
Second, the Cloud infrastructure offers fantastic untapped business opportunities for all players in the Geospatial Services industry including Geospatial data providers (small and large organizations). The impact of the availability of Cloud infrastructures on the
Geospatial Services industry is staggering. The Cloud infrastructure is opening up new business opportunities for all geospatial data providers. The following business
opportunities should be considered:
oCosts associated with preparing, packaging and shipping geospatial data can be considerably reduced or eliminated.
oEffort and costs associated with the purchasing of equipment and preparation of geospatial data for shipping can be reduced or eliminated.
oManagement effort associated with the recovery of material costs for shipping geospatial data can be reduced or eliminated.
oBecause single copies of data can be securely shared in a Cloud environment, costs incurred by all partners for replicating geospatial data from other data providers can be considerably reduced or eliminated.
oData provider organizations offering their data for a price, or simply interested in off-loading the data transfer costs out of an AWS Region to the data-requestor, can use new Cloud concepts such as the S3 Bucket “requestor-pays” feature to allow the Cloud provider to bill the requestor for them. The requestor in this case can be either a client machine or a server. This allows for both the monetized and free distribution of very large data-sets, traditionally bottle-necked by ftp servers.
oIn general with the Cloud, geospatial data can be exchanged at much lower costs.
Deploying robust and efficient Geospatial service products at much lower costs.
oPay only for the computer resources required to service your clients with the flexibility to scale your system up and down at any time.
oSelect OGC compliant software products that are demonstrating some level of efficiency.
oUsing a Cloud infrastructure for deploying Geospatial services is relatively easy but we recommend maintaining a focus on process efficiencies. There is a danger to hide current software inefficiencies behind the large availability of Cloud computing resources; this would have the opposite effect and will result in higher costs for the data publisher and/or its partners and in some cases all users of the system.
Deploying innovative and collaborative geospatial solutions. This can be realized by the use of software products based on interoperable OGC standards.
cost reductions by only serving their own data. Data integration from multiple OGC data services can be easily accomplished at the service level by any organization.
oReduce your data production costs by reducing or eliminating data manipulation or unnecessary processing steps within your data production system. For example, imagery data can be directly pushed to the Cloud provider site by data collectors as soon as the data has been captured and/or orthorectified. Notifications can be sent to the data administrator and at the push of a button the map service can be maintained up to date.
5.2 Performance enhancements of Geodata processing using a Hybrid Cloud (Section 2)
This section discusses and provides samples of cloud architectures in the context of web based geodata processing. More specifically, a Hybrid Cloud approach has been
investigated as a way to perform coordinate transformation of road datasets. 5.2.1 Introduction
This project presents the architecture and a performance analysis of a Hybrid Cloud approach to enhance the performance of geospatial processing. A fixed number of in-house virtual machines, a so called private cloud, are coupled with a large number of virtual machines from a commercial cloud provider.
5.2.2 Project Plan
The Hybrid Cloud deployed for this project presents the use of private Hybrid Cloud components deployed at 52°North with Cloud resources deployed at Amazon using their public AWS infrastructure.
5.2.3 Performance criteria
The Hybrid Cloud setup was benchmarked by Baranski et al. in 2011 [2] against several
Quality-Of-Service (QoS) requirements specified by INSPIRE. According to [2], “an INSPIRE Transformation Service must be available 99% of the time (availability), the maximum initial response time must be 0.5 seconds per each Megabyte (MB) of input data (performance) and a service instance must be able to fulfill both of these criteria even if the number of served simultaneous service requests is up to 5 per second (capacity).”. The 52°North WPS was extended to support INSPIRE compliant coordinate
transformation by implementing a WPS Application profile. In our test setup, the Private Cloud consists of four VM instances, based on two servers with two cores each. The Public Cloud (Amazon EC2), consists of six “small” instances using 64 bit.
5.2.4 Architecture
The described Hybrid Cloud approach was presented by [2]. The elements of the
Figure 8 - Hybrid cloud conceptual architecture (source [2])
The architecture described in more detail according to [2]:
W0A>,roxy component is the main entry point for all clients (users, applications and other services) and it controls access to the whole (local and third-party) server infrastructure. It receives all incoming service requests, forwards them to the
LoadBalancer at the Gateway, and returns the delivered response as if it was itself the origin.
The Gateway is an organizational unit containing a Load Balancer, a Cloud Controller, a Cloud Manager and a Virtual Machine (VM) Repository.
W0A>(H:=:E:G<>K<HFIHG>GM<Hntains a registry of all running service instances, the so-called IP Pool. The Load Balancer receives all forwarded requests from the Proxy and equally distributes them across all available service instances.
VM images exists. One image type is dedicated for use in the local infrastructure. The other image type is dedicated for use at the Public Cloud. Anyway, for each offered service, one VM image for each of the two types must be provided at the VM Repository. W0A>EHN=HGMKHEE>K<HFIHG>GMF:G:@>LMA>OBKMN:EBS>=EH<:E%0-infrastructure by providing an interface for starting and stopping VM instance on the local servers.
Therefore, on each of the local servers a host operating system together with a Hypervisor must be installed. The only task for the Hypervisor is to run the guest operating systems (VM).
W0A>EHN=):G:@>K<HFIHG>GMFHGBMHKLMA>,1EH:=HG>:<AKNGGBG@2)BGMA> architecture. If the overall CPU load of the system goes beyond a configured threshold, the Cloud Manager starts a new VM instance and adds the new running VM to the IP pool of the Load Balancer. In the ideal case, the VM is started via the Cloud Controller at a local IT-infrastructure. If all local servers are busy, the VM is started at the Public Cloud. If the overall CPU load of the system goes below a configured threshold, the Cloud Manager stops the running VM instance with the lowest CPU load (with a priority for running VM instances at the Public Cloud). Before the Cloud Manager stops a running VM, the VM is removed from the IP pool of the Load Balancer. Each time a new VM instance is added/removed from the IP pool of the Load Balancer, the Load Balancer must be restarted to notice the new resources. To avoid connection interruptions between the Proxy and the requesting clients (in the case the Load Balancer is not available for a short period of time), the Proxy component re-sends the forwarded requests to the Load
Balancer until they can be processed successfully.
5.2.5 Implementation
The Figure 9 below illustrates the implementation of the current Hybrid Cloud architecture used to perform coordinate transformation of road datasets.
For the Proxy component Apache HTTP Server was chosen combined with the mod_proxy module.
The Load Balancer is realized by an nginx server, which can be easily configured to distribute incoming requests equally.
Figure 9 - Hybrid cloud implementation architecture (source [3])
For the hypervisor in the Private Cloud we are using the Kernel-based Virtual Machine (KVM). We are using KVM images running an Ubuntu guest operating system. For the Public Cloud we are using Amazon EC2 resources, which offer pre-configured image types for Amazon Machine Image (AMI). These two image types are stored in the VM Repository.
Table 3 - Cloud Manager parameters (source [2])
With these parameters the scalability and efficiency of the system can be adapted to the particular geo-processing requirements. It is also possible to limit the financial expenses by specifying a maximum number of (pay-per-use) Public Cloud VM instances.
Figure 10 - Cloud Dashboard used for coordinate transformations
5.2.6 Performance enhancement use case
To illustrate the performance enhancement for coordinate transformations, the following three configurations were used:
Single server deployment
Private Cloud
Hybrid Cloud
5.2.7 Performance enhancement results – Single server deployment
Figure 11 - Average response time according to the number of simultaneously served requests in a single server deployment (source [2])
The figure above shows that the average response time to all requests sent to a single server increases significantly with the number of simultaneously requests served. The average response time increases from 2.7 seconds (two requests in 10 seconds) up to 61.3 seconds (40 requests in 10 seconds). The CPU load of the server was monitored and it was averaging near 100% most of the time. The server was not able to handle more than five requests within 10 seconds without increasing the average response time
significantly.
5.2.8 Performance enhancement results – Private Cloud
Figure 12 - Average response time according to the number of simultaneously served requests in a Private Cloud deployment (source [2])
We can see that the average response time increases from 1.6 seconds (four requests in 10 seconds) up to 5.9 seconds (40 requests in 10 seconds). All four local instances are used during peak loads.
5.2.9 Performance enhancement results – Hybrid Cloud
In the Hybrid Cloud deployment setup, the Cloud Manager was configured to use four local instances and six Public Cloud instances. The average response time of a request sent to the Hybrid Cloud together with the number of utilized local instances is shown in Figure 13.
Figure 13 - Average response time according to the number of simultaneously served requests in a Hybrid Cloud deployment (source [2])
The experiments show that a significant performance enhancement can be reached by the Hybrid Cloud approach.
5.3 Performance enhancements of DinSAR processing using a Hybrid Cloud
The principle of the Differential SAR Interferometry (DinSAR) is illustrated Figure 14, and can require large storage and compute-intensive scientific processing, as it is the case for the Small Baseline Subset (SBAS) technique involved in this testbed deployment. In this use case, we will exploit 64 differential SAR scenes for the generation of time series showing ground displacements over a decade in geological sensitive areas. This is part of an ongoing effort from ESA, CNR-IREA and Terradue partners to deliver updated and comprehensive time series over geologic phenomena, supporting scientific advising towards decision makers.
Figure 14 - The SAR Interferometry technique involved with the SBAS Cloud deployment
The Hybrid Cloud deployed by Terradue Srl for this project makes use of the private Cloud deployed at Terradue’s facilities, along with public Cloud resources provisioned at the Amazon Cloud Compute infrastructure in Dublin, using their AWS API, and
provisioned at the Interoute Cloud Storage Infrastructure in London, using Terradue’s Virtual Archive Cloud Service (a SAR data archive deployed as the contribution of the European Space Agency to the GEO Supersites Exploitation Platform, http://eo-virtual-archive4.esa.int).
5.3.1 Scope of work
This work demonstrates performance enhancements for a Cloud deployment of the SBAS (Small Baseline Subset) processing application with the use of WPS and OpenSearch OGC Web Services for the production of On-demand Ground Deformation Maps. The activity was conducted in OGC Testbed 10 by Terradue, in collaboration with CNR-IREA (SBAS processing chain) and with grant program from Amazon Web Services Education & Government Solutions. The deployment is exploiting resources from
Terradue (Cloud Controller), AWS (public Cloud), Interoute (public Cloud), and the GEO Supersites Virtual Archive (Cloud Storage of massive ESA SAR data).
5.3.1.1 Scientific data processing leveraging Cloud Computing
This service provides standard OGC CSW OpenSearch access to ENVISAT ASAR products, that can be exploited by a Differential SAR Interferometry processing. The CSW OpenSearch service endpoint for ASAR Level 0 products is described here:
http://eo-virtual-archive4.esa.int/search/ASA_IM__0P/description
The Institute for Electromagnetic Sensing of the Environment (IREA), an institute of the Italian National Research Council (CNR), incorporates a Microwave Remote Sensing Group that is active since 1987. Their main research interest is Differential SAR interferometry (DInSAR), with two main aims:
development of tools for detecting and monitoring of earth surface deformations;
demonstration of applicability of the proposed techniques in real scenarios.
IREA-CNR is the initiator of the well-known Small Baseline Subset (SBAS) processing technique for generating deformation time series starting from SAR data.
From earlier collaboration, IREA-CNR has implemented its SBAS-DInSAR processing chain in the G-POD (http://gpod.eo.esa.int/) and GENESI-DEC (http://www.genesi-dec.eu/) processing platforms of ESA, permitting to process in an automatic way several hundreds of GB of satellite data (mostly ERS and ENVISAT).
SBAS is a complex, multi-staged set of data processors, that has been re-engineered for the SSEP Cloud platform, in order to leverage the power of the Hadoop MapReduce Streaming distributed processing framework on Terradue’s PaaS.
5.3.1.2 Interoperability goals and performance requirements
Within OGC Testbed 10, we investigated the exploitation of OGC Web Service for the SBAS / MapReduce enabled processing chain, and their performance enhancement through Cloud deployment.
The goal is to promote the use of OGC client applications that can interoperate in a distributed Web Services environment, to discover and access remote data resources, and trigger processing tasks on a selected Cloud, according to a set of service providers agreements (i.e. working with a multi-tenant solution).
The SBAS processing chain is composed of 25 data processing steps, implemented with Terradue’s PaaS, resulting in Mapper and Reducer tasks that are managed by the Hadoop framework as a distributed pool of jobs, running on a Compute Cluster of any size. The connectivity between multi-tenant Clouds and the size of the selected processing cluster for the MapReduce operations are the main performance parameters for a time series production. For the producer of displacement maps, they have to fit with
The availability of OGC standard interfaces at the data access and data processing levels offers more flexibility in matching performance parameters and the exploitation
constraints. We describe in more detail these aspects in the following chapter. 5.3.1.3 Recommended approach
For virtualized infrastructures there is the concept of virtual computational resources. In particular AWS defines the concept of an EC2 Compute Unit, where the abstraction is in terms of computational power.
In the case of the SBAS processing chain, an approach can be to define the amount of RAM needed by a single process step and to setup accordingly the number of parallel processes.
For the interoperability testing and processing testbed, a stepped approach was followed in order to first validate the Cloud processing deployment on a selected Cloud (AWS) with manually staged input data, then the processing scalability (operation from the OpenNebula Cloud Controller), and then to involve the data staging from remote storage (SSEP Virtual Archive).
5.3.2 Project plan
The project plan for this deployment is as follows:
a) Exploit OGC-compliant WPS-Hadoop distributed data processing service,
deployed on Amazon Compute Cloud in Dublin using two different configurations (using 16 and then 32 nodes),
b) Exploit OGC-compliant CSW OpenSearch Virtual Archive deployed on Interoute Cloud Storage in London,
c) Compare the data staging performance between multi-tenant Clouds, for instance between Interoute London (Storage) and AWS Dublin (Compute) Clouds, d) Compare the performance of the distributed data processing service for each
configuration successively deployed on the Amazon Cloud,
e) Discuss the results and trade-off that should be considered when deploying OGC data services on multi-tenant Cloud Service providers.
5.3.3 Architecture
The software architecture is based on 3 main components:
Terradue’s Cloud Controller (IaaS brokering): based on OpenNebula (ONe) 4.2 distribution. OpenNebula is an open-source project developing the industry standard solution for building and managing virtualized enterprise data centers and enterprise private clouds. Terradue is a contributor to the OpenNebula open source baseline and it delivers native capabilities for Orchestration and Auto-Scaling of Cloud Multi-Tier Applications.
The Cloud Controller component offers a virtualized data center, where the administrator can define, execute and manage “services composed of interconnected Virtual Machines”, with deployment dependencies between them. In this setting, a service is composed by roles, each one corresponding to one VM template, and each one with certain cardinality, i.e, the number of instances of the same VM template.
A role's cardinality can be adjusted manually, based on metrics, or based on a schedule, thus providing with auto-scaling policies. Service management offers the ability to recover from fault situations, the ability to apply operations to all the VMs belonging to certain role, the ability to define a cooldown period after a scaling operation. Scheduling actions can also be applied.
Terradue’s Cloud platform (PaaS): based on Apache Hadoop Cloudera CDH3
distribution. Terradue is operating a Cloud processing service, leveraging the Apache Hadoop framework. The OGC-enabled WPS-Hadoop Cloud service, running on an OpenNebula-driven private Cloud, with:
-One appliance with WPS-Hadoop I/F
-Several Hadoop pseudo-clusters, configured from the Cloudera's Distribution -Hadoop (CDH3) baseline
Terradue’s Virtual Archive (SaaS): based on data repository technology and standard OpenSearch interface. It is delivered as a Cloud solution providing Storage-as-a-Service for earth data and is coupled with complementary services for user authentication and authorization, data discovery implementing simple OpenSearch interface exposing results in ATOM or RDF formats, and data access via common web protocols such as HTTP(s).
5.3.4 Implementation
These processing steps can then be configured to operate over a set of nodes running their tasks in parallel (general case) or as a single node of the Cluster that will be in charge to aggregate some intermediary data.
5.3.4.1 Data casting service with OGC OpenSearch interface
The Catalogue search service performs spatial, temporal and other queries in the available products of the ENSISAT ASAR collection “ASA_IM_0P”, as illustrated Figure 15 below. This search service provides a standard interface OGC SW OpenSearch Geo and Time extensions.
Figure 15 – the GEO Supersites Virtual Archive area of interest (OpenSearch query result rendered in Google Maps), featuring a set of ENVISAT ASAR products used for the OWS-10 SBAS testbed
For the SBAS activity demonstrated in OGC Testbed 10, the user query on the OGC CSW OpenSearch with Geo and Time extension interface of the SSEP Virtual Archive is:
http://eo-virtual- archive4.esa.int/search/ASA_IM__0P/html//?startIndex=0&q=asa_im_0p&start=2002-01-01&stop=2010-12-31&bbox=14.05,40.80,14.33,40.92
5.3.4.2 Data staging service between multi-tenant Cloud resources
Once catalogue resources are discovered and selected, the processing application will access data resources via a dedicated protocol for data staging.
The data staging flow must be sufficient to feed the data processing rate once the initial tasks are distributed on the cluster nodes.
According to the query interface defined above, the processing chain has its first
This processing node implements the stage-in process with an emulation of the quality control selection process defined by a CNR scientist. The input list of ASAR products produced by the OpenSearch query with date start, date stop and bounding box
parameters, retrieved from the ESA Catalogue available at
http://eo-virtual-archive4.esa.int, is filtered according to quality control criteria, before their stage-in, discarding the useless products.
The second processing job as defined in the Application Descriptor file of the PaaS will be run as a set of tasks on a set of compute nodes monitored by the Hadoop framework. It will start the processing of an ensemble of input SAR data as a selection of products, downloaded and ingested by the SBAS processor. Then intermediary results are passed to the next processing step and so on.
5.3.4.3 Data processing service with OGC WPS-Hadoop
The PaaS service builds on technology designed for use cases having data-intensive requirements. CNR-IREA implemented the SBAS processing chain with full control of code, parameters & data flows, in a collaborative way within a shared Platform delivered as a Service (a “Developer Cloud Sandbox), and using Cloud APIs to stage data and deploy code on ad-hoc computing clusters.
![Figure 8 - Hybrid cloud conceptual architecture (source [2])](https://thumb-ap.123doks.com/thumbv2/123dok/3207731.1393764/34.612.87.412.82.409/figure-hybrid-cloud-conceptual-architecture-source.webp)
![Figure 9 - Hybrid cloud implementation architecture (source [3])](https://thumb-ap.123doks.com/thumbv2/123dok/3207731.1393764/36.612.93.488.86.320/figure-hybrid-cloud-implementation-architecture-source.webp)
