ABSTRACT
This paper presents the analytical model of a brake system to investigate the low frequency vibration. The purpose of this study is to model and validate brake system vibration. The brake model was developed by applying the theory of sinusoidal traveling waves and wave super positioning. An experimental modal analysis (EMA) of the brake disc has been carried out to obtain the natural frequencies. Wave equations were then formulated based on the experimental data. These waves are super positioned to be shown as a single spatial and temporal function that will provide periodic excitation to the brake pad. The brake pad was modeled as a beam element with distributed friction force. The differential equations were solved using Green's dynamic formulation. The model is capable of predicting vibration behavior of the brake pad for whole range below 1 kHz which has shown strong agreement with the experimental results validated through in-house brake dynamometer. This brake model can serve as a tool to investigate the relationship between braking parameters and other variables within the brake system.
INTRODUCTION
The brake noise and vibration is an ongoing problem for brake system designers. Producing a noise and vibration free brake system is still a big challenge in the automotive industry. Brake system vibration modeling is crucial for vibration analysis and prediction. The prediction of brake vibration is essential in the efforts of reducing brake noise especially during the design phase of a brake system. In previous literatures, the available models are specific to the vibration type and it is oriented to the vibration generation mechanisms. The low frequency noise and vibration in particular is the current interest area due to the NVH requirements. The low frequency phenomena such as groan, roughness and judder falls within a relatively wide
range of frequencies compared to the tonal high frequency squeal [1]. Therefore, the identification of these frequencies is the first step in solving the brake vibration problem. Identification of these frequencies can be done through experiment but due to intermittent behavior of the brake system, capturing an exact frequency has becomes a challenge [2]. The brake system model should be developed to predict these frequencies so that the noise and vibration properties of the brake system can be evaluated before the vehicle manufacturing process takes place. The model must be able to predict all possible frequencies the system could vibrate so that preventive efforts could be taken before the vehicle production starts.
The primary source of the noise and vibration is the interaction of the brake pad and brake disc during braking [3]. Thus, the understanding of the dynamics of the friction pair of disc and pad is important in order to develop the mathematical model. The brake disc in an excited state acts as a sinusoidal wave and due to its rotation; it behaves as a traveling wave [4]. This characteristic can be used as the excitation for the brake pad during braking as the brake pad comes in contact with the brake disc. Upon contact, the brake pad is compressed due to the pressure applied by the brake piston [5]. Although, the compression deformation of the brake pad is nonlinear, for simplicity, the deformation is assumed to have linear behavior [6]. The brake pad in 2-dimensional view appears to resemble a beam [7, 8] and therefore, it can be modeled as such. In previous research work, the brake pad is modeled as a rigid body and the brake pad dynamics are derived. Taking into account the flexural mode shapes the brake pad undergoes during vibration, modeling the brake pad as an elastic beam model improves the accuracy of the brake pad model [9, 10].
The dynamic modeling of the brake pad is done as a beam element with various forces acting upon it which gives rises to a partial differential equation. The solution of such an equation
An Analytical Model to Identify Brake System
Vibration within the Low Frequency Domain
2013-01-2033
Published
09/30/2013
Kumaresan Magaswaran, Amrik Singh Phuman Singh, and Muhammad Zahir Hassan
Universiti Teknikal Malaysia Melakacan be obtained using the dynamic Green formulation as it is common in beam modeling The available literature shows that the Green function is used in conditions where the beam is subjected to a single periodic load may it be stationary or in motion but only acts at a single point at any given time [11, 12, 13]. The case of the brake pad vibration is more complicated where there are various loads in different directions and the distributed friction force to be taken into account. To author's best knowledge, this is the first attempt to apply the dynamic Green formulation in application of the brake friction pair. The contact of the brake pad and disc is an important part in the modeling because this is where the interaction that produces the vibration happens. The contact between the friction pair is non-conformal elastic contact [14]. This implies the contact patch between the friction pair may vary due to the motion of the pad and disc. The formation of small patches produce more noise than large contact patches and the size of the contact patch increases with brake pressure [15]. The friction force is dependent on this contact patches because friction directly proportional to these contact patches. This phenomenon was observed in [16] where the movement of the contact pressure due to disc rotation produced noise. Another important consideration is the mode coupling phenomena, this phenomena is the interaction between the vibration mode of the brake pad and the vibration mode of the brake disc when both pad and disc are in contact. Through this behavior the disc and pad is bound in unison. The friction force is the cause as it acts as an adhesive that binds the motion of the pad and disc together during braking [17]. All the mentioned consideration should be taken into account for the friction pair modeling to obtain a realistic outcome.
MODEL DERIVATION
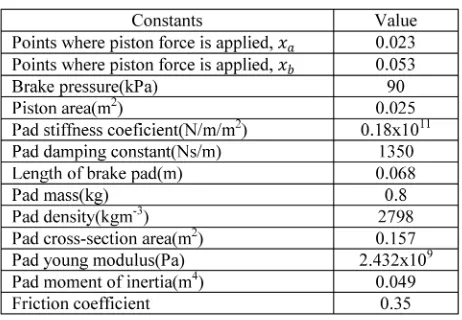
The modeling of the friction pair consist of the brake disc and the brake pad where the geometric data is given in Table 1. These two parts are modeled separately and interacted with each other at the contact points. The disc is modeled using wave functions and the brake pad is modeled as a Euler-Bernoulli beam. The brake pad is acted upon by forces such as normal force, dynamic normal force, shear force, damping force and friction force. These forces arise mainly due to the relative motion of the brake pad and disc.
The nature of the brake pad material to resist motion and deformation is included in the form of damping forces and the friction force which is a distributed force. The contact of the disc and pad is assumed to conformal elastic contact which means the contact area between the brake pad and disc is less than the area of the brake pad surface. Another assumption is that the friction pair is always in contact.
Table 1. Geometric and material data used in simulation
Brake Disc Modeling
For the modeling of the disc, only the bending mode vibration is taken in to account as the focus is the low frequency. The torsional and the in plane vibrational modes are more common to occur in the higher frequency domain. Upon braking, the brake disc is excited and it vibrates. The disc will undergo bending deformation as is vibrates. The deformation acts as a sine wave on circumferential direction of the disc. This wave is rotated as the disc rotates during operation. Thus the disc oscillation during operation behaves as a traveling wave. The combination of the disc rotation and vibration leads to equation 1 where wd is motion of a point on the disc with rotational frequency of w1, t is the time component of the motion. The disc vibrates with amplitude A at frequency of w2. The number of vibrational waves within the disc is represented as, k and x
is the spatial component that represents the length of the brake pad.
(1)
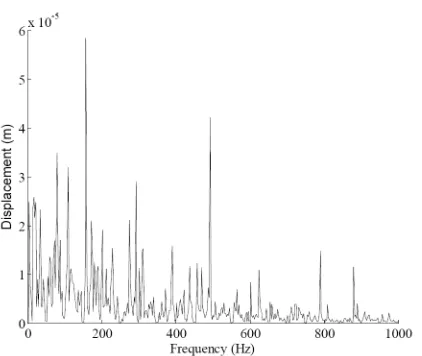
Figure 1. Frequency spectrum of brake disc modal testing
From the frequency spectrum, eight highest peaks frequency and amplitude are extracted and are incorporated into equation 3. The extracted frequencies are shown in Table 2. The frequencies and amplitudes are numerically labeled with prefix, n for ease of reference. Each frequency and amplitude pair will produce a traveling wave, and during actual running and braking operation all these waves superposition and acts as a single excitation. This equation was computed with disc rotation frequency of 104.72 rad/s; this would translate to approximately 110 km/h vehicle speed with 15 inches tire diameter. The outcome is the time domain of the excitation and from the time domain an FFT diagram is plotted. The FFT is then compared to Figure 1 to validate the wave function. The time domain plot of the computed equation 2 is shown in Figure 2. The time domain data is used to produce a frequency domain plot by performing a Fast Fourier Transformation (FFT). This plot is shown in Figure 3.
Figure 2. Time domain plot for rotational frequency 104.72 rad/s
Figure 3. Frequency domain plot for rotational frequency 104.72 rad/s
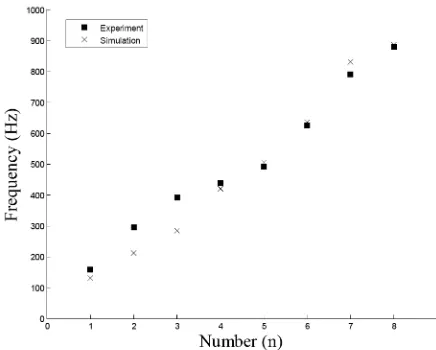
From the frequency domain plots, frequencies which correspond to the frequencies from the EMA are matched and their accuracy was compared. These results are tabulated in Table 2. In order to compare simulation results with the experimental results, a plot is produced by extracting the peak frequencies from the experimental and simulation frequency response is shown in Figure 4. From Figure 4, it can be seen that the simulated frequencies matches the experimental frequencies with acceptable level of accuracy. This means that the disc vibration in the brake system friction pair model coincides with the frequencies the disc brake is most probable to vibrate in an excited state.
Figure 4. Accuracy plot of experiment and simulation.
Brake Pad Modeling
The brake pad's motion is governed by the forces acting upon it. These forces are the normal force due to brake pressure, dynamic normal force due relative motion between the brake pad and disc which imposes a force on the brake pad which varies with time, shear force, damping force that rises due to the normal force and friction force. Figure 5 and 6 shows the schematic diagram of the friction pair modeling. Figure 6 is the cross section of the friction pair in Figure 5. The action of the mentioned forces on the brake pad is represented in equation 2.
(2)
Figure 5. Schematic view of the model
Figure 6. Cross-sectional view of the shematic diagram.
To solve equation 2, Dynamic Green formulation is applied. The brake pad motion, wb can be expressed in equation 3 as a function of the Green's function and the total forces acting on the brake pad. The Green's function is expressed in equation 4.
(3)
where,
Here, q is the frequency parameter separation constant.
The constants A1 to A4 and B1 to B4 are obtained by satisfying the following three conditions:
1. First are the boundary conditions at the ends of the brake pad.
2. Second is the displacement, acceleration and moment continuity condition at x = u
3. Third is the shear force discontinuity at x = u. During braking, the brake pad undergoes bending motions, thus the boundary conditions at the end of the brake pads are free [19].
DYNAMOMETER TESTING
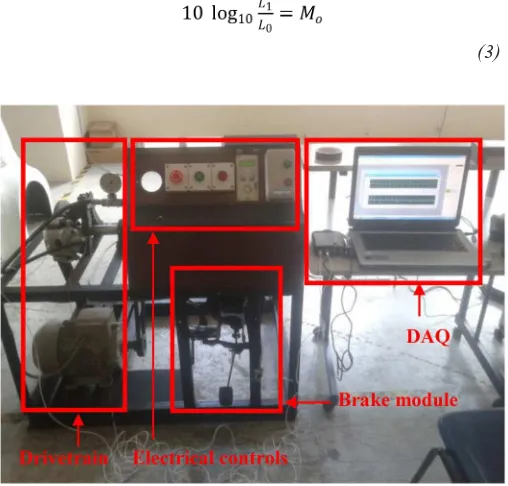
An in house developed brake dynamometer was used to conduct the experiment. The full view of the brake dynamometer is shown in Figure 7. The brake dynamometer was setup to measure the vibration of the brake pad during braking by placing accelerometers on the brake pad. The measurements of vibrations were done with reference to 1 mm/s2 for acceleration. This is the reason the unit dB can be
seen for displacement on the y-axis of the results. The measurement is made by comparing the severity of the measured vibration to 1mm/s2. The comparison is done through
equation 3, where L1 is the actual vibration compared to reference vibration, L0 resulting in the measurement output, Mo.
(3)
Figure 7. Full view of the brake dynamometer
Brake pressure of 0.9 bar was applied during braking. At this brake pressure the disc brake rotates without deceleration of the disc. In other words, the disc is able to run at a constant speed with the stated pressure applied. The power to run the disc to is provided by an electric motor. The output of the motor is manipulated to create a condition where the disc is able to run constantly at 1000 rpm during braking. By assuming the tire used is 175/65 R14, the equivalent velocity to 1000 rpm is 88.5 km/h. The data is analyzed in the form of vibration spectrum.
RESULTS AND ANALYSIS
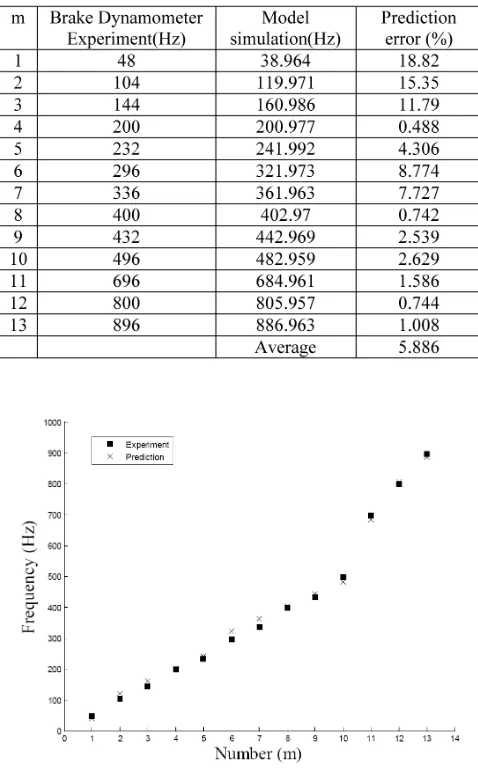
Fast Fourier transformation is performed on the time response of the simulation to identify the frequencies at which the vibrations occur. The FFT diagram for the brake pad response is shown in Figure 8. The peak frequencies are matched to the experimental brake dynamometer results wich is shown on Figure 9. Each of the frequencies extracted are numerically labeled with prefix, m for ease of reference. The prediction made by the model and its relative error compared to the experiment is tabulated in Table 3. To show the accuracy of the predicted and experimental frequencies Figure 10 is plotted.
Figure 8. Frequency response of the brake pad from the model
Generally, it can be said the frequency predictions are made with high accuracy relative to the experimental results. This can be seen in Table 3 as the average prediction error is about 5%. The brake system vibration is known to be intermittent and it is extremely difficult to reproduce results from a brake dynamometer test. This model was able to overcome this problem by predicting all the possible frequencies the vibration could occur. This is can be seen by comparing Figure 8 and Figure 9 where the experiment only yielded lesser noticeable frequencies but the modeling predicted a broader range of frequencies which is possible to occur at that speed. Nonetheless, the frequencies obtained from the experiment were predicted in high accuracy. Through experiment, only a few frequencies were observed, thus the comparison was made with those visible frequencies to assess the models prediction capabilities.
Table 3. Comparison between experimental and simulation results.
Figure 10. Accuracy plot comparing experimental and modeling prediction.
The other frequencies which are visible in the frequency spectrum are the possible frequencies which the brake vibration could occur. It can be seen quite clearly especially in Figure 8 that the frequency peaks shows harmonic behavior. This behavior occurs due to the distributed friction force and the nature of the contact where the excitation is simultaneous at all points of the brake pad upon contact. This floods the brake system with excitation energy. Due to the continuous rotation of the brake disc the system gets more and more excitation energy in time, when the system gets more excitation energy in time, the brake pad tends to vibrate in a broad frequency to adapt the energy within its system. Therefore the system is said to be unstable. The instability of the brake systems is a prime cause of brake noise.
The ability to predict and identify the vibration frequencies is important in the effort of eliminating brake vibration. The common method used in the effort of eliminating brake noise is the process of extracting eigenvalues from FEA model to identify the natural frequencies followed by parametric modifications to shift the natural frequency out of the range of the specific noise. As can be seen in Figure 8, the vibration frequencies during operation falls on a broad spectrum thus the shifting of the natural frequencies may not be efficient to eliminate noise because the shifted natural frequency may be shifted to another peak frequency. This may lead to further instability of the system.
CONCLUSION
The brake system model was able to simulate the brake pad characteristic in terms of operational vibration frequencies accurately. The frequencies obtained from simulation agree with brake dynamometer test results with high accuracy. The model predicted a wide range of frequencies that could occur during brake engagement. These frequencies were within the range of well-known noise and vibration that occur in the low frequency domain such as groan, roughness and judder.
The validation of this mathematical model would enable the model to be used to study the relationship between various breaking parameters and its effect on the brake system. In addition, other braking factors could be added to the model. Factors such as wear, temperature and deformation caused by the temperature change could be added to the model to study its effect on the brake system vibration characteristic.
REFERENCES
1. Jacobsson, H. “Aspects of disc brake judder,” Proceedings of the Institution of Mechanical Engineers, Part D: Journal of Automobile Engineering. 217 (6): 419-430, 2003
2. Wernitz B.A., Hoffmann N.P.. “Recurrence analysis and phase space reconstruction of irregular vibration in friction brakes: Signatures of chaos in steady sliding,” Journal of Sound and Vibration. 331: 3887-3896, 2012
3. Akay, A. “Acoustics of Friction,” Journal of the Acoustical Society of America. 111: 1525-1548, 2002
4. Kang, Jaeyoung, Krousgrill Charles M., and Sadeghi Farshid. “Wave pattern motion and stick-slip limit cycle oscillation of a disc brake.” Journal of Sound and Vibration 325(3): 552-564, 2009
5. Augsburg, K., Günther, H., Abendroth, H., and Wernitz, B., “Comparison Between Different Investigation Methods of Quasi-Static and Dynamic Brake Pad Behaviour,” SAE Technical Paper 2003-01-3340, 2003, doi:10.4271/2003-01-3340.
6. Wegmann, E., Stenkamp, A., and Dohle, A., “Relation between Compressibility and Viscoelastic Material Properties of a Brake Pad,” SAE Technical Paper 2009-01-3017, 2009, doi:10.4271/2009-01-3017.
7. Giannini Oliviero, Sestieri Aldo, “Predictive model of squeal noise occurring on a laboratory brake,” Journal of Sound and Vibration. 296(3):583-601, 2006
8. Nishiwaki, M. “Generalized theory of brake noise.” Proceedings of the Institution of Mechanical Engineers, Part D: Journal of Automobile Engineering 207(3): 195-202, 1993
9. Joe, Y -G., et al. “Analysis of disc brake instability due to friction-induced vibration using a distributed parameter model.” International Journal of Automotive Technology 9(2): 161-171, 2008.
10. Allgaier, R., et al. “A study on brake squeal using a beamon-disc model.” Proceedings IMAC XX 1: 528-534.2002
11. Abu Bakar, A., Ouyang, H., and Cao, Q., “Interface Pressure Distributions Through Structural Modiications,” SAE Technical Paper 2003-01-3332, 2003, doi:10.4271/2003-01-3332.
12. Foda, M. A., and Abduljabbar Z.. “A dynamic Green function formulation for the response of a beam structure to a moving mass.” Journal of sound and vibration 210(3): 295-306, 1998.
13. Abu-Hilal, M. “Forced vibration of Euler-Bernoulli beams by means of dynamic Green functions.” Journal of sound and
vibration 267(2): 191-207, 2003
14. Lueschen, G. G. G., Bergman L. A., and McFarland D. M.. “Green's functions for uniform Timoshenko beams.” Journal of sound and vibration 194(1): 93-102, 1996.
15. Eriksson Mikael, Bergman Filip, Jacobson Staffan, Surface characterization of brake pads after running under silent and squealing conditions. Wear, 232,(2),:163-167. 1999
16. Fieldhouse, J., Ashraf, N., and Talbot, C., “The Measurement and Analysis of the Disc/Pad Interface Dynamic Centre of Pressure and Its Inluence on Brake Noise,” SAE Int. J. Passeng. Cars - Mech. Syst. 1(1):736-745, 2008, doi:10.4271/2008-01-0826.
17. Hoffmann N., Fischer M. and Allgaier R., “A minimal model for studying properties of the mode-coupling type instability in friction induced oscillations” Mechanics Research Communications, 29:197-205, 2002.
18. Chen, W. Q., Lü C. F., and Bian Z. G.. “A mixed method for bending and free vibration of beams resting on a Pasternak elastic foundation.” Applied mathematical modeling 28(10): 877-890, 2004
19. Fieldhouse, John D., and Newcomb T. P.. “Double pulsed holography used to investigate noisy brakes.” Optics and lasers in engineering 25(6): 455-494, 1996
ACKNOWLEDGMENT
This work is supported by the Ministry of Higher Education (MoHE) of Malaysia through FRGS research grant which was provided to the Universiti Teknikal Malaysia Melaka of which provided the facilities for the research. This financial and facilities support is gratefully acknowledged
DEFINITIONS/ABBREVIATIONS
The Engineering Meetings Board has approved this paper for publication. It has successfully completed SAE’s peer review process under the supervision of the session organizer. This process requires a minimum of three (3) reviews by industry experts. All rights reserved. No part of this publication may be reproduced, stored in a retrieval system, or transmitted, in any form or by any means, electronic, mechanical, photocopying, recording, or otherwise, without the prior written permission of SAE. ISSN 0148-7191
Positions and opinions advanced in this paper are those of the author(s) and not necessarily those of SAE. The author is solely responsible for the content of the paper.
SAE Customer Service:
Tel: 877-606-7323 (inside USA and Canada) Tel: 724-776-4970 (outside USA) Fax: 724-776-0790
Email: [email protected]
SAE Web Address: http://www.sae.org