Vol. 9, No. 2, Desember 2008, hal. 228 - 247
THE COMPETITIVENESS OF SOYBEAN PRODUCTION IN
BLITAR-EAST JAVA, INDONESIA
Moh. Azis Arisudi 1 Salfarina Abdul Gapor 1 1
School of Social Sciences USM, Malaysia E-mail: [email protected]
ABSTRACT
In East Java Province, the government still provides subsidy to soybean production in the form of soft credit to production inputs. Since the government budget and subsidy have been limited, efficiency in production, marketing and trade become crucial issues. The conducted research will try to achieve some research objectives as follows: Analyzing soybean farmer income in the Blitar District at the different cropping system; Obtaining analysis on comparative advantage and competitive-ness of soybean by different cropping system; analyzing influences of social price changes to farmers income due to public investment; and analyzing government policy impact on farmers income due to market/actual price development. The research uses Policy Analysis Matrix to obtain competitiveness rate, efficiency and impact of government policy on soybean production under multi-cropping system and different ecological zones in the Blitar district.
Keywords: competitiveness, Policy Analysis Matrix
INTRODUCTION
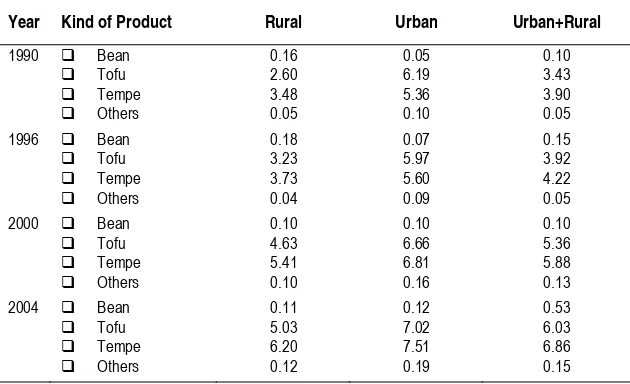
In Indonesia, soybean has an important role in providing national food supply. It is not only a protein source, but also sources of mineral, vitamin and fat. In 100 gram of soy-bean consists of 33.3 g protein, 15 g fat, 213 mg calcium, 0.65 vitamin B1, 0.23 mg vita-min B2 and vitavita-min C (Hermana, 1998). So, the high stock of soybean in a country will increase the nutrient of society through high consumption of soybean and its processed products such as tofu, tempe, and soy sauce. Demand for soybean increases gradually, since industrial sector based on soybean product has been growing significantly. As input for processing industry, demand for soybean in the country tends to increase
pro-gressively in the form of bean and processed ones.
2004. However, fresh fish consumed in urban area increased from 15.1 kg/capita to 18.2 kg/capita in the period. In rural areas the situation was not so different, fish consump-tion increased from 10 kg/capita to 13.5 kg/capita (Central Bureau of Statistic 2004).
In general, we can say that people will take protein not only from meat but also from other sources as long as the price of meat and other main foods still can be covered. In other words, the consumption pattern will be determined by their income. In 2004, soy-bean consumption of three different income groups was different significantly, i.e., 13.3 kg, 21.1 kg, 29.3 kg per capita (Central Bureau of Statistic 2004). This reality shows us that the high-income group consumed more soybeans than less income group. So, we can expect that the soybean market can be extended when economy and income per capita are improved.
Soybean import is used as food material for veterinary and industry. The volume of soybean import in 2001 was 800,000 ton and in 2002 increased 807,000 ton and increased 746,000 ton in 2003. In the period 2001-2003, the import volume of soybean increased continually. The average national production was 1,211 kg /ha in 2003 and this is below laboratorial production of 2,000-3,000 kg/ha 2002 (Department of agricul-tural, 2004). This indicates that government efforts in increasing soybean production are still far from successful. The low productiv-ity were caused by low technical practice, low technology transformation, agricultural management that has less orientation to busi-ness. These all lead to low domestic produc-tion and increased import of soybean peri-odically.
The efforts for increasing efficiency should take consideration optimal resource use. Not only optimal resource use can lead Table 1. Soybean Consumption by Kinds in Indonesia 1990-2004 (kg, capita, year)
Year Kind of Product Rural Urban Urban+Rural
1990 Bean
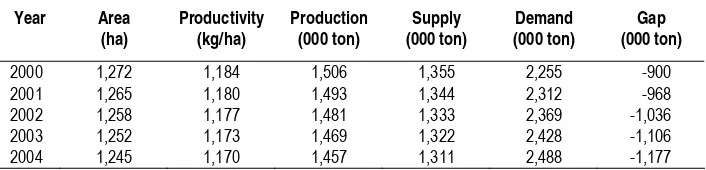
to increase production costs, other factors include uncertainty factors such as weather and disease. Low production consequently can cause low income. Price is also a sig-nificant factor that can influence farmer’s income. Price and production fluctuation lead to farmer’s irrational decision in risk (risk averter) especially among small farmers (Monke and Pearson 1994, Timmer 1988). Other factors such as socio and economic factors can also influence farmer’s habit from making rational choice. Table 2 below explains the development of soybean according to average production, and import from 2000 to 2004.
Table 2 shows that soybean production tends to decrease about 0.81 percent annu-ally. A reduction of land under soybean cul-tivation at a rate of 52% annually also caused the decrease. Meanwhile, the productivity is relative stagnant or decreases about 0.29% annually. In Java, soybean production area decreases continuously due to demand for land use as a result of population stress while in outer islands are relatively stabile. More-over, total demand for soybean either for food and veterinary increased about 2.21% per year. Due to progressive increasing demand compared to domestic supply.
Some constraints are still taking place in
increasing domestic production, namely:
1. Land extension is limited due to different land acidity in the country,
2. Most of the newly extended land are hilly and wavy, so it leads to easy erosion, 3. Low adoption and assessment of
technol-ogy at the farmer level and fluctuation of prices.
Therefore government intervention is still needed in soybean production and trade. Theoretically, there is still debate on neces-sity of government intervention and market mechanism. There are some reasons why market mechanism in agricultural product cannot work properly, namely:
1. Asymmetry of information, especially in less developing countries the current price cannot characterize level of effi-ciency of the product and the producers do not react to current prices;
2. Agricultural products depend highly on climate, season and areas. So, the pro-ducers can respond to the market prices as long as climate and season can be changed and transferred.
As we all know, since 2001 the govern-ment of Indonesia has introduced a new pol-icy the so called “decentralization polpol-icy”. This policy has influenced structure of the
Table 2. Area, Production, Productivity, Supply, and Demand for Soybean from 2000-2004 Year Area
(ha)
Productivity (kg/ha)
Production (000 ton)
Supply (000 ton)
Demand (000 ton)
Gap (000 ton)
2000 1,272 1,184 1,506 1,355 2,255 -900
2001 1,265 1,180 1,493 1,344 2,312 -968
2002 1,258 1,177 1,481 1,333 2,369 -1,036
2003 1,252 1,173 1,469 1,322 2,428 -1,106
2004 1,245 1,170 1,457 1,311 2,488 -1,177
Indonesian economy. This policy also pro-vides opportunity for a province to determine the main agricultural products that can sup-port their regional economic development.
Since East Java province is been famous as food supplier for national production, some agendas in developing agricultural sector have been set up. There the provincial government has established an integrated development between agricultural and indus-trial sector. It is expected that agricultural product can support industrial development program or in other words, it should be a linkage between both sectors closely. From this point of view, agricultural product map-ping is really needed to ensure an efficient industrial development program. Other as-pects that can be very important in develop-ing regional economy are increasdevelop-ing com-petitiveness of agricultural and industrial product.
Increasing competitiveness depends strongly on production process, marketing, and trade. An efficient production process, marketing and trade can stimulate and deter-mine competitiveness of products. Provincial government of Blitar has determined that soybean can be selected as main product of the local. The province has also high produc-tion of soybean and the soybean processing industries such as soy sauce, tofu and tempe. For tofu and tempe, most of industries are small-scale enterprises and the number of these industries is enormous throughout the region. We can see that the demand for soy-bean in the province is still higher than pro-vincial production of soybean.
Policies issues from this researchs are as follows; They expect that soybean produc-tion will stimulate significant economic growth in East Java Province. East Java’s
provincial needs for soybean cannot be fulfilled by local soybean production and substantial amounts of beans and meal are imported to fulfill this gap.
Government still provide subsidy to soybean production in the form of soft credit to production inputs. Since government budget and subsidy have been limited, effi-ciency in production, marketing and trade become crucial issues. A high efficiency will increase farmer income. It means new (ap-propriate) technology should reduce produc-tion costs and increase efficiency. The new technology applied is seed “WILIS 2000” and irrigation land (Lodagung Irrigation).
The proposed research will develop farm budgets for soybeans with different applied technology that will show the profitability of soybean production. With these results in hand, conclusions can be drawn about the likelihood that the proposed policies will meet the government’s objective of reducing dependency on imported soybeans.
The research will try to achieve some research objectives as follows:
1. Analyzing soybean farmer income in Blitar District at the different cropping system;
2. Obtaining analysis on comparative advantage and competitiveness of soy-bean by different cropping system;
3. Analyzing influences of social price changes to farmer’s income due to public investment;
4. Analyzing government policy impact on farmer’s income due to market/actual price development;
1. The result of the research will provide information to the provincial and district government. The expanded data with new technology of different kinds of investments could be used as alternative policy to increase the soybean produc-tion.
2. Technical change resulting from support of soybeans would improve the effi-ciency of the system and increase the soybean farmer’s income.
Theoretical concepts in this research as follows:
1. A Framework for Agricultural Policy Analysis
Everyone involved in agricultural policy and project analysis should have a clear way of thinking about evaluating decisions. On what grounds can one alternative be judged better than another? How much policy is enough? Is economic efficiency the only thing that matters? For rational decision-making to take place, each of us needs a clear and logical way to evaluate policy options. In an ideal setting, everyone would have a similar way of approaching policy decisions. Then dis-agreements would be limited to genuine dif-ferences of opinion rather than including also misunderstandings about approaches to problem solving. This chapter sets out a gen-eral logical approach for carrying out agri-cultural policy analysis.The specifics of the Policy Analysis Matrix (PAM) then are introduced in succeeding chapters.
A well-understood framework for agri-cultural policy analysis is needed for deci-sion-makers and interest groups to under-stand the consequences of policy actions (Pearson, 2003). The clarity of definitions is
critical in policy analysis. What is meant by the term, “framework for agricultural policy analysis?” A framework is an organized and consistent approach for clear thinking. With-out it, policy debate can quickly reduce to misunderstanding and emotionalism. A framework is designed to permit the study of linkages in economic systems. Good eco-nomic analysis is fascinating for economists, frustrating for non-economists, and relevant for everyone because it focuses on linkages within an economy – on why one group’s actions influence others in the system. Agri-cultural refers to the production and con-sumption of commodities that are produced by cultivating crops or raising livestock. Policies are government actions intended to change behavior of producers and consum-ers. Analysis consists of the evaluation of government decisions to change economic behavior. A framework for agricultural pol-icy analysis, therefore, is a logical system for analyzing public policies affecting producers, marketers, and consumers of crops and live-stock products.
2. Four Components of a Policy Framework
out-comes. Effective policies change the behav-ior of producers, marketers, and consumers and create new economic outcomes. Strate-gies are the sets of policy instruments that government officials can use to achieve their objectives. Each strategy is enacted through the introduction of a coordinated set of poli-cies.
The strategies of policy makers consist of sets of policies that are intended to improve economic outcomes (as judged by the policy makers). The selected policies work through the constraints set by economic parameters. The constraints set by supply, demand, and world price conditions, either further or impede the attainment of tives. An assessment of the impact on objec-tives permits an evaluation of the appropri-ateness of given strategies. Governments thus form agricultural strategies by choosing a set of policies to further their objectives subject to the constraints on the agricultural econ-omy. With this logical picture in mind, it is important to review each of the four compo-nents in more detail.
3. Fundamental Objectives of Policy Analy-sis
Most goals of government policy fall under one of three fundamental objectives – effi-ciency, equity, or security. Efficiency is achieved when the allocation of scarce resources in an economy produces the maxi-mum amount of income and the allocation of goods and services brings highest consumer satisfaction. Equity refers to the distribution of income among groups or regions that are targeted by policy makers. Typically, greater equity is achieved by more even distribution of income. However, because policy refers to
government actions, the policy makers (and indirectly voters in a democracy) define equity. Security is furthered when political and economic stability allows producers and consumers to minimize adjustment costs. Food security refers to the availability of food supplies at affordable and stable prices. In this framework, any goal that a policy-maker is hoping achieve through government intervention will be incorporated within one of the three fundamental objectives – effi-ciency, equity, and security.
Trade-offs arise when one objective can be furthered only if another is impeded – that is, when gains for one goal result in losses for another. When trade-offs exist, policy-makers have to place weights on the con-flicted objectives – by determining how much they value gains from one objective versus losses associated with a second objec-tive. Policy makers – not economic analysts – have the responsibility to make these value judgments and assign weights to objectives. These government officials have the ultimate responsibility to be accountable for their policy actions. In the rare instances when trade-offs do not arise, policy analysis and policy making are easy. The desired result is to move forward to the extent that resources permit. Typically, however, trade-offs do exist. Then economic analysts need to evalu-ate policies, and policy makers need to make decisions by placing weights on objectives. The weights have to add to one (e.g., an indi-vidual policy maker might place weights of 0.6 on efficiency, 0.3 on equity, and 0.1 on security).
4. Constraints that Limit Agricultural Policy
and world prices. Supply, national produc-tion, is limited by the availability of re-sources (land, labor, and capital), technolo-gies, relative input prices, and management capabilities. These parameters are the com-ponents of production functions and thus limit the ability of the economy to produce agricultural commodities. Demand, national consumption, is limited by population, income, tastes, and relative output prices. These parameters are the components of demand functions and thus limit the ability of the economy to consume agricultural prod-ucts.
World prices, for internationally tradable outputs and inputs, define and limit the opportunities to import to increase domestic supply and to export to increase markets for domestic production. These three economic parameters define the market for an agricul-tural commodity and are the fundamental forces that influence price formation and the allocation of resources. The economic con-straints lead to trade-offs in policy making.
5. Categories of Polices Affecting Agricul-ture
Policies influencing the agricultural sector fall into one of three categories – agricultural price policies, macro-economic policies, or public investment policies (National Plan-ning Development Board, 2001). Agricul-tural price policies are commodity specific. Each price policy targets only one commod-ity (e.g., rice) at a time. Price policies also can influence agricultural inputs. Macro-eco-nomic policies are nation-wide in coverage. Macro policies thus affect all commodities simultaneously. Public investment policies allocate capital expenditures from the public
budget. They can affect various agricultural groups – producers, traders, and consumers – differently because they are specific to the areas where the investment occurs.
6. Agricultural Price Policy Instruments
All agricultural price policy instruments cre-ate transfers either to or from the producers or consumers of the affected commodity and the government budget. Some price policies affect only two of these three groups, whereas other instruments affect all three groups. In all instances, at least one group loses and at least one other group benefits. Policy analysts need to consider three catego-ries of agricultural rice policy instruments – taxes and subsidies, international trade re-strictions, and direct controls.
Taxes and subsidies on agricultural commodities result in transfers between the public budget and producers and consumers. Taxes transfer resources to the government, whereas subsidies transfer resources away from the government. For example, a direct production subsidy transfers resources from the government budget to agricultural pro-ducers.
International trade restrictions are taxes or quotas that limit either imports or exports. By restricting trade, these price policy in-struments change domestic price levels. Im-port restrictions raise domestic prices above comparable world prices, whereas export restrictions lower domestic prices beneath comparable world prices.
“black markets” of illegal trade render the direct controls ineffective. Occasionally, some governments have sufficient police power to enforce direct controls in the ab-sence of accompanying trade regulations. Direct controls of cropping choices can be enforced, for example, if the government allocates irrigation water or purchased inputs.
7. Macro-economic Policies Affecting Agriculture.
Agricultural producers and consumers are heavily influenced by macro-economic po-lices even though they often have little influ-ence over the setting of these nation-wide policies. Three categories of macro-economic policies – monetary and fiscal policies, foreign exchange rate policies, and factor price, natural resource, and land use policies – affect agriculture (Timmer, Falcon, and Pearson, 1983).
Monetary and fiscal policies are the core of macro-economic policy because together they influence the level of economic activity and the rate of price inflation in the national economy, as measured by increases in indexes of consumer or producer prices. Monetary policies refer to controls over the rate of increase in the country’s supply of money and hence the aggregate demand in the economy. If the supply of money is increased faster than the growth of aggregate goods and services, inflationary pressure ensues. Fiscal policies refer to the balance between the government taxing policies that raise government revenue and the public expenditure policies that use that revenue. When government spending exceeds reve-nue, the government runs a fiscal deficit. That result creates inflation if the
govern-ment covers the deficit by expanding the money supply.
Foreign exchange rate policies directly affect agricultural prices and costs. The for-eign exchange rate is the conversion ratio at which domestic currency exchanges for for-eign currency. Most agricultural commodi-ties are traded internationally, and most countries either import or export a portion of their agricultural demand or supply. For in-ternationally tradable commodities, the world price sets the domestic price in the absence of trade restrictions. The exchange rate thus directly influences the price of an agricultural commodity because the domestic price (in local currency) of a tradable commodity is equal to the world price (in foreign currency) times the exchange rate (the ratio of domestic to foreign currency).
8. Public Investment Policies Influencing Agriculture.
The third category of policies affecting agri-culture includes public investments from the country’s capital budget – in infrastructure, human capital, and research and technology. Public investments in infrastructure can raise returns to agricultural producers or lower agricultural costs of production. Infrastruc-ture refers to essential capital assets, such as roads, ports, and irrigation networks, which would be underprovided by the private sec-tor. These assets are known as “public goods,” and they require public spending from the government’s capital budget. In-vestments in infrastructure are by nature par-ticular to specific regions and benefit mostly the producers and consumers who live in those regions. Public investment policy is complicated by the fact that infrastructure must be maintained and renewed.
Public investments in human capital include a wide range of spending from the government’s capital budget to improve the skill levels and health of agricultural produc-ers and consumproduc-ers. Investments in formal schools, training and extension centers, pub-lic health facilities, human nutrition educa-tion, and clinics and hospitals are examples of public capital spending that could raise the level of human capital in the agricultural sector. These investments are critical for long-term development, but they often take many years to show dividends in agriculture.
Public investments in research and tech-nology are another example of “public goods” that directly benefit agricultural pro-ducers and consumers. Countries that enjoy rapid agricultural growth typically invest heavily in agricultural research to breed or adapt high-yielding varieties of food and
cash crops developed in international research centers abroad. These “miracle seeds” often require new agricultural production technologies, utilizing better water control and more intensive application of purchased inputs. For some commodities, the technological breakthroughs, funded by public investment, are in agricultural proc-essing rather than in farming.
RESEARCH METHOD
The research will be based on different kinds of empirical analytical studies that focus on the:
1. Evaluation of influences of the macro economic performance and policy on soybean development at the local gov-ernment level;
2. Evaluation of soybean market and local regulation on domestic trade as impact of national policy on soybean development. This will illustrate the problems and challenges on increasing soybean pro-duction and lastly how the farmer increases their income.
In general, the stratified sample survey method is applied at the micro level to obtain primary data, while secondary data could be collected from government agencies and central bureau of statistics at various levels. The survey was carried out in the Blitar district of East Java because the reason the region is a center of food production (espe-cially soybean) in East Java province. In the district, we have selected 4 sub-districts, namely: Binangun, Panggung Rejo, Kade-mangan, Wonotirto, and Bakung.
res-pondents, i.e., soybean farmers, traders, and government officials have been collected as primary data. The place of interview was basically at the fields and the efforts were made to obtain ‘a comfortable’ or neutral type of interview, to establish a relation of confidence and also to allow questions to be posed on delicate problem fields, individual experiences and personal opinions.
Apart from the respondents, several other key-informants who are particularly knowledgeable about the matters and socio-economic situation of such regions, were also interviewed to collect valuable information. In addition, individual in-depth interviews were also needed to obtain more detailed information. The person interviewed was free to voice his/her own concerns in an unstruc-tured interview. The interviewer relied on open questions to introduce topics of interest, without the interviewer imposing his or her ideas. Data and information gained from field observation and by interviewing some key-informants turned out to be valuable for this study.
Secondary data are, to a limited extent, also very importantto support this study. The kind of secondary data such as Gross Domestic Regional Product, population den-sity, infrastructure, land areas, production rate of soybean and productivity are issued by the Department of Agriculture, the Central Bureau of Statistics or the Regional Planning Development Board. According to previous experiences, we should be careful with these different sources of data. For example, data published by a source could have a different value when published by other ones. To overcome this problem, we should be consistent in selecting and collecting the data.
The survey was designed to generate data in relation to the following aspects:
1. Production, intermediate input and pro-duction input aspect;
2. Post-harvest activities including market-ing, transportation cost and other costs that influenced the end price such as po-lice tariff (illegally); and
3. External factors such as government pol-icy (subsidies), CIF price and other charges in port (non-formal).
Research Area
District Blitar consists broadly 1,628.58 km2 of 267.58 km2 settlement area (kampong), 336.12 km2 rice field, 490.29 km2 dry land, 143.93 km2 plantation, 325.18 km2 forest area, 13.20 km2 desert and 52,50 km2 which consist of other types of land. District Blitar lay in coordinate 111° 40 - 112° 10' Longi-tude East and 7° 09' Transversal South. To-pography of district Blitar have highest posi-tion 800 meter and the lowest 40 meter of sea surface (Central Bureau of Statistic of Blitar District, 2004).
Regional boundary of district Blitar is as follows:
• North boundary is district Kediri and Malang district;
• Southern is Indonesian ocean; • Eastern is Malang district; and • Western is Tulungagung and Kediri
Economic Structure of Research Area
plantation, and food crops. Approximately 67 percent of the District is farm land growing rice and dry land crops. The remaining 33 percent consists of plantations, forests, and mining operations.
Soybean Prices in Blitar District
Empirically the national price of soybean since 1990 to 1996 has been increasing mod-erately, on the average 3.7% annually. There-fore, it can be concluded that over this period, the price of soybean was relative stable. Four months after the financial crisis (mid of 1997), the prices of all goods exhib-ited uncontrolled increases. This multidimen-sional crisis changed consumption behavior throughout the country. Soybean products also increased in price. In August 1998, the domestic soybean price was 2,300 Rp per kg. The imported soybean price was 3,500 Rp per kg. At these prices, domestic soybeans had a competitive advantage.
Table 3. Domestic and Import Prices of Soybean from 1990 to 2008 Year Domestic
Soybean (Rp/kg)
Import Soybean (Rp/kg)
1990 847 489.63
1991 905 518.39
1992 833 536.46
1993 1,010 482.72
1994 1,087 646.60
1995 995 663.93
1996 1,092 803.17
2007 5,450 6,200
2008 7,500 8,400
Source: Central Bureau of Statistic (1990, 1995, 2007), Statistic of Agr 2008
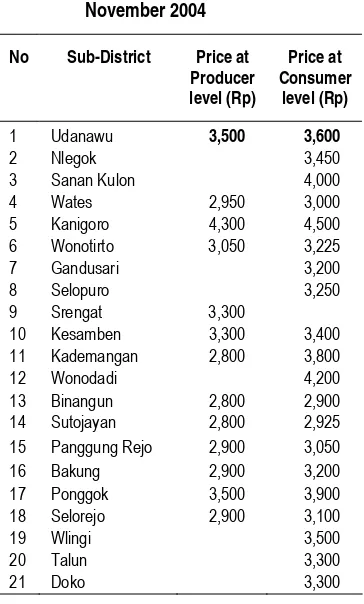
Table 4. Soybean Prices in Blitar District,
November 2004
No Sub-District Price at Producer level (Rp)
Price at Consumer
level (Rp)
1 Udanawu 3,500 3,600
2 Nlegok 3,450
3 Sanan Kulon 4,000
4 Wates 2,950 3,000
5 Kanigoro 4,300 4,500
6 Wonotirto 3,050 3,225
7 Gandusari 3,200
8 Selopuro 3,250
9 Srengat 3,300
10 Kesamben 3,300 3,400
11 Kademangan 2,800 3,800
12 Wonodadi 4,200
13 Binangun 2,800 2,900
14 Sutojayan 2,800 2,925
15 Panggung Rejo 2,900 3,050
16 Bakung 2,900 3,200
17 Ponggok 3,500 3,900
18 Selorejo 2,900 3,100
19 Wlingi 3,500
20 Talun 3,300
21 Doko 3,300
Source: Survey
Soybean Cropping System in District Blitar
Several cropping systems exists in Blitar District:
1. Irrigated Paddy Field
September-December
January- May
June- August
Paddy Paddy Soybean
Source: Survey
started in January to May when the dry season starts. This season is called as “Musim Padi Gadu”. Empirically, gadu season often results a better harvest than Musim Padi Raja.
2. Wet Paddy Field
September-November
December-April
May-August
Soybean + Corn
Paddy Soybean+Corn+ Chili or Peanut+ Corn+ Chili Source: Survey
Note: Another alternative crop is sugarcane, especially as a substitute for peanuts, corn and chili.
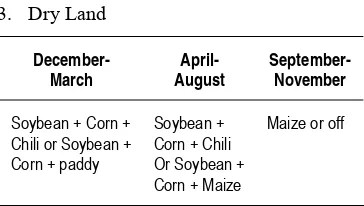
3. Dry Land
December- March
April- August
September- November
Soybean + Corn + Chili or Soybean + Corn + paddy
Soybean + Corn + Chili Or Soybean + Corn + Maize
Maize or off
Source: Survey
The survey showed that, at the peak of the dry season in September and November, many dry lands were not used productively. The only work on them was in preparation for the next plantation. The research sample contained all of the cropping patterns described above. For the purpose of the study, cropping systems were divided into four groups. These groups made it possible to compare the following categories:
1. Traditional technology vs. improved technology
2. Irrigated land vs. non-irrigated (dry land)
3. Multi-cropping vs. monoculture
The Study Areas
In this part, the characteristics of study areas within the District of Blitar will be described. Irrigated and non-irrigated-land were used to determinate sample design. Moreover, the dividing line of these areas is the market distance from the central market and infra-structure. The study areas are structured from the specific region to the region situated at the longest distance from the central market. Graphically, these study areas are showed by
Figure 1.
Figure 1. The Four Study Areas and Their Distance from the Central Market
Method of Analysis
The method of analysis that is used in this research is Policy Analysis Matrix (PAM). This is to obtain competitiveness rate, effi-ciency and impact of government policy on soybean production under multi-cropping system and different ecological zones in the Blitar district. The various cropping systems can be depicted in Figure 2.
Based on the real condition, soybean-cropping system can be divided into seven kinds:
1. Soybean production by traditional system 2. Soybean production by using technology
Central Market
Areas near or influenced by central market growth
Areas far from the central market
3. Soybean production by using technology at irrigated land
4. Soybean production by using technology at non irrigated land
5. Soybean production by using technology toward monoculture system at irrigated land
6. Soybean production by using technology toward multi-cropping system at irrigated land
7. Soybean production by using technology toward multi-cropping system at non-irrigated land
Sample is selected from population proportionally. The total number of sample is 70 where by 10 samples are from each cropping systems as mentioned. Table 4
Policy Analysis Matrix (PAM) and its components will be explained properly.
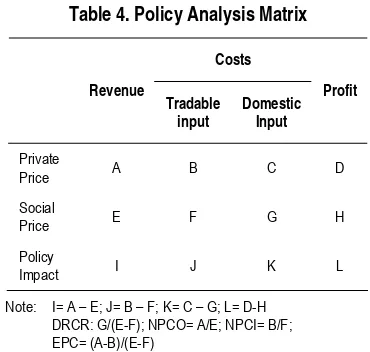
Table 4. Policy Analysis Matrix
Costs
Revenue
Tradable input
Domestic Input
Profit
Private
Price A B C D
Social
Price E F G H
Policy
Impact I J K L
Note: I= A – E; J= B – F; K= C – G; L= D-H DRCR: G/(E-F); NPCO= A/E; NPCI= B/F; EPC= (A-B)/(E-F)
Private Profit (D)
Private profit is used to show how much profit that can be obtained by soybean farmer per area (e.g. ha) based on private price
1. Soybean production by traditional system
2. Soybean production by using technology
3. Soybean production by using technology at irrigated land
4. Soybean production by using technology at non irrigated land
5. Soybean production by using technology at irrigated land with monoculture
6. Soybean production by using technology at irrigated land with multi cropping
7. Soybean production by using technology at non irrigated land with multi cropping
Source: Survey
Social Profit (H)
Social profit can be seen through difference between output produced and input tradable and non-tradable based on social price.
Output Transfer (I)
Output transfer is transfer receipt by produc-ers through output price. The output price is influenced by government policy. The more output transfer value, the higher the support of the government policy.
Input Transfer (J)
Input transfer shows the number of transfer receipt by soybean producers through input price. The higher input transfer, the cheaper input price paid by producers.
Factor Transfer (K)
Factor transfer is transfer receipt by produc-ers through domestic input factor. The higher factor transfer, the lower factor price paid by producer
Net Transfer (L)
Net transfer is used to show whether the gov-ernment policies have positive or negative transfer on production system of soybean. A positive net transfer mean supporting of gov-ernment on the soybean production system, a negative is opposite one.
DISCUSSION
Because of the various cropping systems and different ecological zones in Blitar district, a number of PAM models have been devel-oped. The traditional system is one in which soybean farmers use traditional seed that is of low quality. These seeds are bought at the local market. Most of them are unbranded and are only for household consumption. Traditional soybean farmers rarely use com-posite fertilizer, and they harvest only once per year.
Improved technology systems use high quality seed (WILIS 2000). This seed has already proved that it can increase produc-tivity significantly. Improved technology can be found on both irrigated and non-irrigated land. It can also be used in both monoculture and multi-culture cropping systems.
The results of Policy Analysis Matrix (PAM) calculation of soybean by using tra-ditional technologyis depicted as follows:
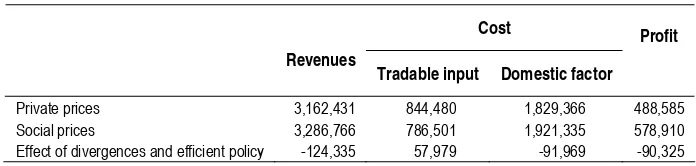
Based on Table 5, it can be seen that obtained private revenue was Rp.3,162,431, and social revenues in amount of Rp.-3,286,766. There is a divergence and it can be seen from lower private revenue than social revenue. It is especially caused by trading system, where the soybean farmers sell not directly to the market but the buyers come and determine the soybean price
Table 5. PAM Calculation by Using Traditional System Cost Revenues
Tradable input Domestic factor Profit
Private prices 3,162,431 844,480 1,829,366 488,585
Social prices 3,286,766 786,501 1,921,335 578,910
Effect of divergences and efficient policy -124,335 57,979 -91,969 -90,325
directly at the location (farm or farmer house). It causes farmer revenue to become less than social revenue. This is due to long market distance and most of the farmers have no transportation tools such as motor cycle or even a car to sell their products directly to the market.
Private profit in the amount of Rp.-488,585 shows an actual profit that will be receipted by the farmers with cropping sys-tem no technology application. This number is smaller than profit obtained in the crop-ping system with technology. This is caused by lack of knowledge of the farmers in how to plant properly and time and number of fertilizer needed. They just plant without any technical consideration.
The social profit Rp.-578,910 shows that the system has very strong efficiency or comparative advantage (shown by high social profits, 18 percents of social revenue). This results also shows that soybean production, even with traditional technology, does not require any protection or subsidy to obtain high excess profit. This is a very important result in according with false claims of farmer organizations that soybeans farmer cannot compete with import soybean if they do not receive protection.
Output transfer shows a negative value at the amount of Rp.-124,335. It means that the output value receipted by the farmers in hectare is lower than the social value or divergence. This is caused by the farmers who prefer selling to a small trader with lower price, rather than to the market or soy-bean trader.
Input transfer is Rp.-57,979 which is higher payment of tradable input from social input prices. This is caused by farmer
pay-ment through credit system from kiosks and also implicit tax (leakages) of tradable input subsidy.
Factor transfer is of Rp.-91,969.- is meant input factor costs (working capital, rent of land, and wages) paid by the farmers lower than it should be. This is caused by implicit subsidy and transfer of resources in soybean production. Based on field observa-tion, as we all know in year 2000-2001 government provided cheap credit program the so-called Kredit Usaha Tani (KUT). Unfortunately, many of farmers mentioned that they had never received any credit from the government. So, the low factor costs are mostly caused by land rent paid by the farmer cheaper than the social price. This is caused by low motivation of the people to become a farmer. Many of them move to the city (urban area) to get more opportunity in economic activities.
The results of Policy Analysis Matrix (PAM) of cultivating soybean using technol-ogy can be seen in Table 6.
In this case, technology means an appli-cation of high yield seed quality and appro-priate fertilizer composition. The land with this characteristic is normally located in flat areas, while traditional technology is mostly applied in rough areas that can be planted only once a year.
that should be obtained by the farmers (based on social price) in amount Rp.1,925,282.
Value of social profit is higher than pri-vate one. This means a policy distortion and market failure. The form of market failure is factor market imperfection (inadequate development of institutions to provide com-petitive services and full information) and negative externality where there are many local labors work at overseas as TKI (Indo-nesian labor in overseas) and TKW (Woman labor in overseas). It causes the farmers to pay the higher wage rate than social wage rate.
Output transfer obtained from cropping system by using technology shows a negative value Rp.111,438. It means revenue obtained by the farmers in one ha lower than social revenue. It is caused by price received lower than market price. This is mostly caused by trading system (oligopsony).
Input transfer in amount Rp.-63,419 shows that farmers have to pay tradable input less than social input prices. This number is different with the value of transfer input that has a positive value. This is caused especially by government subsidy on input, namely high yield seed input WILIS 2000 (high vari-ety) and some extensions for increasing pro-duction.
Factor transfer in amount Rp.-61,229 shows input factor costs (involve cost of working capital, rent of land, wages) ex-pensed by the farmers higher than it should be (social price). Negative value of factor transfer shows imperfect market mechanism due to negative externality such as abundant of labors who work at overseas. This leads to increase local wage rate (due to labor scar-city). Another factor is the lack of rural financial intermediary. There is no financial institution that cannot provide a cheap credit for the farmers. Consequently, the farmers have to pay high interest rate. Negative net transfer Rp.109,248 means that cropping system by using technology is still disincen-tive as effect of policy distortion and market failure.
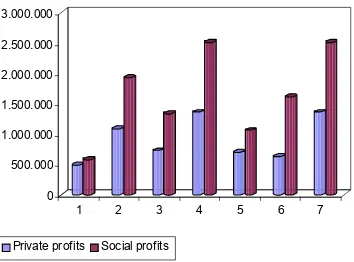
0 500.000 1.000.000 1.500.000 2.000.000 2.500.000 3.000.000
1 2 3 4 5 6 7
Private profits Social profits
Figure 3. The Private and Social Profit from the Seven Systems
Table 6. PAM CalculationCropping System by Using Technology Cost
Revenues
Tradable input Domestic factor
Profit
Private prices 5,351,807 1,433,113 2,102,660 1,816,034
Social prices 5,463,245 1,496,532 2,041,431 1,925,282
Effect of divergences and efficient policy - 111,438 -63,419 61,229 - 109,248
From the Figure 3, we can see that soybean with using technology (PAM 2, 3, 4, 5, 6, 7) have a better private and social profit than cropping system 1 (traditional one). The both cropping system 3 and 4 are using technology, but cropping system 4 has private and social profit higher than system 3. This is due to location of land. System 3 locates in irrigated land, while system 4 at non-irrigated ones. So, it can be concluded that soybean is more appropriate in non-irri-gated land (dry land).
Cropping system 5 and 6 are using tech-nology, system 5 located in irrigated land and system 6 in non-irrigated land. But, system 6 has private and social profit higher. This is due to a different cropping culture, system 5 applies monoculture, while system 6 multi-cropping. So, it can be said that multi-crop-ping is more profitable than monoculture system. System 4 and 7 has the same social and private profit. This is caused by the both have similar characteristics. They use tech-nology and implemented at non-irrigated land.
CONCLUSION
The explanation above has showed some findings that can be mentioned as follows:
1. In general, soybean market is still in effi-cient or imperfect mechanism. This is due to lack of information, weakness of institution, regulation and policy distor-tion. In other words, the government policy is still disincentive to the market. So, it needs government policy to pro-vide a perfect market mechanism such as making the information fluently and transparent, developing institution
sup-ported or needed by the local farmers, traders and consumers.
2. Based on PAM calculation, using technology (applied seed WILIS 2000) can provide a higher profit both private and social.
3. The farmer still sees possibilities to get a high profit for the soybean business based on PAM analysis, especially through multi cropping and imposing technology. It can be seen at PAM 4 (technology and non-irrigated land) and PAM 7 (technology, multi-cropping and non-irrigated land) the highest profit can be achieved. So, the more multi cropping and technology implementation, the more efficient the cropping system or higher profit can be achieved easily.
4. Based on the analysis, the seven PAM systems provide a high social profit. It means that government subsidy and pro-tection to soybean production is not so important. In other words, the domestic soybean production is still competitive against imported soybean.
5. Low private revenue is caused by lower price received.
6. A high cost of tradable input is also caused by trading system which farmers take tradable input before harvest time in kiosks and will pay after harvest time with higher price consequently.
7. In general, domestic factor paid by the farmers is lower than social price. It is caused by a cheaper land rent than social price.
1. The government should provide a policy that can promote all stakeholders in the soybean production system such as farm-ers, wholesalfarm-ers, and government. The government should play an “equity” role in enhancing and distributing welfare among stakeholders. We can see that government policy only concerns on in-put market but less on outin-put market. So, as input of further industries (tempe, tofu, soy sauce) a higher soybean price will in-fluence the industries negatively.
2. As answer for globalization, efficiency or higher profit (with the same land area) will be an important factor to realize it. Multi cropping system is a good way to achieve this objective, but the farmer should have a good combination among crops (soybean and corn).
3. Reducing illegal levies and making infor-mation fluently among stakeholders will absolutely influence positively soybean business. The coordination of each “dinas” in the government plays a key role in obtaining a positive condition in realizing competitive market.
4. Application of technology in form of imposing high seed quality (WILIS 2000) in soybean production provides a better yield. It means that government should disseminate using of this seed and its positive effect to soybean production.
5. Moreover, government should develop a financial institution that can fulfill farmer needs for competitive credit since many non formal credit institutions have ex-isted to provide credit with high interest rate. So, government should provide
more opportunities to the farmers ac-cessing credit.
REFERENCES
Central Bureau of Statistic, Blitar District. 2004. Blitar in Figure 2003/2004. Bli-tar: Statistic of Blitar District.
Central Bureau of Statistic. 2000. Indonesia in Figure 1999/2000. Jakarta: Statistic of Indonesia.
Central Bureau of Statistic. 2004. Indonesia in Figure 2003/2004. Jakarta: Statistic of Indonesia.
Central Bureau of Statistic.1990. Indonesia in Figure 1989/1990. Jakarta: Statistic of Indonesia.
Department of Agricultural. 2004. Agricul-tural data base. Jakarta: Pusdatin.
Hermana. 1998. Commodity Price Instability in Developing Countries.
Monke. E.A and Pearson S.R, 1994. The Policy Analysis Matrix for Agricultural Development. Cornell University Press.
National Planning Development Board. 2001. An Approach to Macro Food Policy. Working Paper No. 6, March 2002. Jakarta
Pearson, S. 2003. Applications of the Policy Analysis Matrix in Indonesian Agricul-tural. Working paper
Timmer, Falcon, and Pearson, 1983. Food Policy Analysis (hereafter FPA), New York.
ATTACHMENTS
Table 7. Cropping System by Using Technology at Irrigated Land (PAM 3) Cost
Revenues
Tradable input Domestic factor
Profit
Private prices 3,524,255 1,102,447 1,785,543 726,265
Social prices 4,050,747 760,719 1,955,141 1,334,887
Effect of divergences and efficient policy -526,492 251,728 -169,598 -608,622
Table 8. Cropping System by Using Technology at Non-Irrigated Land (PAM 4) Cost
Revenues
Tradable input Domestic factor Profit
Private prices 6,381,802 1,930,778 2,419,778 2,031,246
Social prices 6,875,742 2,232,344 2,127,721 2,515,677
Effect of divergences and efficient policy -493,940 -301,566 292,057 -484,431
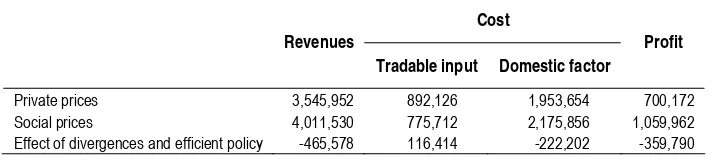
Table 9. Cropping System by Using Technology at Irrigated Land on Monoculture System (PAM 5) Cost
Revenues
Tradable input Domestic factor
Profit
Private prices 3,545,952 892,126 1,953,654 700,172
Social prices 4,011,530 775,712 2,175,856 1,059,962
Effect of divergences and efficient policy -465,578 116,414 -222,202 -359,790
Table 10. Cropping System by Using Technology at Irrigated Land on Multi-Cropping System (PAM 6)
Cost Revenues
Tradable input Domestic factor
Profit
Private prices 3,278,054 1,034,064 1,617,432 626,558
Social prices 4,089,963 745,725 1,734,426 1,609,812
Table 11. Cropping System by Using Technology at Non-Irrigated Land on Multi-Cropping System (PAM 7)
Cost Revenues
Tradable input Domestic factor
Profit
Private prices 6,381,802 1,930,778 2,419,778 2,031,246
Social prices 6,875,742 2,232,344 2,127,721 2,515,677
Effect of divergences and efficient policy -493,940 -301,566 292,057 -484,431
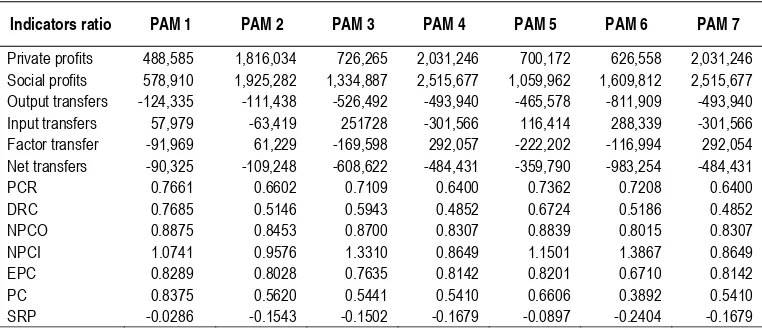
Table 12. Recapitalization of Ratio Indicators of Policy Analysis Matrix (PAM)
Indicators ratio PAM 1 PAM 2 PAM 3 PAM 4 PAM 5 PAM 6 PAM 7
Private profits 488,585 1,816,034 726,265 2,031,246 700,172 626,558 2,031,246
Social profits 578,910 1,925,282 1,334,887 2,515,677 1,059,962 1,609,812 2,515,677
Output transfers -124,335 -111,438 -526,492 -493,940 -465,578 -811,909 -493,940
Input transfers 57,979 -63,419 251728 -301,566 116,414 288,339 -301,566
Factor transfer -91,969 61,229 -169,598 292,057 -222,202 -116,994 292,054
Net transfers -90,325 -109,248 -608,622 -484,431 -359,790 -983,254 -484,431
PCR 0.7661 0.6602 0.7109 0.6400 0.7362 0.7208 0.6400
DRC 0.7685 0.5146 0.5943 0.4852 0.6724 0.5186 0.4852
NPCO 0.8875 0.8453 0.8700 0.8307 0.8839 0.8015 0.8307
NPCI 1.0741 0.9576 1.3310 0.8649 1.1501 1.3867 0.8649
EPC 0.8289 0.8028 0.7635 0.8142 0.8201 0.6710 0.8142
PC 0.8375 0.5620 0.5441 0.5410 0.6606 0.3892 0.5410