URBAN EXPANSION: A GEO-SPATIAL APPROACH FOR TEMPORAL MONITORING
OF LOSS OF AGRICULTURAL LAND
N. S. Sumari a*, b, Z. Shao b, M. Huang c, C. A. Sanga d, J. L. Van Genderen d,e.
a*
Department of Informatics, Solomon Mahlangu College of Science and Education, Sokoine University of Agriculture P.O. Box 3038, Morogoro, Tanzania; E-Mail: [email protected]
b
State Key Laboratory for Information Engineering in Surveying, Mapping and Remote Sensing, Wuhan University, Wuhan 430079, China; E-Mail: [email protected]
c State Key Laboratory for Information Engineering in Surveying, Mapping and Remote Sensing, Wuhan University, Wuhan 430079,
China; E-Mail: [email protected],
d
Department of Informatics, Solomon Mahlangu College of Science and Education, Sokoine University of Agriculture P.O. Box 3038, Morogoro, Tanzania, E-Mail: [email protected]
e
Department of Earth Observation Science, Faculty ITC, University Twente, Netherland. E-mail: [email protected]
Commission VI, WG VI/4
KEY WORDS: urbanization, land use, agricultural, image fusion, remote sensing, geospatial;
ABSTRACT:
This paper presents some preliminary results from research on monitoring the urban growth of Shenzhen in China. Agriculture is still the pillar of national economies in many countries including China. Thus, agriculture contributes to population growth. Population growth follows either exponential or logistic growth models. These models can be examined using a time-series of geospatial data, mainly historical earth observation imagery from satellites such as LANDSAT. Such multitemporal data may provide insights into settlement analysis as well as on population dynamics and hence, quantify the loss of agricultural land. In this study, LANDSAT data of ten dates, at approximately five yearly intervals from 1977 to 2017 were used. The remote sensing techniques used for analysis of data for 40 years were image selection, then followed by geometric and radiometric corrections and mosaicking. Also, classification, remote sensing image fusion, and change detection methods were used. This research extracted the information on the amount, direction, and speed of urbanization, and hence, the number of hectares of agricultural land lost due to urban expansion. Several specific elements were used in the descriptive model of landscape changes and population dynamics of the city of Shenzhen in China. These elements are: i) quantify the urban changes, from a small town (37.000 people in the early 1970’s) to the megalopolis of around 20 million habitants today. ii) Examining the rate of urban extension on the loss of agricultural landscape and population growth. iii) The loss of food production was analysed against the economic growth in the region. iv) The aspects of loss of agricultural land, area of built-up urban land, and increase in population are studied quantitatively, by the temporal analysis of earth observation geospatial data. The experimental results from this study show that the proposed method is effective in determining loss of agricultural land in any city due to urbanization. It can be used by town planner and other stakeholders such as land surveyors and agriculture experts to mitigate the mushrooming of unplanned settlements in many town / villages and loss of land for agriculture which might cause problems in food security.
* Corresponding author
1.
INTRODUCTION
1.1
Background Information
The loss of agricultural landscape by the concomitance of urban extension and population growth has found an important place in the research (Aguilar et al, 2003b) and (Dahal, Benner & Lindquist, 2017). China is amongst the perfect example where the demographic pressure and the fast development threshold the configuration of land use especially agricultural area. There is an urgent need to effectively detect and monitor the land-use/cover changes and provide accurate and timely information for land planning and management (Petrov and Sugumaran, 2008a); and (Liu and Yang, 2015b). Remote sensing has proved to be a powerful tool for monitoring rapid land use changes (Hadeel, 2009b).
In the last three decades, the technologies and methods of remote sensing have dramatically progressed to include operating a suite of sensors at a wide range of platforms with potential interests and impacts on land planning and land management compared with the traditional manner (Xu, Wang, and Xiao, 1999b). The city Shenzhen has witnessed a deep development in many aspects during this last decade which is such meaningful for the occurrence of important changes at the spatial and temporal scale (Liu and Yang, 2015). This study used Very High-Resolution Image (VHRI) analysis and supervised classification to detect land use changes in the city of Shenzhen in order to provide current, timing and reliable information to the managerial authorities and decision-makers (Zhang, 2010a); (Shen, 2008a); and (Zhao, 2016a).
farms have decreased due to migration to urban areas (Xu et al, 1999b). Between 1987 and 1992, China lost close to one million hectares of farmland each year due to urbanization and the expansion of roads and industries (Shen, 2008a). Urban area in China increased from 7438 km2 in 1981 to 32,520.7 km2 in 2005 where by the population increased from 602 million in 1953 (First population Census) to 1,370 (six population Census) with 1.28 increases (Li et al, 2015a) and (Shen, 2008a). In Shenzhen City, population is growing very rapidly, during the last four decades the built-up area of the city expanded, especially at the fringe, because of the continuous growth of informal peri-urban settlements (Zhu and Woodcock, 2014a). This research assesses the impact of urban expansion on the loss of agricultural land using geospatial approach. Knowledge on this will help formulation of good land policies (Dahal, Benner & Lindquist, 2017).
China faces the dilemma of needing to increase agricultural productivity while highly productive agricultural lands are being converted to urban uses (Araya and Cabral, 2010a); (Li et al., 2016a); and (Liu and Yang, 2015). The sustainable management of agricultural lands is a prime concern amongst the science and policy communities (Zhu, 2014) and (Liu, 2015), and a first step towards finding a solution is to develop a scientific understanding of agricultural land loss due to urban expansion. Two common approaches to examine the area of agricultural land lost to urban growth are to use data from national yearbooks and estimates from remote sensing (Hui and Yonghong 2012a) and (Seto et al., 2000).
Remote sensing is a useful tool to monitor land use/cover change at large spatial and temporal (Shao et al, 2017a). Also, it has been a great source of information for land change detection. Using remote sensing a researcher can detect, identify, and analyse the changes in land scape conditions, because of its broad view, high temporal frequency, and consistent observations (Haigang, Li, Gong and Qing, 2002a). Change detection with multi-temporal remote sensing images has proven effective in many applications (Shao et al, 2017a) In this research, an attempt was done to map an urban area every five year from 1977 to 2017 using Landsat data over Shenzhen City, China. The study of Shenzhen City shows out or detects the loss of Agricultural landscape due to urban extension and population growth through a period of 40 years.
Thus, the general objective of this study was to monitor the growth of Shenzhen City and the loss of agriculture land, to examine the rate of land-cover changes over long time periods and where the changes occurred. This objective was achieved by using time-series geospatial data, multi-temporal data and remote sensing techniques. It was used to monitor satellite-based earth observation which offers the ability to provide the general summary and measurements over very large geographic areas, and over long periods of time. Remote sensing techniques were used also to monitor conversion of land-cover types. Landsat TM satellite image data were used for land-cover classification and analysis of urbanization and land-cover and environmental changes. Satellite Landsat data of different time periods were used. In summary, the specific research objectives of this study were to:
a. Study changes in the rate of change over 40-year period for the city of the Shenzhen
b. Provides a new approach to address the complex issues of a loss of agricultural land due to urban expansion.
These objectives led to the formulation of the following research questions.
i) How can urban growth be quantified by integrating different Remote sensing datasets?
ii) How should loss of Agricultural land be linked with urban growth over long time periods?
iii) What is the accumulated impact of a loss of Agricultural land, and how can it be assessed?
2.
MATERIALS AND METHODS
2.1
Study Area
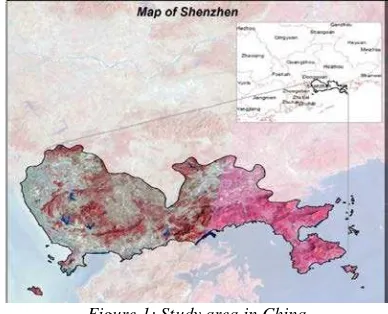
The study area for this study is Shenzhen City in south China
between 113˚46’E to 114˚37’E, 22˚27’N to 22˚52’N, which
covers some 1952.84km2 (Figure1). There are two major towns in the areas to the north and one south of the River. These are Dongguan city and Huizhou city in the north, and Hongkong to the south.
Figure 1: Study area in China
Shenzhen is one of the largest cities in China, and has growth history in economical and urbanization over the past two decades. In 1979 the population was 0.314 million and the built-up area of only about 3 km2. But now Shenzhen has become one of the most important cities in China with a population of 8.46 million (Ping, 2007). It has impervious area over 700km2 and the value of gross domestic production of 6765.41 billion yuan (Ping and Ailing, 2008). From 2001 to 2005, Shenzhen had experienced urbanization at an unprecedented rate, and at the same time the excessive spatial expansion had brought so many problems, such as environment deterioration, farmland depletion and auto-related air pollution (Zhao et al, 2016a).
2.2
Data Collection
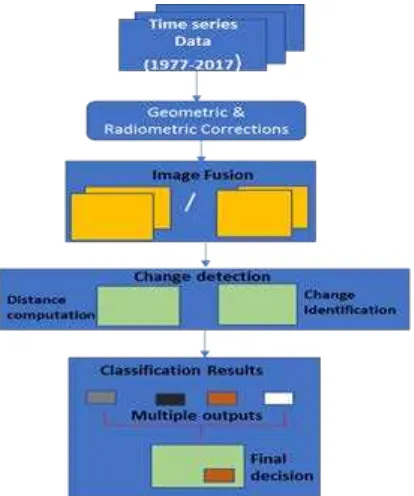
Base on Figure. 2, the workflow of this study is divided into three parts. Firstly, is processing Landsat image including pre-processing, secondly, image fusion technique while the third stage is change detection results land cover map as the final output of the classification.
Figure 2: Workflow of the proposed supervised change detection algorithm.
2.3
Data pre-processing
Pre-processing involves few processes, Geo-reference, geometric correction and subset image. Ten images acquired on 07 November 1977, 4 November 1986, November 1991, November 1996 December 2000, November 2006 and November 2016 were selected from data collected for this study. Accordingly, the period of data covered about forty years. ArcGIS software was used to derive land use/cover classification in a multi-temporal approach.
All image was processed and atmospheric corrections were conducted by researchers with the Fast Line-of-Sight Atmospheric Analysis of Spectral Hypercubes algorithm tool in ENVI version 5.1 and geometric correction in which ground control points were chosen referencing to a topographic map of 1:250000 for all images (Shao, 2017a). Phol and Genderen (2017) stated that, the purpose of geometric correction is to compensate for the distortions introduced by certain factors so that the corrected image will have the geometric integrity of map where by all images were geometrically corrected to UTM-WGS84.
2.4
Image Fusion
We used image fusion technique to combine two or more different images to form a single image which is more easily interpreted than of the originals (Genderen and Pohl, 1994a) and (Jin et al, 2006). The main purpose of this is to improve the spatial resolution and the classification accuracy when visualizing the interpretation of data of the final decision (Gamba, 2014a). This approach combines multiple images by stacking them with the panchromatic image to use the image for segmentation stage (Phol and Genderen, 2017) and (Gungor and Akar, 2010)
2.5
Change Detection
Change detection techniques have played a big role in monitoring change of Earth’s surface. As noted by Lei et al. (2016b), there are factors leading to changes are results from two major aspects, namely: natural forces and human actions. Natural forces generate both abrupt and usually radical changes and slow changes and human action also generate abrupt and radical changes which are mostly caused using explosives. Monitoring land expansion and change is very important to evaluate the change such as urban expansion, climate change, flooding and transition in vegetation.
The supervised classifications where been used using the training sample area in the statistical procedures (Kotsiantis,2007). Four classifications were selected from the study area which was presented in each image. The classes were buildings (urban/built-up area), vegetation, water body and bare soil (Table 1). These classes were extracted from the images and for which area statistics were generated.
Land use/cover Description
Buildings Res i denti l a , roa ds , urba n, i ndus tri a l ,
Vegetation Fores t, pa l ms a nd others
Water Ri ver, open wa ter, l a kes , ponds
Bare soil La ndfi l l , expos ed s oi l
Table 1: Land use/cover classification
In calculating the loss of agricultural land, Normalized Difference Vegetation Index (NDVI) was used from Envi software. The vegetation index image produced the buildings with very dark colour and vegetation area with very light colour because the band combination of high vegetation reflectance in band 4 of near infrared and low vegetation in band 3 of red light.
To determine the change of urban expansion of different years range to identify, describe and quantify differences between images at different time
2.6
Data Analysis
Envi 5.1 software (such as Band Math) and ArcGis were used to quantify the area of the four classes of the two-different year 1977 to 2016 classification map. This software also was used to quantify the amount and type of change that occurred in each of the classes over forty years (Zhe et al, 2016). To determine the change detection analysis, methods used to identify, describe, and quantify differences between images of the same scene at different times or under different conditions. The difference was calculated by subtracting the initial image from the final image (final – initial), and the classes are defined by the change thresholds. Also, change detection statistics were used to determine the changes between each year classification images and statistics report which include a class-for-class image difference in percentages and area
3.
RESULTS AND DISCUSSIONS
3.1
Results
Using the methods described above, regional characterization of land use and land-cover changes were estimated for the study area over the five-year period. The area of land-cover types in each of seven study images has been obtained using usgs.gov website (https://earthexplorer.usgs.gov). All the studied land-cover types are of two broad groups, those that experienced considerable change and those that experienced lager change. The considerably changed land-cover types were the focus of this study and are discussed below.
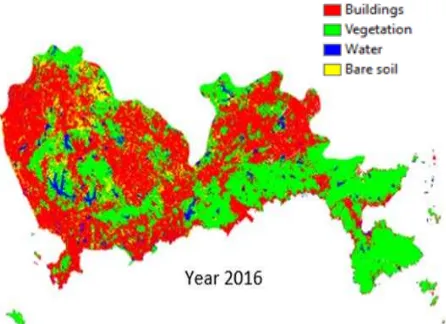
Figure 3: Maps showing pattern of land changes due to urbanization of Shenzhen city
From the study, the results of four features from the image have been classified and image classification show the period of year 1977-1986, the city of Shenzhen experienced its first rapid growth period as a result of the deep development of China’s reform and opening up (Shen, 2008a). And for the period 2006– 2016, this city was still experiencing a tremendous change, and was faster than that in the previous period (Li, Gong, and Liang, 2015). The high-resolution images gave more detail information of the classified map of urban growth in the Shenzhen city using time series Landsat imagery from 1977 to 2017 based on the time series method.
3.2
Discussions
This paper describes how the technologies of satellite remote sensing, remote sensing image fusion and change detection techniques are combined to address the loss of land for food production in the city of Shenzhen, China, during the period 1977–2017. It was found that urban or built-up land has tremendously increased in area, while agricultural land has decreased.
In this study, the use of Landsat TM data to detect land use and land cover changes has been generally a success (Figure 4). The digital image classification coupled with fused image has demonstrated its ability to provide comprehensive information on the direction, nature, rate, and location of land use and land cover changes because of rapid industrialization and urbanization (Table 1). However, the issue of class uncertainties in image classification has not been examined in this paper. This is the area for future study.
Figure 4: Overlay results of the city map show the urban expansion directions.
Accuracy assessment is an important part of classification and change detection processes (Mahmon et al., 2015b). A common method for accuracy assessment applies an error matrix, which can be used as a starting point for a series of descriptive and analytical statistical analyses. Some analysts perform error evaluation based only on the training pixels used to train or seed the classification algorithm. Unfortunately, the location of these training sites is usually not random. They are biased by the analyst’s prior knowledge of where certain land-use/land-cover types exist in the scene (Li, 2012). For these reasons, stratified random sampling is usually recommended so that the sampling points are fairly spread in each land use change category.
1977 1986 1991 1996 2000 2006 2016
Buildings 0.3034 8.61006 11.44241 29.47517 42.98649 982468 49.24262
Vegetation 55.92154 67.00153 58.2848 56.24692 45.86244 913551 41.03021
Water 20.20974 5.64754 6.25728 5.63663 3.165331 55248 3.69651
Bare Soil 23.56525 18.74088 24.01551 8.64128 7.985732 116723 6.03067 Table 2: The percentage of area and expansion of Land cover classification in different year of Shenzhen city.
From statistics Landsat data, Table 2 shows from the year 1977 to year 2017 of 40 years period the expansion of urban land increases from 0.3% to 49.24% entire land cover change area leading to decreases of the agricultural land from 55.92% to 41.03% which is equivalent to loss of farming land of 14.89%. The rate of increase in the population of Shenzhen city form year 2006 to 2016 were too high (Lei, 2016a) with the rate of 1.73% of urban area and decreased in non-agricultural land agricultural land for 3.5% for the period of ten years. Therefore, this increase in the non-agricultural population show that the urbanization growth in the city was very fast and consequently lead to loss of agricultural land (Figure 5).
Figure 5: The increase in urban/building (built-up) area leading to the decrease in agricultural land.
and patchy, and consequently, where urban maps are most challenging to produce, yet most needed. The results reveal several insights for monitoring urban change that are relevant to future studies. This study makes three remarks in the current literature on agricultural land loss in Shenzhen. First, our results show that agricultural land loss is occurring around smaller districts more than bigger cities. Agricultural land loss is largely in districts which have a larger number of operational services. Whilst, the rate of agricultural land loss has declined in some states, in a majority of districts agricultural land loss due to urban expansion is increasing. Second, our study shows that while the total area of agricultural land converted to urban areas is relatively low, the total area lost has been increasing steadily since 2006. Third, our results show that urban conversion of agricultural land is concentrated in a few districts. The district level analysis also shows that the amount of agricultural land loss to urban growth is higher than 5000 ha (50 km2) in only 6% of the districts Shenzhen. In 40% of the districts, it was found that agriculture land loss to urban growth was very low and currently the total amount of land loss to urban growth was less than 100 ha (1 km2). However, as the population urbanizes,
the expectation is that they will be an increase in the demand for urban land. In this context, it is argued that effective land use management strategies are critical to preserve prime agricultural land. Although agricultural land loss to urban expansion has been relatively low in the past but nowadays with the fast development of Shenzhen city and what the data set show that there will be an exponential increase of urban coverage on detriment of loss of agricultural area (Figure 4). Figure 4 shows that as the year increasing, the loss of agricultural land is increasing.
4.
CONCLUSION AND
RECOMMENDATION
Urban expansion remains one of the trickiest and most difficult of land cover types to capture. With remote sensing data, both urban land and change areas can be unidentified making them difficult to isolate using automated approaches. This case is clear from the literature review; there are many different approaches to estimate on the amount of agricultural land lost to the urban expansion of Shenzhen city. This is due to the fact that, these researchers have used different data sets they have not used a systematic methodology, or have not used ancillary data sources to check the accuracy of their estimates. Hence in this study, we are using the same, consistent LANDSAT data, at regular five-year time differences, at the same season of each year, to make an objective analysis on the amount and rate of loss of agricultural land in this region.
The results show that, with the rapid economic development and urbanization, land use in the city of Shenzhen was rapidly changing 14.89% of the total area from 1977 to 2017. The land use area and constructions site increased while the agriculture land decreased. The growth of urban land leads to the major loss of the farming/cropland due to agricultural restructuring and market economic development (Shen, 2008a). Therefore, from the findings of this research, it is recommended that suitable guidelines and monitoring of development activities needs to be examined so that the agricultural land could be protected for farming and food security.
Acknowledgments
This work was supported by the National Key Technologies Research and Development Program (2016YFB0502603, Fundamental Research Funds for the Central Universities (2042016kf0179 and 2042016kf1019), Guangzhou science and technology project (201604020070), Wuhan Chen Guang Project (2016070204010114), Special task of technical innovation in Hubei Province (2016AAA018) and Natural Science Foundation of China (51508422).
5.
REFERENCES
Aguilar, A. G., Ward, P. M., & Smith Sr, C. B. (2003). Globalization, regional development, and mega-city expansion in Latin America: Analyzing Mexico City’s peri-urban hinterland. Cities, 20(1), 3-21.
Araya H. Y., and Cabral, 2010. Analysis and Modeling of Urban Land Cover Change in Setiubal and Sesimbra, Portugal. Remote Sensing, (2):1549-1563
Carper, W., Lillesand M., and R. Kiefer. (1990). The use of intensity-hue-saturation transformations for merging SPOT pan and multi-spectral image data. Photogrammetric Engineering & Remote Sensing, vol.56, no.4, pp. 459-467.
Dahal, K. R., Benner, S., & Lindquist, E. (2017). Analyzing spatiotemporal patterns of urbanization in Treasure Valley, Idaho, USA. Applied Spatial Analysis and Policy, 1-22.
Gamba, P. 2014. Image and data fusion in remote sensing of urban areas: Status issues and research trends. International Journal of Image and Data Fusion. 5(1):2-12.
Genderen, J. L. van and C. Pohl. 1994. Image fusion: Issues, techniques and applications. Intelligent Image Fusion, Proceedings EARSeL Workshop, Strasbourg, France 11:18-26.
Gungor, O. and O. Akar. 2010. Multi sensor data fusion for change detection. Scientific Research and Essays. 5(18): 2823-2831.
Grasso, D., 1993. Applications of the IHS color transformation for 1: 24,000-scale geologic mapping: A low cost SPOT alternative. Photogrammetric Engineering & Remote Sensing, Vol. 59, No. 1, Pp. 73-80.
Hadeel, A., Jabbar, M. (2009). Application of remote sensing and GIS to the study of land use/cover change and urbanization expansion in Basrah province, southern Iraq. Geo-spatial Information Science, 12:2, 135-141.
Haigang, S., Li, D., Gong, J., and Qing, Z. (2002). Geo-spatial Information Science. Volume 5, Issue 2: pp 13-16
Hui, Y., and Yonghong, J. (2012). A new approach for vegetation change detection in urban areas. Geo-spatial Information Science, Volume 9 2006- Issue 4: pp 298-305
Kotsiantis, S. B. (2007). Supervised Machine Learning: A Review of Classification Techniques. Informatica, 31, 249-268.
Lei Zhang and Qihao Weng.2016.Annual dynamics of impervious surface in the Pearl River Delta, China from 1988 to 2013,using time series Landsat imagery[J].ISPRS Journal of Photogrammetry and Remote Sensing,113,86-96.
Li, D. R., Z. F. Shao, and X. M. Yang. 2012. “Theory and Practice from Digital City to Smart City.” Geospatial Information, 9(6):1-5.
Li, X., P. Gong, and L. Liang. 2015. A 30-year (1984-2013) record of annual urban dynamics of Beijing City derived from Landsat data. Remote Sensing of Environment, 166: 78-90.
Liu, T. and Yang X. 2015. Monitoring land changes in an urban area using satellite imagery, GIS and landscape metrics. Applied Geography 56:42-54
Mahmon N. A., Ya’acon N., and Yusof L. A. 2015. Differences of Image Classification Techniques for Land Use and Land Cover Classification. IEEE 11th International Colloquimu on Signal Processing & its Application, 6-8
Petrov, N. A., & Sugumaran, R. 2005. Monitoring and Modeling Cropland Loss in Rapidly Growing Urban and Depopulating Rural Countries Using Remotely Sensed Data and GIS. Geocarto International. 20(4):45-52
Ping, D. 2007. Shenzhen Statistical Yearbook. Statistical Bureau of Shenzhen. Statistics press 978-7-5037-5214-8/F.2514
Ping, D., and Ailing, K. 2008.Shenzhen Municipal Bureau of Statistics. SHENZHEN STATISTICAL YEARBOOK. ISBN:978-7-5037-5464-7/F.2705
Pohl, C. and J. L. van Genderen. 2017. Remote Sensing Image Fusion: A Practical Guide: 266, CRC PRESS, ISBN 9781498730020
Pohl, C. and J. L. van Genderen. 1998. Review article multisensor image fusion in remote sensing: Concepts, methods and applications. International Journal of Remote Sensing, 19(5): 823-854.
Schowengerdt, R. 2007. A. Remote Sensing: Models and Methods for Image Processing, (3rd. edition), Academic Press, ISBN 0-12-369407-8, San Diego, USA, 2007.
Shao, Z., Deng, J., Wang, L., Fan, Y., Sumari, N., and Cheng, Q. (2017). Remote Sensing Fuzzy AutoEncode Based Cloud Detection for Remote Sensing Imagery. Remote Sensing, 9(4)
Shen, J. 2008. Urban Growth and Sustainable Development in Shenzhen City 1980-2006. The open environmental Journal, 2:71-79
Tai, G. M. and S. I. Nipanikar. 2015. Implementation of image fusion techniques for remote sensing application. International Journal of Emerging Technology and Advanced Engineering, 5 (6):109-113.
Wu C., Zhang L., and Zhang L., 2016. A Scene change detection framework for multi-temporal very high resolution remote sensing images. Signal Processing, 124: 184-197 Xu, H, X. Wang, and G. Xiao. 1999. A remote Sensing and GIS Integrated study on urbanization with its impact on arable lands. Land Degradation and Development: Fuqing City, Fujian Province, China 11:301-314
Zhang, J. 2010. Multi-source remote sensing data fusion: Status and trends. International Journal of Image and Data Fusion, 1(1): 5-24.
Zhao, M., Xu, G., & Li, Y. (2016). Evaluating urban public facilities of Shenzhen by application of open source data. Geo-spatial Information Science, Vol. 19, no. 2, 129-139
Zhe Z., Fu, Y., Woodcock, E. C, Olofsson, P., Vogelmann, E. J., Holden, C., Wang, M., Dai, S., and Yu, Y. (2016). Including land cover change in analysis of greenness trends using all available Landsat 5, 7, and 8 images: A case study from Guangzhou, China (2000 – 2014). Remote Sensing of Environment, RSE-09817: pages 15