ANALYSIS PROFITABILITY OF COMPANY BEFORE AND AFTER MERGER
(A case study on the company's merger in 2009 to 2014 are listed in Indonesia Stock Exchange)
Eddy Winarso
Widyatama University – West Java - Indonesia
[email protected] Joung hyun Park
Philippine Christian University – Manila – Philippine
ABSTRACT
Merger is combination of two or more companies to establish a new company. Merger happens when a company takes over all the operations of other business entities and the entities which taken over is dissolved. This research aims to analyze profitability of company before and after merger in companies listed in Indonesia Stock Exchange. Profitability is measured by using ratios: Net Profit Margin (NPM), Return on Equity (ROE), Return on Investment (ROI). This research takes population from all of the company that done merger in period of 2009-2014. The samples of this research consists of 3 firms from non-banking category are listed in Indonesia Stock Exchange. The ratios of data obtained from company’s financial statements are published. The analysis used to test the hypothesis of this research is descriptive and comparative analysis with a statistical test Paired Sample T Test. The results from Paired Sample T Test shows that there was difference for Net Profit Margin, Return on Equity and Return On Investment ratios before and after merger in period of observation and testing.
BACKGROUND RESEARCH
The trend of mergers and acquisitions (M & A) globally
experienced tremendous growth. Throughout 2014, seven out of ten major
M & A transactions have occurred during the last six months. "The
regulations about foreign stake in national banks are only allowed 40%, as
well as the shipwreck of the acquisition of DBS Bank Danamon, making M
& A transactions in the banking sector in 2014 greatly decreased," said Bruce
Delteil, M & A Asia Pacific Lead for Accenture. Bruce explained, in ASEAN,
the trend of mergers and acquisitions is still running positive. In 2014, the
number of mergers and acquisitions in the region increased by about 12%
or US $ 68.4 billion, with the number of transactions reached 1,751 cases.
Most mergers and acquisitions occurred in the six business sectors,
namely: finances, energy and electric power, property, technology and raw
materials. In the period of the ASEAN Economic Community (MEA) scrolls,
Indonesia must be ready for that in the year 2020 foreigners may own 70%
of assets of domestic enterprises in any industry
Therefore, Bruce said, Indonesia needs to have a more flexible
investment policy. He believes that M & A is able to bring benefits to the
economic climate of a country. "Level M & A Low implies questions about
the dynamics of the industry in the country. Without M & A, no
improvements can be done industry. Instead, through M & A, Indonesia
will have a large enterprise scale is able to compete with companies
regionally and globally," said Bruce. (Www.marketeers.com)
In general, the goal to do mergers and acquisitions is gaining
synergies or value-added long-term added value is not just a temporary
solution
According Beams, Brozovsky, and Shoulders (2009:1) Companies
constantly strive to create added value for its shareholders economy. In
as a destination business entity that makes sense. Companies may choose
to expand the business both internally (to build its own facilities) and
externally (to take control of another company in the merger).
If the expansion is the main targets of the company, some of the
reasons why the business expanded through the merger: (1) cost advantage,
(2) a lower risk. Buying a product line and existing markets typically reduce
risk rather than developing new products and markets. (3) Minimize delay
in operations. In building a new company facility possible delays in
construction due to the necessary government approval to start operations.
(4) Avoid takeover. (5) Acquisition of intangible assets.
The merger involves combining of resources, both tangible and
intangible. Thus, the acquisition of patents, mineral mining, research
customer database, or management expertise may be a major factor that
motivates a business combination. According Beams, Brozovsky, and
Shoulders (2009: 5) Merger requires the dissolution of all the entities
involved except the one entity. While consolidation requires the dissolution
of all business entities involved and form a new company.
In 2014, XL has focused its efforts on consolidation and
post-merger integration with Axis. During the first quarter of 2015, XL's revenue
of Rp. 5.5 trillion, with a growth rate that is relatively flat compared with
the period last year, following the selling and leasing back 3,500 towers by
the end of 2014. Revenue from mobile services grew 3% from last year,
while Data services continued to grow by 29% compared to last year.
Data service revenues accounted for 32% of total consumption in
revenues compared to the previous year by 26%. Earnings Before Interest,
Taxes, Depreciation and Amortization (EBITDA) decreased 15% from the
same period last year to Rp. 1.9 Trillion with EBITDA margin of 34%. The
decline in EBITDA is a reflection of their integration with Axis, which the
acquisition was completed on March 19, 2014 ago. In the first quarter of last
(Http://www.xl.co.id/corporate/id/investor/informasi/lakukan-konsolidasi-XL-fokus-untuk-percepat-transformasi)
According Harahap (2009: 304) describes the profitability is the
company's ability to profit through all of the capabilities and existing
resources such as sales activities, cash, capital, number of employees,
number of branches of the company, and so forth.
According to Kashmir (2011: 114) Profitability ratios are ratios to
assess the ability of companies in search of gain or profit in a given period.
ratio used is ROE, ROI, NPM, OPM, GPM. The use of financial ratios as an
assessment of the profitability of companies in relation to mergers and
acquisitions have been made by several researchers, including Dhani
Ichsanuddin Nur (2010), which examines the impact of the decision on the
merger of banking in Indonesia Stock Exchange. The results showed that
there were no significant differences in the level of liquidity, activity level,
and the level of profitability between before and after the merger. Holy
Mutiara Ayu (2014) who studied Comparative Analysis of Company
Profitability before and after Acquisition. The results showed that there
were significant differences in the Operating Profit Margin of the company
before and after the merger, whereas no significant difference in the Net
Profit Margin, Gross Profit Margin, Return on Investment and Return On
Equity company before and after the merger.
In this study, only limited to the difference in the profitability of
the company before and after the merger was observed with the following
ratings:
a. How big is the difference in the company's profitability as measured
by the ratio of Net Profit Margin (NPM) before and after the merger?
b. How big is the difference in the company's profitability as measured
c. How big is the difference in the company's profitability as measured
by the ratio of Return On Investment (ROI) before and after the
merger?
This research was conducted on a publicly traded company merger
and includes the date of the merger on the financial statements, published
through the official website which www.idx.co.id and locations used for
data collection Investments Gallery Widyatama University Jl. Cikutra
No.204A Bandung.
Theoretical Framework
Definition of Merger
Definition of Merger Beams, Brozovsky, and Shoulders (2009:2)
states that: "The merger is the union entities - business entities that were
previously separate." Although the main purpose of the merger is the
profitability, the merger is also aimed at gaining efficiency through the
integration of operating horizontally (merger companies in the business
line or the same market) or vertical (the merger of two or more companies
with different operating) or conglomerate (merging companies with
products and / or services that are not interconnected and diverse.
IAS 22 Business Combinations (business combination) are: "The merger is
the union of two or more separate companies into one economic entity as
the company merges with another company or gain control over the assets
and operations of another company."
In Government Regulation No. 57 in 2010 form the merger are:
a. Amalgamation (merger) is a legal act performed by a single entity or
to combine with other business entities that have no resulting assets
and liabilities of the business entity that combines the self-switch for
subsequent status of business entities who joined expires by
operation of law.
b. Smelter (consolidation) is a legal act performed by two or more
business entities to merge by way of setting up a new business entity
for obtaining legal assets and liabilities of the merged entity and the
status of business entities merged expire by operation of law.
c. Takeover (acquisition) is a legal act performed by businesses to take
stock enterprise which resulted in the shift of control over the
enterprise.
Legal Aspects of Mergers and Consolidation
In Act No. 40 of 2007 on Limited Liability section 122 -137 regulate
merger, consolidation, acquisition and separation. Article 122 explains:
1. Merger and Consolidation resulted in the Company which combine
or merge an end because of the law.
2. The end of the liquidation of the Company occur without any prior
3. In the event of termination of the Company
a. Assets and liabilities of the Company which combine or
merge the switch because hukumm to the Company that the
Company receives the Merger or Consolidation results.
b. Shareholders whose combine or merge because of the law into
the Company's shareholders who accept the Merger or
Consolidation of the Company's results, and
c. A company which combines or merges expires by operation
of law as of the date the Merger or Consolidation into effect.
The design of the merger set out in Article 123:
1. The Board of Directors of the company will merge and the
surviving draft the merger
2. The design of incorporation must contain at least
b. reasons and explanations Board of Directors who will perform the
requirements of the Merger and the Merger;
c. procedures for assessment and conversion of shares of the Company
were merged to the Company's shares that accept the Merger;
d. draft amendment of the articles of association of the Company who
received the Merger, if any;
e. the financial statements referred to in Article 66 paragraph (2) letter
a covering 3 (three) last fiscal year from each company that will do
the Merger;
f. plan continuation or termination of the business activities of the
Company who will perform the Merger;
g. proforma balance sheet of the Company who received the Merger in
accordance with generally accepted accounting principles in
Indonesia;
h. h. settlement status, rights and obligations of members of the Board
of Directors, Board of Commissioners, and employees of the
Company who will perform the Merger themselves;
i. settlement rights and obligations of the Company to be merged to
the third party;
j. settlement rights of shareholders who do not agree to the Merger of
the Company;
k. name of Directors and the Board of Commissioners and the salaries,
emoluments and allowances for members of the Board of Directors
and Board of Commissioners which receives the Merger;
l. the estimated period of implementation of the Merger;
m. reports on the state, development, and results of each of the
Company who will perform the Merger;
n. The main activities of any company that does the Merger and the
o. Details of the problems that arise during the financial year under
way that affect the Company's activities which will perform the
Merger.
3. After the Merger Plan approved by the Board of Commissioners of
each company submitted to the AGM each for approval.
Merger
Beams, Brozovsky, and Shoulders (2009: 5) states: "The merger
occurs when a company takes over all operations of entities other
businesses and entities were taken over is dissolved." Meanwhile, according
to Gitman (2009: 762): "The merger is a combination of two or more
companies, where the company generated maintain the identity of one of
the companies, usually the largest companies. "According to the Regulation
No. 57 of 2010 the merger was" legal actions performed by a single entity or
to combine with other business entities existing assets and liabilities
resulting from business entities that incorporate self-switch for the law to
business entities that receive incorporation and subsequent status of a
business entity that combines self-ends because of the law. "
Profitability
According to Agus (2010: 122): "Profitability is the ability of the
company makes a profit in relation to sales, total assets and own capital."
Meanwhile, according to Susilawati (2012: 180): "Profitability describes the
company's operational performance by providing large gains can be
achieved in running the company's operations. Profitability shows the
ability of capital invested in the total assets to generate profits for investors."
So the profitability of a company's ability to earn a profit, which
illustrates the good or bad performance of the company seen from profits
Profitability ratios
According to Kashmir (2011:114): "The ratio is the ratio of
profitability to evaluate the ability of companies in search of gain or profit
in a given period. Ratio used is ROE, ROI, NPM, OPM, and GPM."
Meanwhile, according to Irham (2011; 135) is a profitability ratio
"Profitability ratios measure the effectiveness of the overall management
shown by the size of the level of profits in connection with the sale or
investment. The better the profitability ratio the better illustrate the ability
of the high profitability of the company. "
So the profitability ratio used to assess the company's ability to
make a profit and to measure the effectiveness of the overall management.
Type of Profitability Ratios
The types of profitability ratios used in this study are:
1.Net Profit Margin (NPM)
Earning after interest and tax
NPM = --- X 100%
Sales
Net Profit Margin is a measure profits by comparing the profit after interest
and taxes compared with sales. This ratio shows the company's net income
on the sale.
2. Return on Equity (ROE)
Earning after interest and tax
ROE = --- X 100%
Sales
Return on equity (ROE) or own capital profitability is to measure the ratio of
use of its own capital. The higher this ratio, the better. That is the position
of the owner of the company is getting stronger, and vice versa.
3. Return On I nvesment (ROI)
Earning after interest and tax
ROI = --- X 100%
Total Assets
Return on investment (ROI) or return on total assets is a ratio that shows the
results (return) on the amount of assets used in the company. ROI is also a
measure of the effectiveness of management in managing its investments.
It shows the productivity of the entire fund companies, both loan capital
and equity capital. The smaller the ROI increasingly less good, and vice
versa. This means that this ratio is used to measure the effectiveness of the
overall operation of the company.
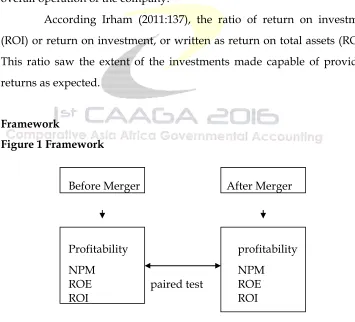
According Irham (2011:137), the ratio of return on investment
(ROI) or return on investment, or written as return on total assets (ROA).
This ratio saw the extent of the investments made capable of providing
returns as expected.
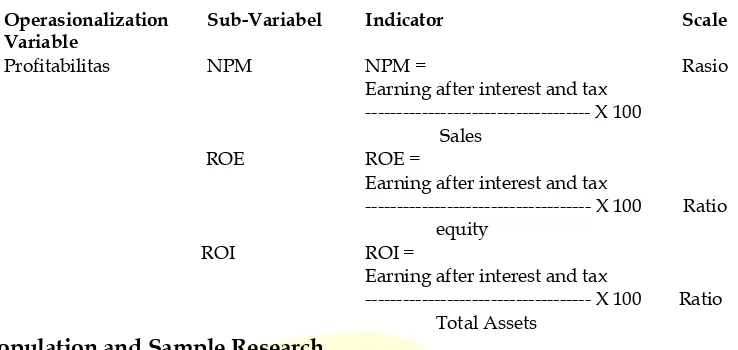
Framework
Figure 1 Framework
Before Merger After Merger
Profitability profitability
NPM NPM
ROE paired test ROE
ROI ROI
H1: There is a difference in the company's profitability as measured by the
ratio of Net
Profit Margin (NPM) before and after the merger.
H2: There is a difference in the company's profitability as measured by the
ratio of
Return on Equity (ROE) before and after the merger.
H3: There is a difference in the company's profitability as measured by the
ratio of return
On Investment (ROI) before and after the merger.
Object and Methode Research
Object of research
The object of research companies listed in the Indonesia Stock
Exchange. The company's profitability is measured using the Net Profit
Margin (NPM), Return on Equity (ROE) and Return on Investment (ROI).
The time period used in this study is a company that merged between 2009
-2015.
Research methods
Descriptive analysis method and comparative method (Sugiyono
(2011: 2)), the descriptive method is: "A method in researching the status of
a group of people, an object, a condition, a system of thought, or an event
in the present" and Natzir (200 954), descriptive research goal is to create a
description, picture or painting in a systematic, factual and accurate
information on the facts, nature and the relationship between the
phenomenon investigated ". The comparative method according to Nazir
answers to fundamental about the result, by analyzing the factors that cause
the occurrence or the emergence of a particular phenomenon. "
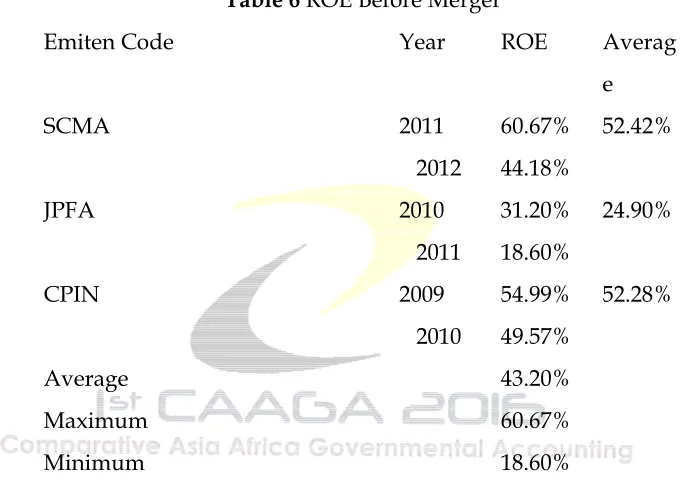
Table 1
Operasionalization Variable
Operasionalization Variable
Sub-Variabel Indicator Scale
Profitabilitas NPM NPM =
Earning after interest and tax --- X 100 Sales
Rasio
ROE ROE =
Earning after interest and tax
--- X 100 Ratio equity
ROI ROI =
Earning after interest and tax
--- X 100 Ratio Total Assets
Population and Sample Research
The population in this study is a company listed on the Indonesia
Stock Exchange (IDX) in the period 2009-2015. The sampling technique used
in this research is purposive sampling method. Sample companies were
selected based on the following criteria:
1. The company is listed on the Indonesia Stock Exchange (IDX).
2. The Company's non-bank merger between 2010-2014.
3. Companies that publishes financial statements of the two
years before the merger, and two years after the merger.
Table 2 Reserach Sampel
Research Sampel
Emiten Code
Emiten Merger Result
Merger
Date of Merger
1 SCMA PT Surya Citra Media
Tbk
PT Indosiar Karya Media Tbk
PT Surya Citra Media Tbk
1 Mei 2013
2 JPFA PT Japfa Comfeed
Indonesia Tbk
PT Japfa Comfeed Indonesia Tbk
PT Multibeeder Adirama Indonesia Tbk
3 CPIN PT Charoen Pokphand
Jaya Farm Tbk PT Cipendawa Agriindustri Tbk
PT Charoen Pokphand Jaya Farm
8 juni 2011
Source: IDX Indonesia 2016
Different test
According Sunyoto (2013: 29), the purpose of the different test or
test this hypothesis is to test the prices of statistics, the mean and the
proportion of one or two samples studied. Test difference by Kuncoro (2013:
219), including Chi-square test (x2) for differences between groups, the Z
test for the difference in proportion, and the t test for differences in average.
According Atmaja (2009: 197), there are two methods used to test
the hypothesis, parametric methods which require the assumption that the
data are normally distributed. Nonparametric method that does not require
the assumption that the data are normally distributed.
The data has been normally distributed, tested using parametric
methods. However, if the data is not distributed normally, then the different
tests conducted by nonparametric methods.
The difference will be tested in this study was prior to the merger
and after the merger, so that the output will be visible there or 43 whether
the average difference of the profitability of the companies represented by
the ratio of NPM, ROE and ROI.
Hypothesis testing
Testing this hypothesis aims to determine whether or not the
difference Net Profit Margin (NPM), Return on Equity (ROE) and Return
tested using paired samples t test were processed using IBM SPSS Statistics
application 20. The steps of hypothesis testing are as follows:
A. formulate hypothesis
Ho: X1 = X2 no differences Net Profit Margin before and after the merger.
Ha: X1 ≠ X2 Net Profit Margin no difference before and after the merger.
Ho: X1 = X2 there is no difference in return on equity before and after the merger.
Ha: X1 ≠ X2 is no difference in return on equity before and after the merger.
Ho: X1 = X2 no difference Return on Investment before and after the merger. Ha: X1 ≠ X2 Return on Investment is no difference before and after the merger.
B. Statistic test
Testing the hypothesis in this study is paired samples test.
According Ghozali (2011: 66), paired samples test was used to test whether
there are differences in the average of two samples related. According
Nisfiannoor (2009: 118), paired sample t test aims to test the mean difference
for the two groups of pairs, the subject is the same, but have two different
treatments or measurements. There is a pre-test and post-test or no
measurement of phase I and phase II.
C. Stating the level of significance and draw conclusions
In this test using a significance level α. 5 with degrees of freedom (db = n-k-1) where n is the number of samples and k is the number of
variables. From the test results paired sample t test using IBM SPSS
Statistics 20, the variable is said to have no significant difference between
before and after the merger or accept H0 if asymptotic sig> significance
level used in pengujiaan. Conversely variable is said to have a significant
difference between before and after the merger or reject Ho if asymptotic
sig <significant level.
Companies that merged and listed in Indonesia Stock Exchange
2009-2015 period. Is:
Table 3 The Company that merged in the year 2009 until 2015
No Sample
Emiten Code
Emiten Company Name Date of Merger
1 SCMA PT Surya Citra Media Tbk 1 Mei 2013
2 JPFA PT Japfa Comfeed Indonesia Tbk 2 juli 2012
3 CPIN PT Charoen Pokphand Jaya Farm
Tbk
8 juni 2011
Source: Idx Indonesia 2016
Descreptive Statitistic:
Net Profit Margin (NPM)
Table 4 NPM Before Marger
Emiten Code Year NPM Average
SCMA 2011 39.56% 37.63%
2012 35.70%
JPFA 2010 6.87% 5.41%
2011 3.95%
CPIN 2009 11.07% 12.86%
2010 14.66%
Average 18.64% Maximum 39.56% Minimum 3.95% Source: IDX Indonesia
Table 4 presents the descriptive value NPM generated by SCMA,
JPFA and CPIN before the merger. In Table 4 shows that: the value of the
lowest net profit margin before the merger is owned by JPFA amounted to
3.95%. While the value of the highest net profit margin before the merger is
owned by SCMA amounted to 39.56%. Overall, the value of the average net
profit margin was 18.64% before the merger.
SCMA in 2011 had a net profit margin of 39.56% and in 2012 the
net profit margin of the company decreased by 3.86% from the previous
year to 35.70%. JPFA in 2010 had a net profit margin of 6.87% and in 2011
to 3.95%. CPIN in 2009 had a net profit margin of 11:07% and in 2010 the
company's net profit margin increased by 3:59% from the previous year to
14.66%.
Table 5 NPM after Marger
Emiten Code Year NPM Average
SCMA 2014 35.71% 35.65%
2015 35.60%
JPFA 2013 2.78% 2.07%
2014 1.36%
CPIN 2012 12.58% 11.22%
2013 9.85%
Average 16.31% Maximum 35.71% Minimum 1.36% Source: Idx Indonesia 2016
`In Table 5 presents the descriptive value NPM generated by
SCMA, JPFA and CPIN after the merger. In Table 5 it can be seen that the
value of the lowest net profit margin after the merger is owned by JPFA at
1:36%. While the value of the highest net profit margin after the merger is
owned by SCMA amounted to 35.71%. Overall, the value of the average net
profit margin after the merger is 16:31%.
SCMA in 2014 had a net profit margin of 35.71% and in 2015 the
net profit margin of the company decreased by 12:11% from the previous
year to 35.60%. JPFA in 2013 had a net profit margin of 2.78% and in 2014
the net profit margin of the company decreased by 1:42% from a year earlier
to 1:36%. CPIN in 2012 had a net profit margin of 12:58% and in 2013 the
net profit margin of the company decreased by 2.73% from the previous
In Table 4 and Table 5 can be seen that the average - average net profit
margin of 18.64% before the merger is greater than - average net profit
margin of 16.31% after the merger. Average - Average net profit margin
decreased by 2:33% after the merger.
Return on Equity (ROE)
Table 6 ROE Before Merger
Emiten Code Year ROE Averag
e
SCMA 2011 60.67% 52.42%
2012 44.18%
JPFA 2010 31.20% 24.90%
2011 18.60%
CPIN 2009 54.99% 52.28%
2010 49.57%
Average 43.20%
Maximum 60.67%
Minimum 18.60%
Source: Idx Indonesia 2016
Table 6 presents the descriptive value ROE generated by SCMA,
JPFA and CPIN before the merger. In Table 6 it can be seen that the value
of the lowest return on equity before the merger is owned by JPFA
amounted to 18.60%. While the value of the highest return on equity before
the merger is owned by SCMA amounted to 60.67%. Overall, the value of
the average return on equity was 43.20% before the merger.
SCMA in 2011 had a return on equity of 60.67% and in 2012 the
return on equity of companies decreased by 16:49% from the previous year
company's return on equity has decreased by 12.60% from the previous year
to 18.60%. JPFA in 2009 had a return on equity of 54.99% and in 2010 the
company's return on equity decreased by 5:42% from the previous year to
49.57%.
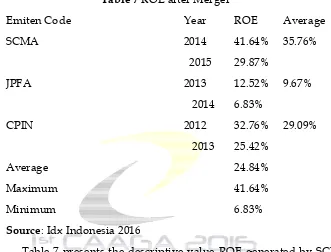
Table 7 ROE after Merger
Emiten Code Year ROE Average
SCMA 2014 41.64% 35.76%
2015 29.87%
JPFA 2013 12.52% 9.67%
2014 6.83%
CPIN 2012 32.76% 29.09%
2013 25.42%
Average 24.84%
Maximum 41.64%
Minimum 6.83%
Source: Idx Indonesia 2016
Table 7 presents the descriptive value ROE generated by SCMA,
JPFA and CPIN after the merger. In Table 7 it can be seen that the value of
the lowest return on equity after the merger is owned by JPFA amounted to
6.83%. While the value of the highest return on equity after the merger is
owned by SCMA amounted to 41.64%. Overall, the value of the average
return on equity was 24.84% after the merger. SCMA in 2014 had a return
on equity of 41.64% and a 2015 return on equity of companies decreased by
11.77% from the previous year to 29.87%. JPFA in 2013 had a return on
equity of 12:52% and in 2014 the return on equity of companies decreased
by 5.69% from the previous year to 6.83%. CPIN in 2012 had a return on
equity of 32.76% and in 2013 the return on equity of companies decreased
In Table 6 and Table 7 it can be seen that the average - average
return on equity amounted to 43.20% before the merger is greater than -
average return on equity amounted to 24.84% after the merger. Average -
Average return on equity decreased by 18:36% after the merger.
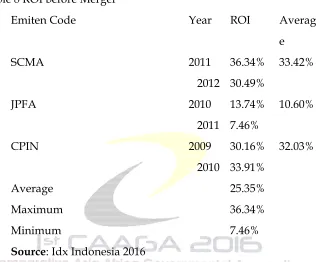
Return On Investment (ROI) Table 8 ROI before Merger
Emiten Code Year ROI Averag
e
SCMA 2011 36.34% 33.42%
2012 30.49%
JPFA 2010 13.74% 10.60%
2011 7.46%
CPIN 2009 30.16% 32.03%
2010 33.91%
Average 25.35%
Maximum 36.34%
Minimum 7.46%
Source: Idx Indonesia 2016
Table 8 presents the descriptive value ROI generated by SCMA,
JPFA and, CPIN before the merger. In Table 8 it can be seen that the value
of the lowest return on investment before the merger is owned by JPFA at
7:46%. While the value of the highest return on investment before the
merger is owned by SCMA amounted to 36.34%. Overall, the average value
of return on investment before the merger is 25.35%.
SCMA in 2011 had a return on equity of 36.34% and in 2012 the
return on equity of companies decreased by 5.85% from the previous year
to 30.49%. JPFA in 2010 had a return on equity of 13.74% and in 2011 the
CPIN in 2009 had a return on equity of 30.16% and in 2010 the company's
return on equity increased by 3.75% from the previous year to 33.91%
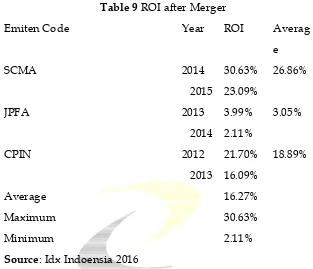
Table 9 ROI after Merger
Emiten Code Year ROI Averag
e
SCMA 2014 30.63% 26.86%
2015 23.09%
JPFA 2013 3.99% 3.05%
2014 2.11%
CPIN 2012 21.70% 18.89%
2013 16.09%
Average 16.27%
Maximum 30.63%
Minimum 2.11%
Source: Idx Indoensia 2016
Table 9 presents the descriptive value ROI generated by SCMA,
JPFA, and, CPIN after the merger. In Table 9 it can be seen that the value of
the lowest return on investment after the merger is owned by JPFA at 2:11%.
While the value of the highest return on investment after the merger is
owned by SCMA amounted to 30.63%. Overall, the average value of the
return on investment after the merger is 16:27%.
SCMA in 2014 had a return on equity of 30.63% and a 2015 return
on equity of companies decreased by 7:54% from a year earlier to 23:09%.
JPFA in 2013 had a return on equity of 3.99% and a 2014 return on equity of
companies decreased by 1.88% from a year earlier to 2:11%. CPIN in 2012
had a return on equity of 21.70% and in 2013 the return on equity of
In Table 8 and Table 9 it can be seen that the average - average return on
equity amounted to 25.35% before the merger is greater than - average
return on equity after the merger of 16:27%. Average - Average return on
equity decreased by 9:08% after the merger.
Hypothesis Testing Results
Testing the hypothesis in this study using a different test paired
sample t-test is processed using IBM SPSS Statistics application 20. The
difference will be tested in this study was prior to the merger and after the
merger, so that the output will be seen whether or not the difference in the
average of the profitability of the companies represented by the ratio of
NPM, ROE and ROI.
Paired sample t-test Net Profit Margin (NPM)
Ho: X1 = X2 no differences Net Profit Margin before and after the merger. Ha: X1 ≠ X2 Net Profit Margin no difference before and after the merger.
Table 10 Descriptive Statistics Net Profit Margin before and after merger
Descriptive Statistics Net Profit Margin before and after merger
N
Minimum Maximu
m
Mean Std.
Deviation
npm_before
6
.039 .396 .18650 .152173
npm_after
6
.014 .357 .16333 .155419
Valid N (listwise) 6
Source: IBM SPSS Statistics
20
Table 10 shows that the lowest net profit margin before the merger,
namely 3.9% and 1.4% after the merger, which means that for every IDR
1.00 of net sales resulted in a net profit as much as 3.9% of net sales before
the merger, and 1.4% of net sales after the merger. while the highest net
profit margin before the merger, namely 39.6% and 35.7% after the merger,
which means that for every IDR 1.00 of net sales resulted in a net profit as
much as 39.6% of net sales before the merger and 35.7% of net sales after the
merger. Average - Average net profit margin before and after the merger
has decreased by 2.3% (18 933% - 16,333%) this shows that for every IDR
1.00 of net sales resulted in a net profit as much as 18.9% of net sales before
the merger and 16.3% of sales clean after the merger, meaning that the net
profit margin before the merger is better than the net profit margin after the
merger.
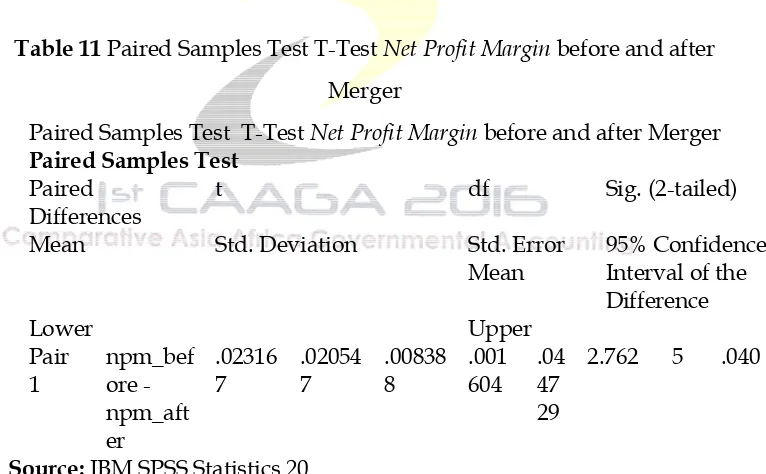
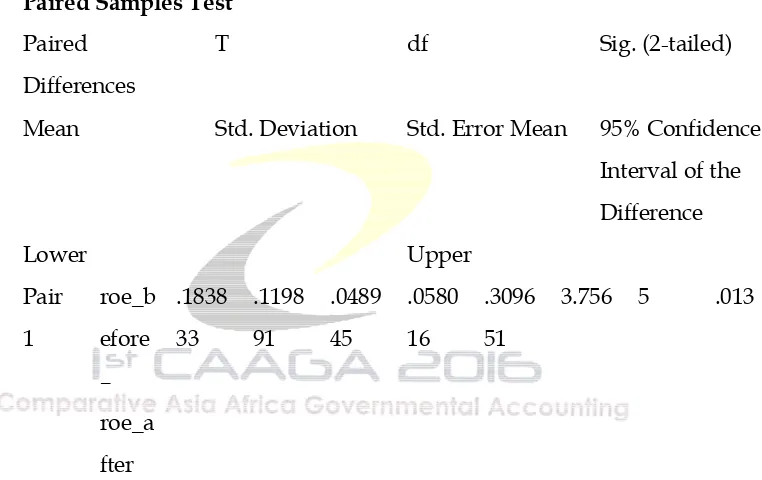
Table 11 Paired Samples Test T-Test Net Profit Margin before and after
Merger
Paired Samples Test T-Test Net Profit Margin before and after Merger Paired Samples Test
Paired Differences
t df Sig. (2-tailed)
Mean Std. Deviation Std. Error
Mean
95% Confidence Interval of the Difference
Lower Upper
Pair 1 npm_bef ore - npm_aft er .02316 7 .02054 7 .00838 8 .001 604 .04 47 29
2.762 5 .040
Source: IBM SPSS Statistics 20
Based on the results of Paired Samples Test on Table 10 shows that the value of 2762 while tcount ttable 2,571 (df = 5, α = 0.05), and the significance value obtained by the 0.040> 0.05 (the real level of significance
conclude there is no difference between the Net Profit Margin before and
after the merger.
Paired Samples Test Return on Equity (ROE)
Ho: X1 = X2 there is no difference in return on equity before and after the
merger.
Ha: X1 ≠ X2 Return on Equity was no difference before and after the merger.
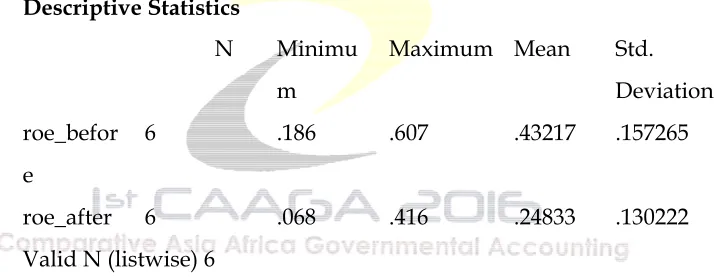
Table 12 Descriptive Statistic Return On Equity before and after merger
Descriptive Statistic Return On Equity before and after merger
Descriptive Statistics
N Minimu
m
Maximum Mean Std.
Deviation
roe_befor
e
6 .186 .607 .43217 .157265
roe_after 6 .068 .416 .24833 .130222
Valid N (listwise) 6
Source: IBM SPSS Statistic 20
Table 12 shows that the Return on Equity lows before the merger,
namely 18.6% and 6.8% after the merger, which means that out of every IDR
1,00 equity company earned a net profit as much as 18.6% of the equity of
the company prior to the merger and 6.8% of the equity of the company
after the merger. While the highest return on equity before the merger,
namely 60.7% and 41.6% after the merger, which means that for every IDR
1.00 of equity companies, generate a net profit of as much as 60.7% of the
company after the merger. Average - Average return on equity before and
after the merger has decreased by 18.4% (43 217% - 24 833%) this shows that
for every IDR 1.00 of equity companies generate a net profit of as much as
43.2% of the equity of the company prior to the merger and 24.8% of the
equity after the merger, it means Return On Equity before the merger is
better than the return on equity after the merger.
Table 13 Paired Sample T-Test Return On Equity before and after Merger
Paired Sample T-Test Return On Equity before and after Merger
Paired Samples Test
Paired
Differences
T df Sig. (2-tailed)
Mean Std. Deviation Std. Error Mean 95% Confidence
Interval of the
Difference
Lower Upper
Pair
1
roe_b
efore
–
roe_a
fter
.1838
33
.1198
91
.0489
45
.0580
16
.3096
51
3.756 5 .013
Source: IBM SPSS Statistics 20
Based on the results of Paired Samples Test Table 13 shows that the value tcount is 3,756 by 2,571 while TTable (df = 5, α = 0.05), and the significance value obtained by the 0.013> 0.05. The hypothesis that can be
taken is H0 rejected. So we can conclude there is no difference between the
Paired Samples Test Return on Investment (ROI)
Ho: X1 = X2 no difference Return on Investment before and after the merger. Ha: X1 ≠ X2 Return on Investment is no difference before and after the merger.
Tabel 14 Descriptive statistics Return On Investment before and after
merger
Descriptive statistics Return On Investment before and after merger
Descriptive Statistics
N
Minimu
m
Maximum Mean Std.
Deviation
roi_befor
e
6 .075 .363 .25350 .118101
roi_after 6 .021 .306 .16267 .112504
Valid N (listwise) 6
Source: IBM SPSS Statistics 20
Table 14 shows that the Return On Investment lows before the
merger, namely 7.5% and after the merger 2.1% which means that out of
every IDR 1:00 capital invested in the company's assets generate a net profit
of as much as 7.5% of the total assets of the company prior to the merger
and 2.1% of the total assets of the company after the merger. while the
highest Return On Investment before the merger, namely 36.3% and 30.6%
after the merger, which means that for every IDR 1.00 of capital invested in
the company's assets generate a net profit of as much as 36.3% of the total
assets of the company prior to the merger and 30.6% of the total assets of
the company after merger. Average - Average Return On Investment before
and after the merger has decreased by 9.1% (25.35% - 16 267%) this shows
net profit of as much as 25.35% of the total assets of the company prior to
the merger and 16:27 % of the total assets of the company after the merger,
it means Return on Investment before the merger is better than the Return
on Investment after the merger.
Table 15 Paired Samples Test T-Test Return On Investment before and after
Merger
Paired Samples Test T-Test Return On Investment before and after Merger
Paired Samples Test
Paired
Differences
T df Sig. (2-tailed)
Mean Std. Deviation Std. Error Mean 95% Confidence
Interval of the
Difference
Lower Upper
Pair
1
roi_b
efore
-
roi_a
fter
.0908
33
.0589
35
.0240
60
.0289
85
.1526
82
3.775 5 .013
Source: IBM SPSS Statistics 20
Based on the results of Paired Samples Test on Table 15 shows that tcount is 3,775 while ttabel 2,571 (df = 5, α = 0.05), and the significance value obtained by the 0.013> 0.05 (the real level of significance of research). The
hypothesis that can be taken is H0 rejected. So we can conclude there is no
difference between the Return On Investment before and after the merger.
Discussion of Results
Summerize Hipotesis
Variabel trest
Profitability
Sig. Conclusion
H1 NPM 0.040 There is a difference
before and after merger
H2 ROE 0.013 There is a difference
before and after merger
H3 ROI 0.013 There is a difference
before and after merger
Source: Data yang diolah 2016
Differences Profitability Ratio Based Company That Measured Net Profit Margin (NPM) Before and After Merger
Based on test results seen in Table 16 it can be seen that the significance
value of 0.040 (two-tailed) is greater than the real level of significance was set in
this study is 0.05. It can be concluded that there are significant differences Net
Profit Margin before and after the merger.
The results of this study indicate that after the merger net profit margin
decline caused by a decline in net income and an increase in net sales. The increase
in net sales due to increased sales volumes. Meanwhile, sales expenses and general
and administrative increased due to the increase in salaries and employee benefits,
resulting in net income decline. The decline in the ratio indicates that the
company's profitability decreased views of the Net Profit Margin.
This is contrary to the theory of Wild et al. (2005: 359) states, the merger
may raise higher the image of the company, the potential for growth, corporate
welfare, and to increase its profit. This study showed different results with a
previous study conducted by Dhani Ichsanuddin (2010) which states that there is
merger. Research conducted by Edfan and Zirman (2011) also stated that there was
no difference in the average net profit margin before and after the merger.
Differences Profitability Based Company That Measured Ratio Return On Equity (ROE) Before And After Merger
Based on test results seen in Table 16 it can be seen that the significance
value of 0.013 (two-tailed) is greater than the real level of significance was set in
this study is 0:05. It can be concluded that there are significant differences in return
on equity before and after the merger.
The results of this study indicate that after the merger Return on Equity
decreased due to the decrease in net income and increased equity. The decline in
net income due to the increase in net sales and an increase in selling expenses and
general and administrative. While the company's equity has increased from the
profit for the year attributable to the parent entity. The decline in the ratio indicates
that the company's profitability decreased views of Return on Equity.
This is contrary to the theory of Wild et al. (2005: 359) states, the merger
may raise higher the image of the company, the potential for growth, corporate
welfare, and to increase its profit. This study showed different results with a
previous study conducted by Edfan and Zirman (2011) which states that there is
no difference in the average return on equity before and after the merger. Research
conducted by Sylviana May (2013) states that there is no difference in return on
equity before and after the merger.
Differences Profitability Ratio Based Company That Measured Return on Investment (ROI) Before and After Merger
Based on test results seen in Table 16 it can be seen that the significance
this study is 0:05. It can be concluded that there are significant differences Return
on Investment before and after the merger.
The results of this study indicate that after the merger the Return on
Investment decline caused by a decline in net income and an increase in total
assets. The decline in net income due to the increase in net sales and an increase in
selling expenses and general and administrative.
While the company's assets have increased due to the increase in fixed
assets, inventories, advances and accounts receivable. The decline in the ratio
indicates that the company's profitability decreased views of Return on Equity.
This is contrary to the theory of Wild et al. (2005: 359) states, the merger
may raise higher the image of the company, the potential for growth, corporate
welfare, and to increase its profit. This study showed different results with a
previous study conducted by Edfan and Zirman (2011) which states that there is
no difference in the average Return on Investment before and after the merger.
CONCLUSIONS AND SUGGESTIONS
CONCLUSIONS
The following conclusions:
1. Based on the results of descriptive analysis there is a decrease in
average Net Profit Margin after the merger. That is, the Net Profit
Margin before the merger is better than the Net Profit Margin after
the merger. Based on the results of testing of the hypothesis, the
study was able to prove that there is a difference in the net profit
margin before and after the merger.
2. Based on the results of descriptive analysis there is a decrease in
average return on equity after the merger. That is, the return on
equity before the merger better than the return on equity after the
was able to prove that there is a significant difference in the return
on equity before and after the merger.
3. Based on the results of descriptive analysis there is a decrease in
average Return on Investment after the merger. That is, the Return
on Investment before the merger is better than Return On Investment
after the merger. Based on the results of testing of the hypothesis, the
study was able to prove that there are differences on Return On
Investment before and after the merger
SUGGESTIONS
Suggestions can be submitted as follows:
1. for the enterprise
For the company that will conduct merger should do a good
preparation before deciding to merge. The company should really take into
account whether the merger will have a positive impact for the firm. In
addition companies that do mergers need to make adjustments, berusahan
improve performance and combines the advantages that have been owned
by the respective companies merged in order to achieve synergies and
enhance shareholder value.
2. for the financier or investor
Investors can invest more wisely by making observations on the
financial performance of companies based on financial statement
information. As well as more cautious in dealing with merger activities of
the company since the merger does not always bring a good impact on the
companies that have merged.
3. for further research
For other researchers who are interested in the same topic, further
research is expected to add the observation period and adds the object of
research, so that the number of samples used increasingly large and obtain
4. for institutions / universities
Institutions / Universities should multiply reference such as a
journal or the latest books on similar studies with this study, so further
research is easier to find a theory or examples of previous studies to be a
reference in conducting research.
REFERENCES
Agus Sartono, 2010, Manajemen Keuangan Teori dan Aplikasi. Yogyakarta: BPFE.
Beams, Brozovsky & Shoulders, 2009. Akuntansi Keuangan Lanjutan, jilid 1. Jakarta: PT INDEKS.
Brigham & Houston, 2010. Dasar-dasar Manajemen Keuangan Edisi 11. Jakarta: Salemba Empat.
Danang Sunyoto. 2013. Metodologi Penelitian Akuntansi. Bandung: PT. Refika Aditama.
Dhani Ichsanuddin Nur. 2010 . Dampak Keputusan Merger Pada Perbankan Di Bursa Efek Indonesia. Jurnal Aplikasi Manajemen, Vol 8, No 2. Edfan Darlis dan Zirman. 2011. Dampak Publikasi Akuisisi pada Perusahaan
Pengakuisisi. Jurnal Ekonomi, Volume 19 Nomor 3.
Gitman, Laurence J. 2009. Principles of Managerial Finance. Boston: Pearson Addison Weasley.
Gunawan dan Sukartha, 2013, Kinerja Pasar dan Kinerja Keuangan Sesudah Merger dan Akuisisi di Bursa Efek Indonesia. E-Jurnal Akuntansi Universitas Udayana 5.2: 271-290.
Hamidah dan Noviani, 2013, Perbandingan Kinerja Keuangan Perusahaan Sebelum dan Sesudah Merger dan Akuisisi (Pada Perusahaan
Pengakuisisi yang Terdaftar di Bursa Efek Indonesia Periode 2004-2006). Jurnal Riset Manajemen Sains Indonesia (JRMSI), Vol. 4 No.1.
Harahap, Sofyan Syafri, 2009. Analisis Kritis Atas Laporan Keuangan. Jakarta: Raja Grafindo Persada.
Hariyani, Serfianto & Yustisia, 2011, Merger, Konsolidasi, Akuisisi & Pemisahan Perusahaan: Cara Cerdas Mengembangkan & Memajukan Perusahaan. Jakarta : Visimedia.
Harianto dan Sudomo . 2001. Perangkat dan Analisis Investasi di Pasar Modal Indonesia. Jakarta : PT.BEJ.
Iftia Putri Utami, 2013, Pengaruh Akusisi Terhadap Profitabilitas Perusahaan Pengakuisisi (Studi Kasus Perusahaan Go Publik pada Bursa Efek Indonesia), Jurnal Manajemen, Vol 2, No 02.
Irham Fahmi. 2011. Analisis Laporan Keuangan. Bandung: Alfabeta. Kasmir. 2011. Analisis Laporan Keuangan. Jakarta: PT Raja Grafindo
Persada.
Kasmir. 2012. Analisis Laporan Keuangan. Jakarta: PT Raja Grafindo Persada.
Lukas Setia Atmaja. 2009. Statistik untuk Bisnis dan Ekonomi. Yogyakarta: Andi.
Liargovas & Repousis. 2011. The Impact of Mergers and Acquisitions on the Performance of the Greek Banking Sector: An Event Study Approach. International Journal of Economics and Finance, Vol. 3, No. 2. Mardalis, 2007. Metode Penelitian - Suatu Pendekatan Proposal. Jakarta: Bumi
Aksara.
Nazir, Moh. 2009. Metode Penelitian. Jakarta: Ghalia Indonesia.
Nisfiannoor, M. 2009. Pendekatan Statistik Modern untuk Ilmu Sosial. Jakarta: Salemba Humanika.
Peraturan Pemerintah Republik Indonesia Nomor 57 Tahun 2010 Tentang Penggabungan atau Peleburan Badan Usaha dan Pengambilalihan Saham Perusahaan yang dapat Mengakibatkan Terjadinya Praktik Monopoli dan Persaingan Usaha Tidak Sehat.
Ross, Stephen, Westerfield and Jordan, 2009. Pengantar Keuangan Perusahaan, Edisi 8. Diterjemahkan oleh: Yulianto dan Yuniasih. Jakarta: Salemba Empat.
Sathishkumar & Azhagaiah. 2014. Impact of Mergers and Acquisitions on Profitability: Evidence from Manufacturing Industri in India. Pacific Business Review International, Volume 7, Issue 1.
Singgih Santoso. 2010. Statistik Non Parametrik Konsep dan Aplikasi dengan SPSS. Jakarta: PT. Elex Media Komputindo.
Simanjuntak. 2004. Hukum Merger Perseroan Terbatas Teori dan Praktek. Jakarta: PT. Citra Aditya Bakti.
Situmorang, S. H. 2010. Analisis Data. Medan: USU Press.
Suad dan Enny. 2012. Dasar – Dasar Manajemen Keuangan, Edisi 6. Yogyakarta: UPP-AMP YKPN.
Sugiyono. 2010. Metode Penelitian Kuantitatif Kualitatif dan R&D. Bandung: Alfabeta.
Sugiyono. 2011. Statistik untuk Penelitian. Bandung: Alfabeta.
Suharyadi dan Purwanto. 2011. Statistika Untuk Ekonomi dan Keuangan Modern. Jakarta: Salemba Empat.
Susilawati, Christine D K dan Agustina, Lidya and Se Tin. 2012. Faktor- faktor yang Mempengaruhi Kebijakan Hutang (Perusahaan Manufaktur yang terdaftar di Bursa Efek Indonesia). Jurnal Keuangan dan Perbankan, vol 16 (2).
Sylviana May Restika. 2013. Kinerja Keuangan Sebelum dan Sesudah Merger: Bukti Empiris dari Industri Perbankan Indonesia. Jurnal Ilmu dan Riset Akuntansi, Vol. 1 No.2.
Undang – Undang Republik Indonesia Nomor 40 Tahun 2007 Tentang Perseroan Terbatas.
Uma Sekaran. 2006 . Metodologi Penelitian Untuk Bisnis, edisi 4. Jakarta: salemba empat. Wild, John J, K. R. Subramanyam and Robert F. Halsey . 2005. Analisis Laporan Keuangan, Edisi 8. Diterjemahkan oleh:
Bactiar dan Harahap. Jakarta : Salemba Empat.
Situs :
aria.bapepam.go.id id.portalgaruda.org www.idx.co.id
www.marketeers.com www.kppu.go.id
www.djpp.kemenkumham.go.id www.ccsenet.org