SPATIAL-TEMPORAL PATTERN OF VEGETATION INDEX CHANGE AND THE
RELATIONSHIP TO LAND SURFACE TEMPERATURE IN ZOIGE
Z. Chen a, W. G. Jiang a, *, Z. H. Tang b, K. Jia a
a Academy of Disaster Reduction and Emergency Management, Beijing Normal University, 19 Xinjiekouwai Street Beijing, China – [email protected], [email protected], [email protected]
b Community and Regional Planning Program, University of Nebraska-Lincoln, Lincoln, NE, USA – [email protected]
ICWG III/VII
KEY WORDS: Wetland Degradation, Vegetation Index, Land Surface Temperature, Temperature Vegetation Dryness Index, Zoige
ABSTRACT:
The Zoige wetland is the largest alpine peat wetland in China, and it has been degrading since 1960s. MODIS Enhance Vegetation Index (EVI) and Land Surface Temperature (LST) products in late august from 2000 to 2014 were employed to explore vegetation index and land surface temperature change tendency and to perform Temperature Vegetation Dryness Index (TVDI). The correlation between the annual mean of EVI and annual mean of LST was also calculated at pixel scale. The main purpose of this study is to explore the relationship between wetland degradation and climate change. The main conclusions are as follows: (1) Average EVI in Zoige plateau tended to be decreasing from 2000 to 2014, especially after 2007. In wetland areas, the annual mean of EVI were negative, while the slope were positive. It showed that the water storage of wetlands in Zoige plateau had been decreasing in the past 15 years and will keep decreasing in the future. (2) Overall, LST in the whole Zoige plateau had been increasing since 2000. While the minimum TVDI increased from 2000 to 2008 and then decreased. The change of TVDI suggested that drought should be a main factor that lead to wetland degradation in Zoige. (3) The uneven distribution of the correlation between EVI and LST suggested that LST is also one of the main reasons of wetland degradation.
* Corresponding author
1. INTRODUCTION
Global climate change has been a significant issue over last several decades. Regional hydrologic condition is affected by climate change. High latitudes and high altitudes are extremely sensitive to climate change (Zhang et al., 2004). Vegetation dynamic monitoring is a key to global change research. As a special and important terrestrial ecosystem, wetland has been influenced and degrading. How did vegetation change in alpine wetland and what is the relationship between vegetation change and climate change in alpine wetland? These are the main questions to explore in this work.
Vegetation index is the indicative factor of vegetation density and growth status (Huete et al., 2002). It can provide vegetation coverage and health information. It is also used to identify special objects by threshold method. The dynamics of vegetation index could indicate the change of vegetation and other land surface features (Guo et al., 2014). Normalized Difference Vegetation Index (NDVI) and Enhance Vegetation Index (EVI) are two popular vegetation indexes. EVI has been developed based on NDVI and it could eliminate background and atmosphere noises (Huete et al., 2002). Remote sensing data have been widely used to monitor vegetation change. The Moderate Resolution Imaging Spectroradiometer (MODIS) vegetation index dataset includes both NDVI and EVI data every 16 days and the spatial resolution is 250km. They are widely used in vegetation assessment and monitoring at regional scale (Cao et al., 2014; Jiang et al., 2015). Researches of vegetation dynamics have been widely public. Simple linear
regression analysis method is commonly used. The trend characteristic reflects whether vegetation is degraded or not.
In western China, drought happens frequently. Temperature is a significant driving factor of wetland degradation (Wu et al., 2014). The temperature variation impacts the surrounding environment of vegetation. Correlation coefficients are always used to reflect the relationship between temperature and EVI. It is also used to investigate the relationship between vegetation dynamic and climate change spatially.
The Zoige wetland, on the east edge of Tibetan Plateau, is the largest alpine peat wetland in China. It is located in Sichuan and Gansu Province. The total area is ~5000km2. From 1960s, Zoige wetland degraded significantly due to human activities and climate change. In this work, the EVI and Land Surface Temperature (LST) time series data from 2000 to 2014 were collected to study the variation of vegetation and LST. The simple linear regression analysis method was employed to reflect EVI change characteristics spatially. The Pearson correlation coefficient was employed to analyse the relationship between EVI change and LST spatially.
2. MATERIALS AND METHODS
2.1 Study area
The Zoige wetland is located in the source of Yellow River and Yangtze River, and the average altitude ranges from 3400m to 3600m. The climate type is humid and semihumid continental The International Archives of the Photogrammetry, Remote Sensing and Spatial Information Sciences, Volume XLI-B3, 2016
XXIII ISPRS Congress, 12–19 July 2016, Prague, Czech Republic
This contribution has been peer-reviewed.
monsoon climate of plateau cold temperate zone and it is cold and wet (Bai et al., 2008). The annual precipitation ranges from 580mm to 880mm. The average annual temperature ranges from 0.6℃ to 1.2℃(Bai et al., 2013).
In recent 50 years, drought frequently occurred in Zoige plateau. The climate was warming and drying with less precipitation and higher temperature (Guo et al., 2007). Due to the climate change and human activities, the surface water capacity was reducing and the wetland was shrinking (Luo, 2005).
2.2 Dataset and pre-processing
MODIS EVI and land surface temperature (LST) dataset were collected from EOS data gateway during the growing season of 2000 to 2014. The vegetation data (MOD13Q1) is 16-day composite and the spatial resolution is 500m. The LST dataset (MOD11A2) is 8-day composite and the spatial resolution is 1km.These data were reprojected to Albert equal area projection with MODIS Reprojection Tool (MRT). The LST data were
2.3.1 Changing tendency analysis: Simple statistical analysis method and linear regression method were both used to research vegetation and LST change trend in Zoige plateau from 2000 to 2014.
The simple statistical analysis method reveals the tendency by calculating the average value during a certain period. We calculated and counted the average value of EVI and LST, respectively and got EVI and LST change curves.
Simple linear regression method was used to simulate the trend of EVI from 2000 to 2014 (Guo et al., 2014). The simple linear regression analysis is as follows:
2 n = the number of studied years
EVIi = the maximum monthly EVI of year i
2.3.2 Correlation analysis of EVI and LST: The Pearson correlation coefficient was employed to estimate the linear relationship between vegetation change and LST change. The Pearson correlation coefficient is a measure of the linear
y = the average temperature for all years
2.3.3 Temperature-Vegetation Dryness Index (TVDI):
TVDI is a dryness index to describe soil moisture by estimating the relationship between vegetation index and temperature. It is widely used to monitor drought. The relationship between vegetation index and temperature is a triangular space composed of dry edge and wet edge. Both of dry edge and wet edge are linear function. The soil moisture reduces with the TVDI rising (Sandholt et al., 2002). The value of TVDI ranges from -1 to 1. The formula of TVDI is as follows:
)
3.1 Vegetation index change analysis
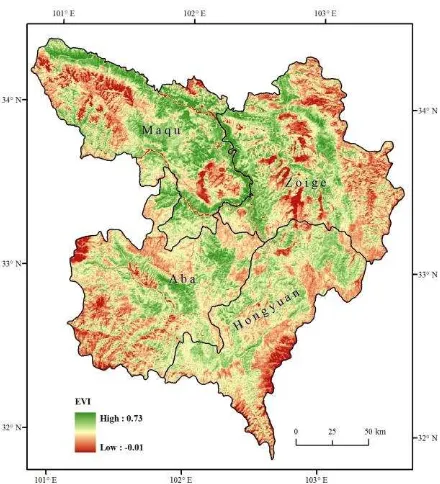
In order to show the spatial pattern of vegetation coverage in Zoige plateau, the average EVI was calculated at pixel scale from 2000 to 2014 (Figure 1).
Figure 1. The spatial pattern of mean EVI from 2000 to 2014 The International Archives of the Photogrammetry, Remote Sensing and Spatial Information Sciences, Volume XLI-B3, 2016
XXIII ISPRS Congress, 12–19 July 2016, Prague, Czech Republic
This contribution has been peer-reviewed.
As shown in Figure 1, the spatial pattern of EVI was significantly uneven. The mean EVI was the highest along the river bank, while it was the lowest in wetland and bare land. In Hongyuan and Aba counties, the grassland was the main land cover type and the EVI ranged from 0.2 to 0.3.
To explore the change of EVI annually, we calculated the mean EVI of the whole region. The change curve and trend line of EVI were plotted respectively (Figure 2). Annual mean EVI was decreased 8% from 2000 to 2014. From 2000 to 2009, annual mean EVI fluctuated greatly, while it fluctuated slightly from 2009 to 2014. Annual mean EVI value reached to the highest in 2007, while it was the lowest in 2002.
Figure 2. Variation of EVI during 2000 to 2014
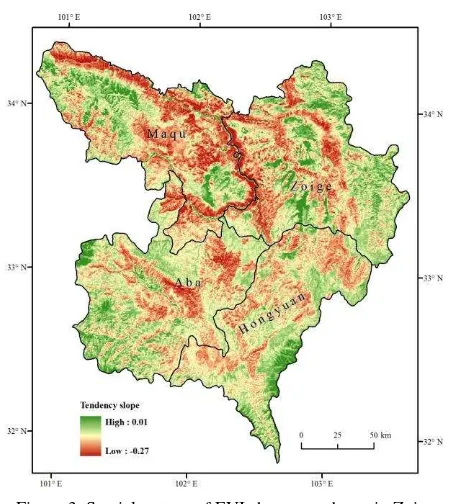
The change tendency of annual mean EVI was calculated spatially with formula (1). Overall, Figure 3 showed that annual mean EVI tended to decrease, especially in Aba and Hongyuan grassland, river banks and some of woodland. But the EVI value of wetland tended to increase. Due to the warming and drying trend, some marshes were drying up and turned to be meadow in Zoige plateau.
Figure 3. Spatial pattern of EVI change tendency in Zoige
Compared with Figure 1, pixels with the high values in Figure 1 had decreasing tendency in Figure 3, while pixels with the low
values had increasing tendency in Figure 3. The probable reason is the degradation of vegetation and wetland drying.
3.2 Variation of LST and TVDI
The mean LST and TVDI were calculated to explore the change of LST and soil moisture annually. The change curves and trend lines of LST from 2000 to 2014 were plotted respectively (Figure 4). Overall, annual average LST was decreasing, and the highest LST occurred in 2002. But annual mean LST was increasing both from 2000 to 2002 and from 2003 to 2014.
Figure 4. Variation of LST during 2000 to 2014
The change curves and trend lines of the minimum and maximum TDVI were calculated respectively (Figure 5, Figure 6).
Figure 5. Variation of the minimum TVDI during 2000 to 2014
Figure 6. Variation of the maximum TVDI during 2000 to 2014
As shown in Figure 5 and Figure 6, the minimum and maximum value of TVDI both increased from 2000 to 2014. The value of TVDI fluctuated greatly from 2000 to 2009 and fluctuated slightly from 2009 to 2014. The minimum value of TVDI increased from 2000 to 2009, while decreased since 2010. It was implied that soil moisture of Zoige plateau reduced in the past 15 years.
The International Archives of the Photogrammetry, Remote Sensing and Spatial Information Sciences, Volume XLI-B3, 2016 XXIII ISPRS Congress, 12–19 July 2016, Prague, Czech Republic
This contribution has been peer-reviewed.
3.3 Correlation of EVI and LST
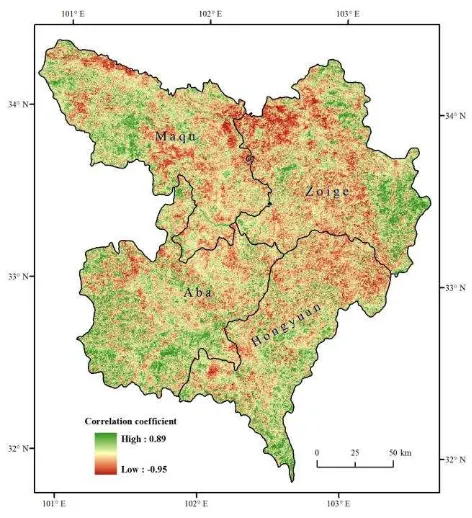
Land surface temperature is an important factor impacting the vegetation coverage. To study the effect of LST on EVI, the correlation between annual EVI and LST was calculated (Figure 7). The spatial pattern of correlation showed that ~60% of the region had a negative correlation between annual EVI and LST, especially in Zoige County and northwest of Maqu County. While in some of wetlands including rivers, the correlations were significantly positive. It indicated that grassland, wetland and meadow were suffered from a serious drought and degradation. Land surface temperature rising is likely to be a significant reason.
Figure 7. Correlation between annual EVI and LST
4. DISCUSSION AND CONCLUSIONS
Vegetation index is a widely used parameter to analyse the environment change in a certain region. EVI was employed to study how vegetation and wetland changed in Zoige plateau. Generally, it was wetland where the mean EVI was less than 0 (Figure 1). As shown in Figure 3, annual mean EVI of wetland tended to increase. It indicated that the water storage of wetland was reducing and wetland was turning to be meadow.
To explore the effect of climate change on EVI, TVDI and change curves and tends line of TVDI were calculated. As shown in Figure 5, the value of TVDI fluctuated greatly from 2000 to 2008 and increased quickly to the maximum in 2004, after the drought in 2003. Similarly, the value of TVDI increased significantly after 2010, when a serious drought occurred in southwest of China. The value of TVDI is determined by EVI and LST. The possible reason why the value of TVDI increased is climate warming and drying in Zoige plateau. While the change of wetland to meadow improved the vegetation coverage and that was the possible reason why the value of TVDI decreased.
Climate change is the key driving factor for wetland degradation. The Pearson correlation coefficient between LST and EVI was calculated. Most of the Zoige plateau had a negative correlation while some wetlands had positive correlations. It implied that climate change was a significant reason for wetland degradation in Zoige.
REFERENCES
Bai, J. H., Lu, Q. Q., Zhao, Q. Q., Wang, J. J., Ouyang, H., 2013. Effects of alpine wetland landscapes on regional climate on the Zoige plateau of China. Advances in Meteorology, 2013(5), pp. 1-7.
Bai, J. H., Ouyang, H., Cui, B. S., Wang, Q. G., Chen, H., 2008. Changes in landscape pattern of alpine wetlands on the Zoige Plateau in the past four decades. Acta Ecologica Sinica, 28(5), pp. 2245-2252.
Cao, R., Jiang, W. G., Yuan, L. H., Wang, W. J., Lv, Z. L., Chen, Z., 2014. Inter-annual variations in vegetation and their response to climatic factors in the upper catchments of the Yellow River from 2000 to 2010. Journal of Geographical Sciences, 24(6), pp. 963-979.
Guo, J., Li, G. P., 2007. Climate change in Zoige plateau marsh wetland and its impact on wetland degradation. Plateau Meteorology, 26(2), pp. 422-428.
Guo, W., Ni, X. N., Jing, D. Y., Li, S. H., 2014. Spatial-temporal patterns of vegetation dynamics and their relationships to climate variations in Qinghai Lake Basin using MODIS time-series data. Journal of Geographical Sciences, 24(6), pp. 1009-1021.
Huete, A., Didan, K., Miura, T., Rodriguez, E. P., Gao, X., Ferreira, L. G., 2002. Overview of the radiometric and biophysical performance of the MODIS vegetation indices. Remote Sensing of Environment, 83(s1-2), pp. 195-213.
Jiang, W. G., Yuan, L. H., Wang, W. J., Cao, R., Zhang, Y. F., Shen, W. M., 2015. Spatio-temporal analysis of vegetation variation in the Yellow River Basin. Ecological Indicators, 51, pp. 117-126.
Luo, L., 2005. Analysis of climatic background of wetlands degradation in the Qinghai-Xizang Plateau. Wetland Science, 3(3), pp. 190-199.
Sandholt, I., Rasmussen, K., Andersen, J., 2002. A simple interpretation of the surface temperature/vegetation index space for assessment of surface moisture status. Remote Sensing of Environment, 79, pp. 213-224.
Wu, S. H., Zhou, S. L., Chen, D. X., Wei, Z. Q., Dai, L., Li, X. G., 2014. Determining the contributions of urbanization and climate change to NPP variations over the last decade in the Yangtze River Delta, China. Science of the Total Environment, 472, pp. 397-406.
Zhang, X., Friedl, M. A., Schaaf, C. B., Strahler, A. H., Annemarie, S., 2004. The footprint of urban climates on vegetation phenology. Geophysical Research Letters, 31(12), pp. 179-206.
The International Archives of the Photogrammetry, Remote Sensing and Spatial Information Sciences, Volume XLI-B3, 2016 XXIII ISPRS Congress, 12–19 July 2016, Prague, Czech Republic
This contribution has been peer-reviewed.