Lampiran 1
Kuesioner Penelitian
Hubungan Faktor Resiko dengan Terjadinya Nyeri Punggung Bawah
( Low Back Pain) Pada Tenaga Kerja Bongkar Muat (TKBM) Di Pelabuhan
Belawan Medan Tahun 2015
Nomor Responden
:
I. Faktor Personal
1. Umur
:
2. BB (berat badan)
:
3. TB (tinggi badan)
:
4. IMT (Indeks Masa Tubuh)
:
5. Masa kerja
:
6. Apakah anda seorang perokok?
a. Ya
b.Tidak
7. Berapa kali anda melakukan kegiatan olahraga dalam seminggu ?
1. Sering ( ≥ 3 kali sering )
2. Kadang ( 1- 2 kali seminggu )
3. Jarang ( 1- 3 kali sebulan )
8. Berapa lama anda bekerja dalam satu hari ?
a. ≥8 jam
b. < 8
Lampiran 1
II.
Faktor pekerjaan
1. Pengukuran beban kerja
Nama
Beban kerja
Ringan
(75 – 100 /
menit )
Sedang
(100 – 125 /
menit)
Berat
( 125 – 150 /
menit )
2. Pengukuran Sikap Kerja Dengan Metode REBA (Rapid Entry Body
Assesment)
Tabel A.
1. Pergerakan Leher
Lampiran 1
2. Pergerakan Punggung
Skor :
3. Pergerakan Kaki
Lampiran 1
Tabel. B
1. Pergerakan Lengan Atas
Skor :
2. Pergerakan Lengan Bawah
Lampiran 1
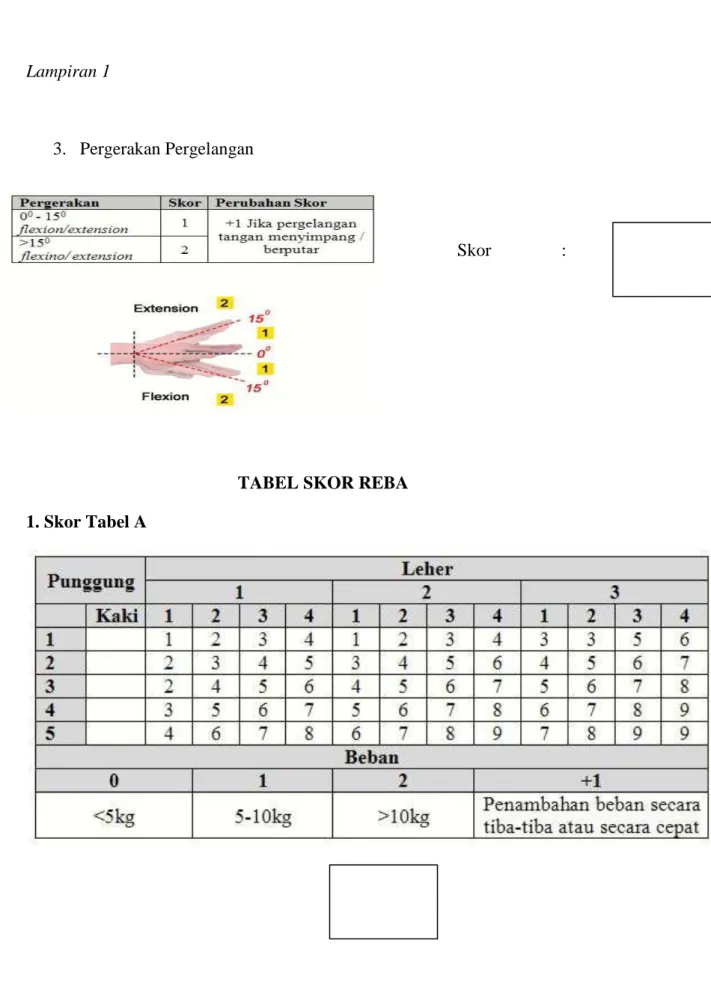
3. Pergerakan Pergelangan
Skor
:
TABEL SKOR REBA
1. Skor Tabel A
Lampiran 1
Lampiran 1
Sikap Kerja TKBM Pelabuhan Belawan
Keterangan sikap kerja :
1. Pergerakan leher 12
02. Pergerakan punggung 80
03. Pergerakan kaki 40
04. Pergerakan lengan atas 20
080
◦
12
◦
20
◦
40◦
0◦
Keterangan sikap kerja :
1. Pergerakan punggung 60
02. Pergerakan kaki 40
03. Pergelangan lengan atas 20
060
◦
40
◦
Keterangan sikap kerja :
1. Pergerakan leher 15
02. Pergerakan punggung 80
03. Pergerakan kaki 60
04. Pergerakan lengan bawah 60
05. Pergerakan pergelangan 15
080
◦
60
◦
15
◦
60
◦
15
◦
MASTER DATA
HUBUNGAN FAKTOR RESIKO DENGAN TERJADINYA NYERI PUNGGUNG BAWAH ( LOW BACK PAIN ) PADA
TENAGA KERJA BONGKAR MUAT ( TKBM ) DI PELABUHAN BELAWAN TAHUN 2015
No
.
Case
control
Umur Umurk
BB
TB
IMT
IMTK
Masa Masak
Rokok
Olahraga
Lama
denyutseb
denyutses beban
sikap
1
1
34
2
70
167
25
2
6
2
1
2
1
93
119
2
2
2
1
36
2
68
176
22
2
5
2
1
2
1
92
109
2
2
3
1
27
2
68
170
24
2
2
1
1
2
2
83
108
1
2
4
1
24
1
60
183
18
1
2
1
1
1
1
98
124
2
1
5
1
23
1
68
173
23
2
5
2
1
1
1
88
115
2
1
6
1
24
1
68
165
25
2
5
2
1
1
2
82
118
1
1
7
1
40
2
60
160
23
2
6
2
1
2
1
96
119
2
2
8
1
24
1
58
162
22
2
5
2
1
1
1
83
107
1
1
9
1
50
2
60
165
22
2
15
2
1
2
2
81
116
1
2
10
1
23
1
60
180
19
2
5
2
1
1
1
91
118
2
1
11
1
24
1
80
180
25
2
5
2
2
1
1
85
119
2
1
12
1
24
1
58
160
23
2
6
2
1
1
2
91
116
2
1
13
1
30
2
54
166
20
2
2
1
1
2
1
81
98
1
2
14
1
50
2
63
160
25
2
10
2
2
2
1
92
119
2
2
15
1
24
1
67
175
22
2
6
2
1
1
2
84
119
2
1
16
1
52
2
58
162
22
2
16
2
2
2
1
84
117
2
2
17
1
52
2
60
163
23
2
21
2
2
2
1
94
116
2
2
18
1
49
2
57
167
20
2
14
2
1
2
2
86
117
2
2
19
1
22
1
51
166
19
2
3
1
1
1
1
82
98
1
1
20
1
27
2
55
165
20
2
2
1
1
2
1
80
98
1
2
21
1
28
2
78
190
22
2
3
1
1
2
2
85
115
1
2
22
1
24
1
60
160
23
2
6
2
1
1
1
84
132
2
1
23
1
24
1
60
180
19
2
5
2
1
1
1
92
114
2
1
24
1
23
1
51
165
19
2
5
2
1
1
2
95
136
2
1
25
1
33
2
59
165
22
2
10
2
1
2
1
83
131
2
1
26
1
40
2
68
165
25
2
12
2
1
2
1
94
107
2
2
27
1
24
1
60
165
22
2
6
2
1
1
2
90
131
2
1
28
1
37
2
62
166
22
2
9
2
1
2
1
92
109
2
2
29
1
39
2
57
165
21
2
15
2
1
2
1
99
105
2
2
30
1
26
2
53
165
19
2
3
1
1
2
1
82
116
1
2
31
1
35
2
59
164
22
2
7
2
1
2
1
94
132
2
2
32
1
24
1
67
166
24
2
6
2
1
1
1
89
130
2
1
33
2
24
1
65
163
24
2
5
2
1
1
1
95
116
2
1
34
2
36
2
64
170
22
2
9
2
1
2
1
83
118
2
2
35
2
29
2
50
165
18
1
8
2
1
2
1
85
93
2
2
36
2
24
1
60
170
21
2
6
2
1
1
1
88
132
2
1
37
2
21
1
65
170
22
2
2
1
1
1
1
82
98
1
1
38
2
53
2
68
170
24
2
30
2
1
2
1
84
131
2
2
39
2
24
1
63
160
24
2
6
2
1
1
1
82
132
2
1
40
2
23
1
58
162
22
2
5
2
1
1
1
85
132
2
1
41
2
23
1
61
164
23
2
2
1
1
1
1
82
100
1
1
42
2
23
1
61
173
20
2
5
2
1
1
1
82
131
2
1
43
2
24
1
52
167
19
2
6
2
1
1
1
91
118
2
1
44
2
19
1
60
160
23
2
2
1
1
1
1
84
110
1
1
45
2
23
1
53
165
19
2
3
1
1
1
82
116
1
1
46
2
24
1
51
160
20
2
6
2
1
1
2
92
131
2
1
47
2
37
2
65
170
22
2
8
2
1
2
1
80
131
2 2
48
2
23
1
52
170
18
1
5
2
1
1
1
93
119
2
1
49
2
24
1
60
163
23
2
5
2
1
1
1
83
119
2
1
50
2
23
1
56
165
21
2
5
2
1
1
1
80
92
1
1
51
2
50
2
50
163
19
2
15
2
1
2
1
78
110
1
2
52
2
26
2
50
161
19
2
3
1
1
2
2
83
110
1
2
53
2
23
1
60
160
20
2
2
1
2
1
1
81
100
1
1
54
2
29
2
65
160
23
2
3
1
1
2
1
84
90
1
2
55
2
24
1
54
170
22
2
3
1
1
1
1
62
91
1
1
56
2
22
1
53
168
19
2
3
1
2
1
1
80
90
1
1
57
2
24
1
52
169
19
2
2
1
2
1
1
75
84
1
1
58
2
22
1
56
170
18
1
2
1
1
1
2
80
97
1
1
59
2
21
1
50
170
19
2
3
1
1
1
1
80
81
1
1
60
2
23
1
58
163
19
2
3
1
1
1
1
81
98
1
1
61
2
24
1
58
160
23
2
1
1
1
1
1
83
108
1
1
62
2
22
1
59
170
20
2
1
1
1
1
1
85
99
1
1
63
2
23
1
60
172
20
2
3
1
1
1
1
82
118
1
1
64
2
26
2
49
162
19
2
2
1
1
2
1
85
119
2
2
Umur TKBM * Low Back Pain
Crosstabs
Case Processing Summary
Cases
Valid Missing Total
N Percent N Percent N Percent
Umurk * Low Back Pain 64 54.2% 54 45.8% 118 100.0%
Umurk * Low Back Pain Crosstabulation
Low Back Pain
Total
Case Control
Umurk 1 Count 14 24 38
% within Umurk 36.8% 63.2% 100.0%
% within Low Back Pain 43.8% 75.0% 59.4%
% of Total 21.9% 37.5% 59.4%
2 Count 18 8 26
% within Umurk 69.2% 30.8% 100.0%
% within Low Back Pain 56.2% 25.0% 40.6%
% of Total 28.1% 12.5% 40.6%
Total Count 32 32 64
% within Umurk 50.0% 50.0% 100.0%
% within Low Back Pain 100.0% 100.0% 100.0%
% of Total 50.0% 50.0% 100.0%
Risk Estimate
Value
95% Confidence Interval
Lower Upper
Odds Ratio for Umurk (1 / 2) .259 .090 .750
For cohort Low Back Pain =
For cohort Low Back Pain =
Control 2.053 1.098 3.837
N of Valid Cases 64
IMT TKBM * Low Back Pain
Crosstabs
Case Processing Summary
Cases
Valid Missing Total
N Percent N Percent N Percent
IMTK * Low Back Pain 64 54.2% 54 45.8% 118 100.0%
IMTK * Low Back Pain Crosstabulation
Low Back Pain
Total
Case Control
IMTK < 18.4 Count 1 3 4
% within IMTK 25.0% 75.0% 100.0%
% within Low Back Pain 3.1% 9.4% 6.2%
% of Total 1.6% 4.7% 6.2%
18.5 - 25.0 Count 31 29 60
% within IMTK 51.7% 48.3% 100.0%
% within Low Back Pain 96.9% 90.6% 93.8%
% of Total 48.4% 45.3% 93.8%
Total Count 32 32 64
% within IMTK 50.0% 50.0% 100.0%
% within Low Back Pain 100.0% 100.0% 100.0%
Risk Estimate
Value
95% Confidence Interval
Lower Upper
Odds Ratio for IMTK (< 18.4
/ 18.5 - 25.0) .312 .031 3.170
For cohort Low Back Pain = Case
.484 .087 2.689
For cohort Low Back Pain =
Control 1.552 .832 2.894
N of Valid Cases 64
Masa Kerja TKBM *Low Back Pain
Crosstabs
Case Processing Summary
Cases
Valid Missing Total
N Percent N Percent N Percent
Masak * Low Back Pain 64 54.2% 54 45.8% 118 100.0%
Chi-Square Tests Value Df Asymp. Sig. (2-sided) Exact Sig. (2-sided) Exact Sig.
(1-sided) Point Probability
Pearson Chi-Square 1.067a 1 .302 .613 .306
Continuity Correctionb .267 1 .606
Likelihood Ratio 1.113 1 .291 .613 .306
Fisher's Exact Test .613 .306
Linear-by-Linear Association 1.050c 1 .306 .613 .306 .250
N of Valid Cases 64
a. 2 cells (50.0%) have expected count less than 5. The minimum expected count is 2.00. b. Computed only for a 2x2 table
Masak * Low Back Pain Crosstabulation
Low Back Pain
Total
Case Control
Masak <4 Count 7 17 24
% within Masak 29.2% 70.8% 100.0%
% within Low Back Pain 21.9% 53.1% 37.5%
% of Total 10.9% 26.6% 37.5%
>4 Count 25 15 40
% within Masak 62.5% 37.5% 100.0%
% within Low Back Pain 78.1% 46.9% 62.5%
% of Total 39.1% 23.4% 62.5%
Total Count 32 32 64
% within Masak 50.0% 50.0% 100.0%
% within Low Back Pain 100.0% 100.0% 100.0%
% of Total 50.0% 50.0% 100.0% Chi-Square Tests Value Df Asymp. Sig. (2-sided) Exact Sig. (2-sided) Exact Sig.
(1-sided) Point Probability
Pearson Chi-Square 6.667a 1 .010 .019 .010
Continuity Correctionb 5.400 1 .020
Likelihood Ratio 6.823 1 .009 .019 .010
Fisher's Exact Test .019 .010
Linear-by-Linear Association 6.562c 1 .010 .019 .010 .008
N of Valid Cases 64
a. 0 cells (.0%) have expected count less than 5. The minimum expected count is 12.00. b. Computed only for a 2x2 table
Risk Estimate
Value
95% Confidence Interval
Lower Upper
Odds Ratio for Masak (<4 /
>4) .247 .083 .734
For cohort Low Back Pain =
Case .467 .239 .910
For cohort Low Back Pain =
Control 1.889 1.174 3.038
N of Valid Cases 64
Kebiasaan Merokok TKBM * Low Back Pain
Crosstabs
Case Processing Summary
Cases
Valid Missing Total
N Percent N Percent N Percent
Rokok * Low Back Pain 64 54.2% 54 45.8% 118 100.0%
Rokok * Low Back Pain Crosstabulation
Low Back Pain
Total
Case Control
Rokok Ya Count 28 29 57
% within Rokok 49.1% 50.9% 100.0%
% within Low Back Pain 87.5% 90.6% 89.1%
% of Total 43.8% 45.3% 89.1%
Tidak Count 4 3 7
% within Rokok 57.1% 42.9% 100.0%
% within Low Back Pain 12.5% 9.4% 10.9%
Total Count 32 32 64
% within Rokok 50.0% 50.0% 100.0%
% within Low Back Pain 100.0% 100.0% 100.0%
% of Total 50.0% 50.0% 100.0%
Risk Estimate
Value
95% Confidence Interval
Lower Upper
Odds Ratio for Rokok (Ya /
Tidak) .724 .148 3.531
For cohort Low Back Pain =
Case .860 .430 1.720
For cohort Low Back Pain =
Control 1.187 .486 2.898 N of Valid Cases 64 Chi-Square Tests Value Df Asymp. Sig. (2-sided) Exact Sig. (2-sided) Exact Sig.
(1-sided) Point Probability
Pearson Chi-Square .160a 1 .689 1.000 .500
Continuity Correctionb .000 1 1.000
Likelihood Ratio .161 1 .688 1.000 .500
Fisher's Exact Test 1.000 .500
Linear-by-Linear Association .158c 1 .691 1.000 .500 .287
N of Valid Cases 64
a. 2 cells (50.0%) have expected count less than 5. The minimum expected count is 3.50. b. Computed only for a 2x2 table
Kebiasaan Olahraga TKBM * Low Back Pain
Crosstabs
Case Processing Summary
Cases
Valid Missing Total
N Percent N Percent N Percent
Olahraga * Low Back Pain 64 54.2% 54 45.8% 118 100.0%
Olahraga * Low Back Pain Crosstabulation
Low Back Pain
Total
Case Control
Olahraga Sering Count 14 24 38
% within Olahraga 36.8% 63.2% 100.0%
% within Low Back Pain 43.8% 75.0% 59.4%
% of Total 21.9% 37.5% 59.4%
Jarang Count 18 8 26
% within Olahraga 69.2% 30.8% 100.0%
% within Low Back Pain 56.2% 25.0% 40.6%
% of Total 28.1% 12.5% 40.6%
Total Count 32 32 64
% within Olahraga 50.0% 50.0% 100.0%
% within Low Back Pain 100.0% 100.0% 100.0%
Chi-Square Tests Value Df Asymp. Sig. (2-sided) Exact Sig. (2-sided) Exact Sig.
(1-sided) Point Probability
Pearson Chi-Square 6.478a 1 .011 .021 .011
Continuity Correctionb 5.247 1 .022
Likelihood Ratio 6.610 1 .010 .021 .011
Fisher's Exact Test .021 .011
Linear-by-Linear Association 6.377c 1 .012 .021 .011 .008
N of Valid Cases 64
a. 0 cells (.0%) have expected count less than 5. The minimum expected count is 13.00. b. Computed only for a 2x2 table
c. The standardized statistic is -2.525.
Risk Estimate
Value
95% Confidence Interval
Lower Upper
Odds Ratio for Olahraga
(Sering / Jarang) .259 .090 .750
For cohort Low Back Pain =
Case .532 .326 .868
For cohort Low Back Pain =
Control 2.053 1.098 3.837
Lama Kerja TKBM * Low Back Pain
Crosstabs
Case Processing Summary
Cases
Valid Missing Total
N Percent N Percent N Percent
Lama * Low Back Pain 64 54.2% 54 45.8% 118 100.0%
Lama * Low Back Pain Crosstabulation
Low Back Pain
Total
Case Control
Lama < 8 jam Count 3 2 5
% within Lama 60.0% 40.0% 100.0%
% within Low Back Pain 9.4% 6.2% 7.8%
% of Total 4.7% 3.1% 7.8%
> 8 jam Count 29 30 59
% within Lama 49.2% 50.8% 100.0%
% within Low Back Pain 90.6% 93.8% 92.2%
% of Total 45.3% 46.9% 92.2%
Total Count 32 32 64
% within Lama 50.0% 50.0% 100.0%
% within Low Back Pain 100.0% 100.0% 100.0%
Risk Estimate
Value
95% Confidence Interval
Lower Upper
Odds Ratio for Lama (< 8
jam / > 8 jam) 1.552 .241 9.974
For cohort Low Back Pain =
Case 1.221 .570 2.614
For cohort Low Back Pain =
Control .787 .261 2.369
N of Valid Cases 64
Beban Kerja TKBM *Low Back Pain
Crosstabs
Case Processing Summary
Cases
Valid Missing Total
N Percent N Percent N Percent
bebankerja * Low Back Pain 64 54.2% 54 45.8% 118 100.0%
Chi-Square Tests Value df Asymp. Sig. (2-sided) Exact Sig. (2-sided) Exact Sig.
(1-sided) Point Probability
Pearson Chi-Square .217a 1 .641 1.000 .500
Continuity Correctionb .000 1 1.000
Likelihood Ratio .218 1 .640 1.000 .500
Fisher's Exact Test 1.000 .500
Linear-by-Linear Association .214c 1 .644 1.000 .500 .323
N of Valid Cases 64
a. 2 cells (50.0%) have expected count less than 5. The minimum expected count is 2.50. b. Computed only for a 2x2 table
bebankerja * Low Back Pain Crosstabulation
Low Back Pain
Total
Case Control
bebankerja Ringan Count 9 18 27
% within bebankerja 33.3% 66.7% 100.0%
% within Low Back Pain 28.1% 56.2% 42.2%
% of Total 14.1% 28.1% 42.2%
Sedang Count 23 14 37
% within bebankerja 62.2% 37.8% 100.0%
% within Low Back Pain 71.9% 43.8% 57.8%
% of Total 35.9% 21.9% 57.8%
Total Count 32 32 64
% within bebankerja 50.0% 50.0% 100.0%
% within Low Back Pain 100.0% 100.0% 100.0%
% of Total 50.0% 50.0% 100.0% Chi-Square Tests Value Df Asymp. Sig. (2-sided) Exact Sig. (2-sided) Exact Sig.
(1-sided) Point Probability
Pearson Chi-Square 5.189a 1 .023 .042 .021
Continuity Correctionb 4.100 1 .043
Likelihood Ratio 5.269 1 .022 .042 .021
Fisher's Exact Test .042 .021
Linear-by-Linear Association 5.108c 1 .024 .042 .021 .016
N of Valid Cases 64
a. 0 cells (.0%) have expected count less than 5. The minimum expected count is 13.50. b. Computed only for a 2x2 table
Risk Estimate
Value
95% Confidence Interval
Lower Upper
Odds Ratio for bebankerja
(Ringan / sedang) .304 .108 .861
For cohort Low Back Pain =
Case .536 .297 .967
For cohort Low Back Pain =
Control 1.762 1.078 2.881
N of Valid Cases 64
Sikap Kerja TKBM * Low Back Pain
Crosstabs
Case Processing Summary
Cases
Valid Missing Total
N Percent N Percent N Percent
Sikap * Low Back Pain 64 54.2% 54 45.8% 118 100.0%
Sikap * Low Back Pain Crosstabulation
Low Back Pain
Total
Case Control
Sikap sedang Count 15 24 39
% within Sikap 38.5% 61.5% 100.0%
% within Low Back Pain 46.9% 75.0% 60.9%
% of Total 23.4% 37.5% 60.9%
tinggi Count 17 8 25
% within Sikap 68.0% 32.0% 100.0%
% of Total 26.6% 12.5% 39.1%
Total Count 32 32 64
% within Sikap 50.0% 50.0% 100.0%
% within Low Back Pain 100.0% 100.0% 100.0%
% of Total 50.0% 50.0% 100.0%
Risk Estimate
Value
95% Confidence Interval
Lower Upper
Odds Ratio for Sikap (sedang / tinggi)
.294 .102 .848
For cohort Low Back Pain =
Case .566 .350 .914
For cohort Low Back Pain =
Control 1.923 1.031 3.585