Journal of Economics and Behavioral Studies Vol. 6, No. 2, pp. 152-162, Feb 2014 (ISSN: 2220-6140)
Human Resources Development and Performance of Government Provincial Employees:
A Study in North Sumatera, Indonesia
Iskandar Muda1, *Ahmad Rafiki2
1University of North Sumatera, Sumatera Utara, Indonesia 2Islamic Science University of Malaysia, Negeri Sembilan, Malaysia
Abstract: This study aims to analyze the factors associated with human resource development that probably influence employee's performance. They include the recruitment process, general and specific training, compensation, career development, job promotion and mutations. The assessment is laid out towards achieving a good government of the North Sumatera Province. Furthermore, it plans to look at the most crucial factors affecting the performance. A total of 119 respondents (officers of government civil servants) were chosen using a purposive random sampling technique. All eight independent variables and one dependent variable are tested using the multiple linear regression model. As both primary and secondary data are collected and examined, it is concluded that elements of human resource development simultaneously influence employee performance. This leads to the suggestion that effort has to be made in fostering the improvement in administration duties as well as the encouragement on human resources development consistently.
Keywords: Human Resource Development, Employees’ Performance, Good Governance
1. Introduction
In these times of intense global competition and rivalry, the human resource considered as one of the most important factors used to enter or even manage to dominate the market (Byrne,1995). This kind of resource plays a crucial role to maintain the organizations’ sustainability, credibility as well as creation of public trust. There is a wide range of evidence explored on the positive linkage between the human resource development and organizational performance, due to the aspiration to achieve business excellence and better profits. The emphasis on human resources as a valuable capital in organizations reflect their expectations to stress more on the intangible resources rather than tangible ones. It has been agreed by (Becker, 1964) that human capital investment seeks to gain profitable return either in short or long-term period. The possession of skills and capabilities by the employees would encourage them to learn and build a supportive business environment. The human resource used significantly as a mover to other resources and has a strategic position that crucially contributes to busines performance as the competitive advantage (Wright et al., 2005). Paul and Anantharaman (2003) have asserted that the focus on human resource development has an indirect relationship with the profitability of the organizations. Hence, any organizations propose to optimize the performance of their employees in providing optimal contribution, among others by means of conducting training and development programmes. This also relates to the organizations’ productivity whereby, it may be able to improve the effectiveness and efficiency of work assigned.
2. Literature Review
Human Resources Development and Organization Performance: Watkins (1991) defines the human resource development as “the field of study and practice responsible for the fostering of a long-term, work-related learning capacity at the individual, group, and organizational level of organizations. The organization needs to enhance individuals’ capacity to learn, to help groups overcome barriers, and to help in creation a culture which promotes continuous learning” (p. 253). This definition is associated with the human capital theory posited by Schultz (1993) that the factors of knowledge and skills acquired during education and training would resulted positive return to the orgnizations. While, Garavan et al. (2001) further been described that human capitals are useful for the organization due to the four key attributes, namely; (i) flexibility and adaptability; (ii) enhancement of individual; (iii) competencies; (iv) the development of organizational competencies; and (v) individual employability. Seleim et al. (2007) agreed that human capital positively related to organizational performance. As such human resource development significantly impact the improvement of self-ability of employees towards accomplishing the companies’ duties and goals.
The organisational performance is used as a sign of the capacity of a company to achieve independent goals efficiently (Venkatraman & Ramanujam, 1986). It is widely accepted that organizational performance partly depends on the behavior of employees constituted as a source of sustainable competitive advantage (Huselid et al., 1997). These behaviors are molded through the training and development programmes that may be organized by the organizations. Not only behaviors, any organizations are willing to invest in specific programmes that create the abilities to do the tasks effectively. Becker (1964) has asserted that the investment to gain skills and knowledge through training programmes is more important than any concern on the physical capital investment. The studies on the relationship of performance assessment and human resource development have been conducted in many years, among others are Birdi et al. (2008), Delaney & Huselid (1996), Delery & Doty (1996), Huselid et al. (1997), Wood and de Menezes (2008). Other studies have also taken place in several countries such as Korea, New Zealand, Greece and Singapore (Bae and Lawler, 2000; Guthrie, 2001; Vlachos, 2008; Wan et al., 2002). With the emergence of the information age in the last decades, it becomes clear that traditional financial statements are considered insufficient to provide an accurate assessment of a company’s value. There are factors associated with human resource development which are assumed to have an effect on the employees’ performance, as posited by Gomez-Mejia et al. (1998) namely the recruitment process, managing dismissal (mutations), proficiency assessment, rewards (job promotions), compensation; training and development (Yang & Lin, 2009). All of these elements will be discussed in the following sections.
Factor Associated on Performance Assessment
Recruitment: The recruitment process is related to an action of searching for qualified employees to fill in the vacancies or to hold any available positions. Having the right and capable person is not an easy task which will indirectly affect the performance of organization. The adoption of a reliable recruitment system is considered as the starting point in human resource development. It includes the concern on education and skills’ requirements and expectations, and it has to suit the policies and procedures designed in line with the organization climates. This has been agreed by Terpstra and Rozell (1993) who examine the extensiveness of recruiting, the selection of the test validation, the use of formal selection procedures where they find the positive connectivity between organizational profits and selectivity in staffing, thereby leading to a greater extent of organizational performance (Becker et al., 2001). Thus, this variable will probably have an impact on the employees’ performance.
Both education and training (training) are considered as an integral part of personnel administration, which in turn contribute to the state administration, task-oriented implementation, improved productivity and increased ability as well as dedication as the public servants. The training programmes initiated consist of general and specific training provided to all the government civil servants. This continously offered to increase the officers’ quality, skills and ability. As stated in a Government Act No. 14/1999, the officers of government services have the options to attend specific training based on structural, functional and technical aspects. Marsono (2002, p.37) points out that the specific training is offered according to the rank and position of the officers, whether they are suitable for structural or technical type of training. In fact, the structural and technical specific training is a prerequisite for the government civil servants to take on functional positions. Both types of training provide skills and knowledge and gradually serve as technical mastery that enable employees to carry out the given duties and responsibilities. All of these are important for producing qualified officers and their organization by emphasizing on improving work productivity.
Promotion and Career Development: The promotional opportunities in an organization can occur due to vacancies, both in terms of ranks and positions. The rank vacancies arise in the employment system as the rating point system, while the vacancies in positions (job) are commonly based on the staffing system of job classification, and this is widely adopted within the enterprises. Hence, the promotion denotes a movement from a position to another position which has a higher status whereby the new position offers higher salaries than the former one. This is asserted by Moenir (1995) who states that a promotion is the changing of position, from one post to another and is evaluated based on the level of responsibility, work requirements or incomes. Moreover, a job promotion is a way to develop an employee’s career. The development of career influences the morale of employee and encourages the passion to move forward shown from the better performance that have been demonstrated. It would also enhance the responsibility to implement the employees’ tasks more efficiently and effectively. Hasibuan (2006, p.12) states that there are three bases of promotion namely; the basis of experience (seniority); skills (ability); and a combination of experiences and skills. Meanwhile, as the government civil servants, Thoha (2007, p.57) asserts that the promotion must meet the specified requirements according to personnel administrations’ regulations, among others; (i) the rank/class that has been qualified; (ii) disciplines or formal educational background; (iii) better performance/achievement; (iv) and that the employee has attended structural or functional specific training at any point in his or her career.
Moreover, Winardi (2000) adds that the promotion is timely when it comes with several informative aspects such as work performance, workers ability and the period of the service. Meanwhile, Nitisemito (1997) has added that the requirements that need to be met by an employee to obtain job promotion include; experience, level of education, loyalty, responsibility, related-skills, work performance, initiative and creativity. Moenir (1995) proposes several reasons why promotion should be upheld in organizations; (i) promotion is another career phase that can increase employees’ personal satisfaction and pride; (ii) it refers to the experiences and new knowledge gained by employees and which become a driving force for other employees; (iii) it can reduce the number of employee turnover; and (iv) it can raise employees’ morale in the achievement of organizational goals. Thus, both variables have assumed to have an influence on the employees’ performance.
Compensation (Benefits): The compensation refers to a form of financial returns or tangible benefits that employee receives as part of the employment relationship or contract (Bernadin, 2007). This would create the supposed motivation and provide employees the right career path in accordance to their key performance index. It is divided into two types that consist of cash compensation which is the direct pay provided by employer for work performed by the employee; and fringe compensation which refers to employee benefit programs. Among the legal required benefit programmes are the social security, workers’ compensation, while discretional programmes comprise of health benefits, pension plans, paid time off, tuition reimbursement, recognition award, foreign service premiums, responsibility allowance, child care, promotion and annual increment (Cascio, 2003; Bernadin, 2007). Meanwhile, Gerhart & Milkovich (1990) and Weitzman & Kruse (1990) identify the links between incentive compensation schemes and productivity. Thus, this factor probably has an effect on the employees’ performance.
Conceptual Framework: The human resources are considered as the most important asset for an organization. It is likely known as a valuable stock which is difficult to imitate, whereas other resources such as equipment and advanced technology or physical facilities may be bought and copied by competitors. Both act as supporting resources and are not sustainably competitive in the long run. Thus, the organizations must equip the employees wtih skills and knowledge, and for the government, it needs to conduct regular training and development as a compulsory option. The question arisen is, do the training and development programmes have an impact on good and reliable governance? There are factors of human resources’ influence on the performance that need to be analyzed. Figure 1 below sheds light on the conceptual framework of this study:
Figure 1: Conceptual Framework
Hypothesis: Based on the above conceptual framework, the proposed hypothesis is: "The elements of human resources consist of recruitment, training, career development, compensation, promotion, mutation, training and technical training structural have a considerable effect on employee performance which gives an implication towards the creation of good and credible governance”.
3.Methodology
Research Design: This is a survey research with a sample size of 119 rspondents determined by the purposive random sampling technique. It has both primary and secondary data. The primary data gathered by the distribution of qustionnaire were from 12 secretarial offices, 12 government-link agencies, 20 departmental offices, 4 representative offices. Meanwhile, the secondary data are based on the government office databases.
General Training (X2)
Employees Performance (Y) Recruitment (X1)
Compensation (X4)
Promotion (X5) Career Development (X3)
Mutation (X6)
Structural Specific-Training (X7)
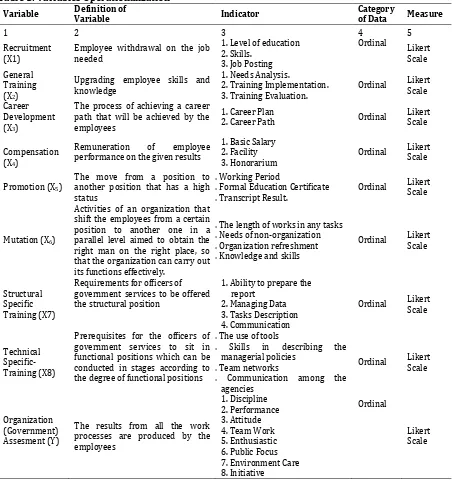
Research Variables: The dependent variable of this study is the performance of employee (Y), while the independent variables consist of recruitment (X1), general training (X2), career development (X3), compensation (X4), promotion (X5), mutation (X6), structural specific-training (X7) and technical specific-training (X8). Table 1 presents the operationalization of the variables concerned.
Table 1: Variables Operationalization
Activities of an organization that shift the employees from a certain
1. The length of works in any tasks 2. Needs of non-organization approaches; descriptive and multiple regression analyses. In addition to both analyses, the data tabulation was done on human characteristics at the Provincial Government of North Sumatra. The formula of a multiple liner regression model is given below:
Y = b0 +b1X 1+ b2X 2+ b3X 3+ b4X 4+ b5X 5+ b6X 6+ b7X 7+ b8X 8+e Y = Organization Performance (Good and Credible Government)
X 1 = Recruitment X6 = Mutation
X 2 = General Training X7 = Structural Specific-Training X3 = Career Development X8 = Technical Specific-Training
X4 = Compensation B0 = Intercept Y
X5 = Promotion B = Coefficient Variable X
Use of the multiple regression analysis is to test the significance level with the criteria of simultaneous hypothesis testing on the independent variables. The effect of independent variables on the dependent variable is tested with a level of confidence (95% or = 0.05 level). The classical assumption tests of normality, heteroscedasticity and multicollinearity are conducted as shall be found in the next sections.
Respondent Characteristics: As depicted in Table 2, it summarizes the respondents’ characteristics based on gender, work period, age and education level.
Tabel 2: Respondent Characteristics Respondent Characteristics
Based on Gender
Gender Type Frequency Percentage
Male 49 41.18%
Female 70 58.82%
Total 119 100 %
Based on Working Period
Working Period Frequency Persentage
< 6 Months 0 0 %
6-12 Months 0 0 %
1-1.5 Years 0 0 %
>2 Years 119 100 %
Total 119 100 %
Based on Age Category
20-30 Years 10 8.40%
31-40 Years 24 20.17%
41-50 Years 74 62.18%
51-55 Years 11 9.24%
Total 119 100.00%
Based on Education Level
Diploma 14 11.76%
Bachelor Degree 85 71.43%
Master and PhD 20 16.81%
Total 119 100%
4. Findings
Validity and Reliability Analysis: The validity analysis in this research is determined through an accurate measurement process. Reliability is a tool used to measure the items in a questionnaire which act as the indicators of the variables or constructs. Based on the data collected from 119 respondents, the variable Y with eight questions indicated in the Corrected Item-Total Correlation (r) column is all larger than the r table, where r table is 0.180 (119-2 = 117), thus the eight items (X1, X2, X3, X4, X5, X6, X7, X8) are declared as valid questions. In the meantime, a reliable construct or variable is present if it provides a value of Cronbach Alpha > 0,60. Based on the results of the reliability test on the variable of Y against the eight items of the questions, a Cronbach's Alpha of 0.872 or 87.2% is obtained, thus all questions related to Y are reliable. For the reliability test of variable X1 the Cronbach's Alpha obtained is 0.910 or 91%, thus all the five questions related to X1 are reliable. Furthermore, the reliability test result for X2 found a Cronbach's Alpha of 0.719 or 71.9%, thus the four questions related to X2 are reliable. For the variable of X3, the reliability test found a Cronbach's Alpha of 0.607 or 60.7%, thus the three questions related to X3 are reliable. Similarly, with the result for variable of X4 a Cronbach's Alpha of 0.853 or 85.3% was obtained, which indicates that the five questions associated with X4 are reliable. For the variable of X5, the reliability test result found a Cronbach's Alpha of 0.822 or 82.2%, hence the four questions related to X5 are reliable. The results of reliability test for X6 obtained a Cronbach's Alpha of 0.800 or 80.0%, thus the four questions associated with X6 are reliable. For variable X7, the reliability test result had found a Cronbach's Alpha of 0.627 or 62.7%, hence the three questions related to X7 are reliable. Lastly, the reliability test result for the variable of X8 obtained a Cronbach's Alpha of 0.729 or 72.9%, thus, the three questions related to X8 are reliable.
Table 3: Descriptive Statistics
Variables N Minimum Maximum Mean Std. Deviation
X1 119 6.00 25.00 21.5798 3.78779
X2 119 10.00 20.00 16.1513 2.33121
X3 119 4.00 10.00 7.5798 1.68491
X4 119 5.00 25.00 15.9832 4.26452
X5 119 7.00 20.00 15.7059 2.58533
X6 119 4.00 20.00 14.2773 2.93409
X7 119 4.00 15.00 11.8067 1.85160
X8 119 9.00 15.00 12.4706 1.59885
Y 119 20.00 40.00 32.9076 4.15176
Valid N (listwise) 119
The Significance of The Model
Normality Test: The normality test aims to see whether the dependent and independent variables in the regression model are both distributed normally or otherwise. Ghozali (2005) states that the normality can be seen on the data distribution when the curve does not pass through either the left or the right. As depicted in Figure 2, it shows that the data output is normally distributed.
Figure 2: Normal Distribution of the Model
Multicolinearity Test: The test for multicollinearity is to see whether the regression model has a correlation between independent variables. Menard (1995) points out that a tolerance value of less than 0.1 indicates a serious collinearity problem. Additionally, a VIF value greater than 10 is cause for concern (Myers, 1990). For this model as depicted in Table 4, the VIF values are all well below 10 and the tolerance statistics well above 0.6. Therefore it is safe to conclude that there is no collinearity within the data in the study.
Table 4: Multicollinearity Test Coefficientsa
Model
Collinearity Statistics Tolerance VIF
1 X1 .746 1.340
X2 .608 1.646
X3 .613 1.631
X4 .850 1.176
X5 .745 1.343
X6 .883 1.132
X7 .708 1.412
X8 .745 1.342
Heteroskedastisity Test: The heteroscedastisity test can be done by looking at the scatterplot graphs presented in Figure 3 below. It shows that the dots spread randomly do not form any specific pattern which is clearly well dispersed above and below zero on the Y axis, where this means that the heteroscedasticity in the regression models is not incurred.
Figure 3: Scatterplot Graphic
Hypothesis Test: The result of the hypothesis test shows that all eight variables are partically and simultaneously affecting the dependent variable of Y, thus it is acceptable. As depicted in Table 4.3, the Adjusted R Square value is 0.335. The result has indicated that 33.5% of the variables X1, X2, X3, X4, X5, X6, X7 and X8 partially and simultaneously give an impact to the dependent variable of Y, while the remaining of 66.5% are influenced by other variables.
Table 5: Model - Goodness of Fit Model Summaryb
R R Square Adjusted R Square Std. Error of the Estimate
1 .616a .380 .335 3.38656
a. Predictors: (Constant), X8, X4, X6, X7, X1, X3, X5, X2 b. Dependent Variable: Y
To examine whether the value of Adjusted R2 coefficient has a significant relationship or otherwise, it is then suggested to run the Fisher's statistical test (F Test) with a level of confidence by 95%. This method dictates that, when the F > Ftable , then Ho is rejected, and if F ≤ Ftable then Ho is acceptable. Table 5 presents the summary of the test whereby it shows that the value of F is 8419 at a significance level of 0.000. Meanwhile, Ftable with 95% confidence level ( = 0.05) was 2.02. Therefore, in both the calculations F> F (8419> 2.52). This suggests that the variables X1, X2, X3, X4, X5, X6, X7 and X8, partially and simultaneously have an effect on Y, thus it is acceptable.
Tabel 6: F Test ANOVAa
Model Sum of Squares df Mean Square F Sig.
1
Regression 772.415 8 96.552 8.419 .000b
Residual 1261.569 110 11.469
Total 2033.983 118
a. Dependent Variable: Y
b. Predictors: (Constant), X8, X4, X6, X7, X1, X3, X5, X2
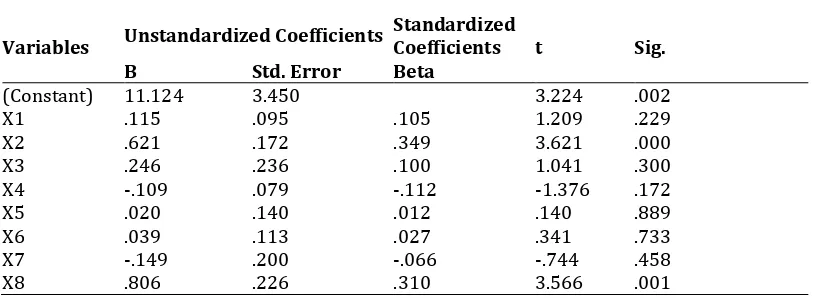
Meanwhile, other variables of X1, X3, X4, X5, X6, and X7 with ttable at 95% confidence level are below the rate ttable of 1.955. Since t < ttable then Ho is accepted.
Table 7: Result of t Test Coefficientsa
Variables Unstandardized Coefficients
Standardized
Coefficients t Sig.
B Std. Error Beta
(Constant) 11.124 3.450 3.224 .002
X1 .115 .095 .105 1.209 .229
X2 .621 .172 .349 3.621 .000
X3 .246 .236 .100 1.041 .300
X4 -.109 .079 -.112 -1.376 .172
X5 .020 .140 .012 .140 .889
X6 .039 .113 .027 .341 .733
X7 -.149 .200 -.066 -.744 .458
X8 .806 .226 .310 3.566 .001
5. Conclusion
This study conclude that the elements of human resource development consist of recruitment, training, career development, benefits, promotion, mutation, structural and technical specific training simultaneously have an influence on employee performance which has an impact on the creation of good governance in the North Sumatra province whereby the most dominant factors of human resources affecting employees’ performance are the general training and technical specific training. The findings of this research is aligned with previous studies by Birdi et al. (2008), Delaney and Huselid (1996), Yang and Lin (2009), Wood and de Menezes (2008), Bae and Lawler (2000), Guthrie (2001), Vlachos (2008), Wan et al. (2002) that revealed that human resources development has relationship with organizational performance. However, it could not be generalized due to demographic, cultural and other factors’ differences. Meanwhile, the employees performance in a private sectors may have distinguish orientations compare the public sector as it this study examined the government officers. In accordance with the demands of establishment towards good governance, the government should act to increase the professionalism quality in order to have a competitive edge and uphold the ethics bureaucracy in providing excellence services as desired by the community. Hence, the government needs to foster continuous human development programmes clearly and consistently. This results may be used for reference which show the concern to all the elements of human resource development that need to be improvized included the enhancement on human resource development related-policies and build the awareness among the officers on the importance of self-development programmes such as training that may be able to help them fulfill the duties effectively and efficiently.
Reference
Becker, G. (1964). Human Capital. A Theoretical and Empirical Analysis with Special Reference to Education. 3rd Ed. Chicago and London: University of Chicago Press.
Becker, B. E., Huselid, M. E. & Ulrich, D. (2001). The HR scorecard: Linking people, strategy, and performance. Boston: Harvard Business School Press.
Bernadin, H. J. (2007). Human Resource Management: An exponential approach. 4th ed. NewYork: McGraw-Hill Irwin, 253-277.
Bae, J. & Lawler, J. J. (2000). Organizational and HRM strategies in Korea: impact on firm performance in an emerging economy. Academy of Management Journal, 43, 502-17.
Birdi, K., Clegg, C., Patterson, M., Robinson, A., Stride, C. B., Wall, T. D. & Wood, S. J. (2008). The impact of human resource and operational management practices on company productivity: a longitudinal study. Personnel Psychology, 61, 467-501.
Bartel, A. ( 2004). Human Resource Management and Organizational Performance: Evidence from Retail Banking. Industrial and Labor Relations Review, 57(2), 43-345.
Byrne, D. (1995). Public Sector Reform in Context. Administration, 43 (2), 5 -15.
Delaney, J. T. & Huselid, M. A. (1996). The impact of human resource management practices on perceptions of organizational performance. Academy of Management Journal, 39, 949-69.
Delery, J. E. & Doty, D. H. (1996). Modes of theorizing in strategic human resource management: tests of universalistic, contingency and configurational performance predictions. Academy of Management Journal, 39, 802-35.
Gomez-Mejia, L. R., Balkin, D. B. & Cardy, R. L. (1998). Managing Human Resources. Prentice-Hall, Englewood Cliffs, NJ.
Gerhart, B. & Milkovich, G. T. (1990). Organizational differences in managerial compensation and firm performance. Academy of Management Journal, 33, 663-691.
Garavan, T. N., Morley, M., Gunnigle, P. & Collins, E. (2001). Human Capital accumulation: The role of human resource development. Journal of European Industrial Training, 25(2/3/4), 48-68.
Ghozali, I. (2005). Aplikasi Analisis Multivariate Dengan Program SPSS. Semarang: Badan Penerbit Universitas Diponegoro.
Guthrie, J. P. (2001). High-involvement work practices, turnover and productivity: evidence from New Zealand. Academy of Management Journal, 44, 180-90.
Hasibuan, M. S. P. (2006). Manajemen Sumberdaya Manusia, Edisi Revisi. Jakarta: Penerbit Bumi Akasara. Huselid, M. A., Jackson, S. E. & Schuler, R. S. (1997). Technical and strategic human resource management effectiveness as determinants of firm performance. Academy of Management Journal, 40(1), 171– 88. http://dx.doi.org/10.2307/257025
Marsono, L. (2002). Pelaksanaan Pengembangan Pegawai di Dinas Energi dan Sumber Daya Mineral Provinsi Sulawesi Selatan.repository.unhas.ac.id
Menard, S. (1995). Applied Logistic Regression Analysis. London: Sage.
Moenir, A. S. (1995). Manajemen Pelayanan Umum Indonesia. Jakarta: Bumi Aksara.
Myers, R. H. (1990). Classical and Modern Regression with Applications. PWS-Kent Publishing Company. Nitisemito, S. (1997). Pengembangan Sumber Daya Manusia, Jakarta: Balai Pustaka.
Prajogo, D. I. (2007). The relationship between competitive strategies and product quality. Industrial Management & Data Systems, 107(1), 69–83. http://dx.doi.org/10.1108/02635570710719061 Patrick, J. (2000). Training. In N. Chmiel (Ed.), Introduction to work and organizational psychology (100–
125). Oxford, UK: Blackwell.
Peterson, W., Gijsbers, G. & Wilks, M. (2003). An Organizational Performance Assessment System for Agricultural Research Organizations: Concepts, Methods and Procedures. ISNAR (International Service for National Agricultural Research) Research Management Guidelines No. 7, The Hague: ISNAR.
Paul, A. K. & Anantharaman, R. N. (2003). Impact of people management practices on organizational performance: analysis of a causal model. International Journal of Human Resource Management, 14(7), 1246-1266.
Russell, J. S., Terborg, J. R. & Powers, M. L. (1985). Organizational performance and organizational level training and support. Personnel Psychology, 38, 849-863.
Schultz, T. W. (1993). The economic importance of human capital in modernization. Education Economics, 1(1), 13-19.
Siagian, S. P. (2001). Manajemen Sumber Daya Manusia. Jakarta: Bumi Aksara.
Siagian, S. P. (2006). Manajemen Sumber Daya Manusia. Jakarta: Penerbit PT. Bumi Aksara.
Seleim, A., Ashour, A. & Bontis, N. (2007). Human capital and organizational performance: A study of Egyptian software companies. Management Decision, 45(4), 789-801.
Terpstra, D. E. & Rozell, E. J. (1993). The relationship of staffing practices to organizational level measures of performance. Personnel Psychology, 46, 27-48.
Thoha, M. (2007). Perilaku Organisasi, Konsep Dasar dan Aplikasinya. Jakarta: PT. Raja Grafindo Persada. Vlachos, I. (2008). The effect of human resource practices on organizational performance: evidence from
Greece. The International Journal of Human Resource Management, 19(1), 74-97.
Venkatraman, N. & Ramanujam, V. (1986). Measurement of business economic performance: an examination of method convergence. Journal of management Development, 13(1), 109–22. Wan, D., Kok, V. & Ong, C. H. (2002). Strategic human resource management and organizational
performance in Singapore. Compensation and Benefits Review, 34, 33-42. Winardi, L. (2000). Kepemimpinan dalam Manajemen. Jakarta: PT. Rhineka Cipta.
Weitzman, M. L. & Kruse, D. L. (1990). Profit sharing and productivity. In A.S. Blinder (Ed.) Paying for productivity: 95-141. Washington DC: Brookings Institution.
Watkins, K. E. (1991). Many voices: Defining human resource development from different disciplines. Adult Education Quarterly, 41(4), 241–255.
Wright, P., Gardner, T., Moynihan, L. & Allen, M. (2005). The relationship between HR practices and firm performance: examining causal order. Personnel Psychology, 58, 409-446.