CHAPTER III
RESEARCH METHODOLOGY
Research method which covers research type, research design, place of the
study, variable of study, population and sample of the study, Research Instrument,
Research Instrument Reliability, Data Collection Procedures, and Data Analysis.
A. Research Type
This study was classified into quantitative research. Quantitative research
deals with question of relationship, cause and effect, or current status that writer
can answer by gathering and statistically analyzing numeric data. It can be
further classified as experimental and non-experimental.1
B. Research Design
The design of the study was experimental design used quasi-experimental
design. Experimental design is a plan for an experiment that specifies the applied
independent variables, the number of levels of each, how subject are assigned to
groups, and the dependent variable. The writer used quasi- experimental design
since it is not possible to randomly assign subjects to treatment group.
In this study, there were two classes. The first class is control group (CP).
The second class is experiment group (EG) group which apply Four Square
1
technique. Groups were given pre-test and post-test to measure the result of the
students’ writing scores.
The treatment is given to the experiment group only. The description of
the experiment is in the table below:
Table 3.1 The Description of Quasi-Experiment Design
Group Pre-test Treatment Post-test
EG
Y1 X Y2
CG Y1 - Y2
Where:
EG : Experiment Group
CG : Control Group
X : Treatment using Four Square Technique
Y1 : Pre-test
Y2 : Post-test
C. Place of the Study
The place of the study at SMP Muhammadiyah of Palangka Raya on Jalan
RTA. Milono.
D. Variables of the Study
1. Independent variable (X) in this research is the Four Square technique.
2. Dependent variable (Y) in this research is the writing achievement scores.
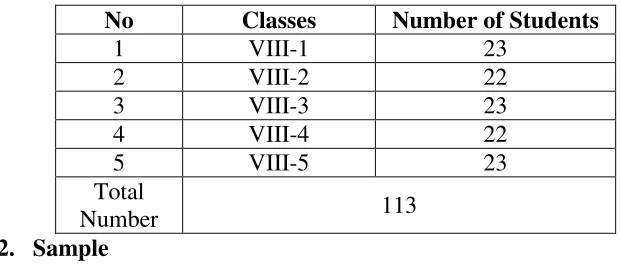
E. Population and Sample of Study 1. Population
Population is the group to which a writer would like to the results of a
study to be able to generalize. In the present study, the population of the study
was all of the eighth grade students at SMP Muhammadiyah Palangka
Raya. Numbers of population were about 113 students. It was classified into
five classes.
Table 3.2 Population of study
No Classes Number of Students
1 VIII-1 23
sample. Cluster sampling is used if the population does not consist of
individuals, but groups or cluster4. The writer determined the two classes into
two groups. They are class VIII-1 which consists of 23 students as
experimental group and class VIII-2 which consists of 22 students as control
group. A total of 45 students in the eighth grade students at SMP
Muhammadiyah Palangka Raya were chosed to be the sample in this study.
Table 3.3 The Sample of Study
No Classes Group Number of Students
1 VIII-1 Experimental Group 23
test, especially writing Descriptive paragraph using Four Square Technique for
experiment class and without using Four Square Technique for control class.
2. Test Construction
The test construction was based on the objective of the study. The
study aimed at found out the effect of used Four Square Technique in writing
descriptive paragraph. To investigated the effect of using Four Square
Technique in writing descriptive paragraph. The subjects were assigning to
4
write Descriptive Paragraph. The result of two test were investigated using
statistical analysis and outcomes were compared to see the effect of using
Four Square Technique the different level of students’ achievement.
To gain the appropriate writing test for the aim of this study, the
researcher did some steps: (a). planning the writing test, (b).prepare the
writing test, (c) pre-test the test and analyze the result, and (d) carry out the
test
3. Research Instrument Validity
Validityis defined as the extent to which an instrument measured what
it claimed to measure. The focus of recent views of validity is not on the
instrument itself but on the interpretation and meaning of the scores derived
from the instrument.
Validity is defined as the extent to which scores on a test enable one to
make meaningful and appropriate interpretations.5
In this study, the validation of instrument is mainly direct to the
content validity. Related to the writing test, the content validity is check by
examining and the test use to measure the objectives. The writer used
inter-rater method. inter –rater is two raters who score the students’ writing to get
5Donald Ary, dkk., Introduction to Research in Education, eight edition, Belmont:
the score compositions as possible. The researcher used product moment
correlation as the formula to calculate the validity from the result.6
Rxy=
Where:
Rxy = index Correlation Number “r” product moment
N = Number of Cases
𝚺XY = Multiplication result between score X and score Y
𝚺X = Total value of score X
𝚺Y = Total value of score Y
Riduwan in Mayasyarah states the criteria of interpretation the validity:7
0.800-1.000= Very high
0.600-0.799= High Validity
0.400-0.599= Fair Validity
0.200-0399= poor validity
6
Anas Sudijno, pengantar Ilmu Statistik Pendidikan, Jakarta: PT. Raja Grafindo Pustaka, 1997, p. 193.
7
Mayasyarah, The Effectiveness of Video Compact Disc as an Audiovisual Medium
0.00-0.199= Very Poor Validity
4. Research Instrument Reliability
Reliability refers to the consistency of test score. It means how consistent
test scores or other evaluation results are from one measurement to another.8 In
rater reliability, there are inter-rater and intra rater reliability. A simple way to
determine the reliability of ratings is to have two or more observers
independently rate the same behaviors and then correlate the observers’ ratings.
The resulting correlation is called the inter-rater.9 Meanwhile intra-rater
reliability referred to consistency of rater in scoring the same paper or two
different point of time. It point out and individual accuracy in scoring a particular
composition.
In this study, the writer used reliability in the terms of inter-rater
reliability. Inter – rater reliability estimates the reliability of two scores which
were gained from two testers, the score has high reliability. The first rater
writer of this study and the second rater the English teacher at SMP
Muhammadiyah of Palangka Raya. To obtain inter-rater reliability; the scores
of the two raters were correlated using SPSS 21.0 program. Then the writer
got the interpretation of coefficient correlation, whether they belong to high,
moderate, or weak positive/negative inter rater reliability category. The obtain
8
WilmarTinambunan, Evaluation of Student Achievement, Jakarta: Depdiknas,1988. p.4.
9
coefficient should indicate that the students writing product both using Four
Square Technique and without Four Square Technique. Calculation result of r
was compare with rtable by 5% degree of significance with df=N-2. If r will
higher than r table so is it meant reliable and if r will lower than rtable so it meant
unreliable The researcher used product moment correlation as the formula to
calculate the validity from the result.10
Rxy=
Where:
Rxy = index Correlation Number “r” product moment
N = Number of Cases
𝚺XY = Multiplication result between score X and score Y
𝚺X = Total value of score X
𝚺Y = Total value of score Y
Riduwan in Mayasyarah states the criteria of interpretation the validity:11
0.800-1.000= Very high
10
Anas Sudijno, pengantar Ilmu Statistik Pendidikan, Jakarta: PT. Raja Grafindo Pustaka, 1997, p. 193.
11
0.600-0.799= High Validity
0.400-0.599= Fair Validity
0.200-0399= poor validity
0.00-0.199= Very Poor Validity
H. Data Collection Procedures
In this study, the writer used some procedures to collect the data. the
procedures consist of some steps as follows:
1. The writer observed to SMP Muhammadiyah Palangka Raya
2. The writer determined the class into experimental group, control group and
try out class.
3. The writer gave the instrument try out the try out class.
4. The writer analyzed the instrument try out to know the quality of the test,
such as instrument validity, instrument reliability.
5. The writer gave pre test to the experimental group and control group.
6. The writer taught experimental group using four square technique.
7. The writer gave post-test to the experimental group and control group.
8. The writer gave scores to the data from the experimental group and control
group.
10.The writer analyzed the data from pre test and post test using t-test.
11.The writer made the interpreted and concluding the result of data analysis.
G. Data Analysis
The data of this study are students’ writing score. Therefore, the data
were quantitative. The pretest and post-test score were converted into
percentages. In order to analyze the data that collected. The mean, standard
deviation and standard error of students’ score computed for the pretest and
post-test scores of the experiment and control groups. The writer used statistical ttest to
answer the problem of the study. In Order to analyze the data, the writer did
some way procedures:
1. Gave and collected the data of students’ score both of pre-test and post- test
the tests at eighth grade students at SMP Muhammadiyah Palangka Raya.
2. Tabulated the students’ score into distribution of frequency in the table, then
found the mean of students’ score, standard deviation, and standard error of
variable X 1 (Experiment Group) and X 2 (Control Group).
3. Normality Test
It is used to know the normality of the data that is going to be analyzed
whether both groups have normal distribution or not. Therefore, the writer
will use SPSS 21.0 program to measure the normality of the data.
It is use to know with experimental group and control group, that were
decided, come from population that has relatively same variant or not. the
writer used SPSS 21.0 program to measure the homogeneity of the data.
5. Calculated the data by used T-test to test the hypothesis of the study, whether
the use four square technique give effect to the students coherence
development of descriptive text score or not. To examine the hypothesis, the
writer use T-test. T-test is statistical test which is use to examine the truth or
falseness of null hypothesizes states that between two of Sample Mean taken
randomly from the same population, there is no significant different.12 T-test
is used to measure whether four square technique give effect to the students
coherence development of descriptive paragraph score using formula as
follows:13
To know the hypothesis is accepted or rejected using the criterion:
If t-test (the value) ≥ ttable, it means Ha is accepted and Ho is rejected.
If t-test (the value) ≤ ttable, it means Ha is rejected and Ho is accepted.
12
Anas Sudijono, Pengantar Statistik Pendidikan, Jakarta: Raja Grafindo Persada, 1987, p.278 13
6. Interpreted the result of t-test. Previously, the writer counts the degrees of
freedom (df) with the formula:14
df = (N1 + N2– 2) Note:
df : degrees of freedom
N1 : Number of subject group 1
N2 : Number of subject group 2
2 : Number of variables
After that, the value of ttest is consulted on the ttable at the level of significance
1% and 5%. In this research, the writer used the level of significance at 5%. If
the result or t-test is higher than ttable, it means Ha is accepted.
7. The writer made the conclusion of data analysis obtained.
8. In addition, the writer used SPSS 21.0 program to compare the data.
9. Discussed and conclude the result of data analysis.
14
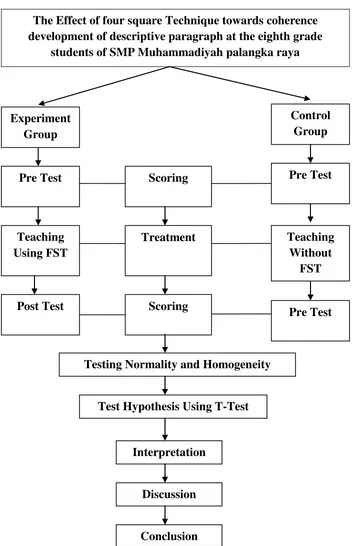
Figure 3.1 Steps in Collecting and Analyzing Data
The Effect of four square Technique towards coherence development of descriptive paragraph at the eighth grade
students of SMP Muhammadiyah palangka raya
Experiment Group
Control Group
Pre Test Scoring Pre Test
Teaching Using FST
Treatment Teaching
Without FST
Post Test Scoring
Pre Test
Testing Normality and Homogeneity
Test Hypothesis Using T-Test
Interpretation
Discussion