Contents list available at IJRED website
Int. Journal of Renewable Energy Development (IJRED)
Journal homepage: www.ijred.com
Evaluation and Modification of Processes for Bioethanol Separation
and Production
Johnner P. Sitompul
a*, Widayat
band Tatang H. Soerawidjaja
a,
a Department of Chemical Engineering, Faculty of Industrial Technology, Institute of Technology Bandung, Jl. Ganesha 10, Bandung, Indonesia, 40132 b Department of Chemical Engineering, Diponegoro University, Jl. Prof Soerdarto SH Tembalang Semarang, Central Java, Indonesia
Article history:
Received December 13, 2011 Received in revised form Jan 23, 2012 Accepted February 11, 2012 Available online
ABSTRACT: This paper concerns on process evaluation and modification for bioethanol separation and production by applying pinch technology. Further, the paper is also focused on obtaining a most energy-efficient process among several processes. Three basic process configurations of bioethanol separation and production were selected for this study. The three separations and production systems are Othmer process, Barbet process and a separation process that operates under vacuum condition. Basically, each process is combination of Danish Distilleries process with a separation system yielding 95% (v/v) bioethanol. The production capacity of the plant is estimated about 4 x 10⁷ litre of bioethanol 95% (v/v) per year. The result of the studies
shows that the most energy efficient process among the three processes evaluated is the Othmer process, followed by the Barbet process and the process involving vacuum operation. The evaluation also shows that further energy saving can be carried for Barbet and Othmer process configuration when Tmin = 10oC for heat exchange possible.
Keywords: Process Evaluation and Modification; Pinch Technology; Bioethanol Separation and Production
* Corresponding author. E-mail: [email protected] and [email protected]
1. Introduction
The energy crisis in the world during 97 ’s decade has driven industries to use energy most efficiently. Hence, most of current research has been focusing in efficient utilization of energy resources such as process retrofitting or modification, invention of renewable and new energy. Further, process design and development as well as modification of process are usually oriented to most-energy efficient with the result of highly integrated processes in acquiring the most energy-efficient process.
Process modification and development usually involve energy optimization such as heat-exchanging energy within the processes and within the process equipment, and further make use of available energy either from reaction or waste heat management. The methodology for process evaluation and discrimination are based on pinch analysis or technology which provides a systematic methodology for energy saving in
processes and whole plant. The pinch technology has been applied for different process industries such as petrochemical industry, pulp and paper, refinery of crude oil, cement industry, food industry, wine and beer and processes of renewable products.
The methodology of pinch technology is based on thermodynamic principles. A pinch analysis starts with the mass and energy of the processes [1, 2]. The sequence advances with design of heat exchanger networks after identification of targets for heat exchange network. These targets can be calculated from the given flow rates or streams, enthalpy and temperature data from the streams defining the heat exchanger network problem. Such targets are [1, 2, 3]
minimum energy (utility) requirements, minimum number of units (matches between streams), minimum number of exchanger shells, and minimum heat exchanger network area.
recently has been developed for heat and power networks in process design, water minimization [2, 4], distillation column integration [5] and overall process design. The tools of pinch technology used in analysing the case are composite curve, grand composite curve, and problem table, matching process, energy and capital targets [1]. In this paper, we concern on evaluating and obtaining the most-energy efficient process for producing and separating bioethanol, a renewable product, from fermentation broth. Among three available commercial processes for bioethanol separation and production, they were evaluated for producing similar product composition with target most energy-efficient one. The problem in bioethanol separation and production is highly intensive energy consumption, with the separation process or plant is the most energy-intensive part, which accounts for more than 50% energy consumption [7]. Hence, evaluation and modification of processes for bioethanol separation and production from fermentation broth is crucial to determine the most energy-efficient one and further to save energy among processes evaluated available in industries.
2. Bioethanol Separation and Production Processes
Ethanol or ethyl alcohol (CH3CH2OH) is also known as bioethanol if produced from biomass or renewable
feedstocks. It is also referred to as alcohol spirit, spirit of wine, grain alcohol, absolute alcohol and ethyl hydrate. Ethanol is an important functional compound of alcoholic beverages, which are produced by fermentation broth of fermentable carbohydrate. Recently, bioethanol or ethanol has become an important alternative to diesel and fuel oil as ethanol can increase octane number in gasoline. Fuel oil with addition of ethanol or bioethanol 10% is popular with gasohol.
Three basic configurations of ethanol separation and production were available in industries and selected for this study. The three separations and production processes are Othmer process, Barbet process and a separation process that operates under vacuum condition. Basically, each process is combination of Danish Distilleries process with a separation system yielding 95% (v/v) bioethanol. The production capacity of the plant is estimated about 4x10⁷ litre of bioethanol 95% (v/v) per year [11].
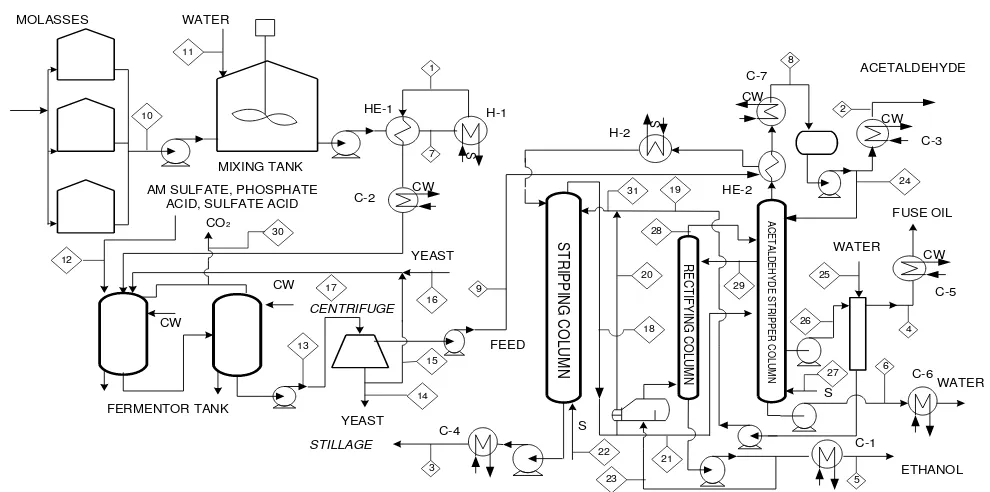
Danish Distilleries process (production plant) is continuous bioethanol fermentation which utilizes continuously stirred tank reactors. The molasses is stored in two or three tanks from which it is pumped to intermediate containers. The material is adjusted for pH and nutrients, sterilized at 100oC by using plate heat exchangers (HE-1) then to reach 100oC heated in heater (H-1).
S
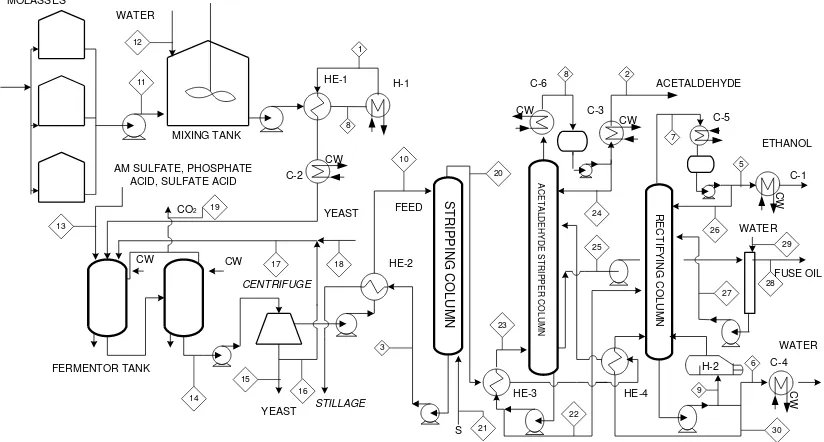
Fig. 2 Flow diagram of basic configuration of process 2
Steam is used as a heating medium in heat exchangers (HE-1) to increase the material after sterilization. Fermentation process is carried out in two or three fomenters, with addition of yeast at concentration 10 g/L. The fermented broth is centrifuged after fermentation, and the live yeast is recycled to the first fermentor. Bioethanol production has concentration 8.4% (volume) [6] and then the stream follows the separation and purification with Othmer process, Barbet process or vacuum distillation process.
Figure 1 is basic process 1, which is a combination of Danish Distilleries process with Barbet process (separation plant). The operation pressure on separation process at process 1 is 1 atmosphere. For all process, steam is used saturated steam at 134oC. The distillation uses open distillation or direct contact between steams with distillation feed. Bioethanol production from Danish distilleries heated in heat exchanger (HE-2), and then continued in heater (H-2) to obtain bubble point condition. The heating medium in heat exchanger (HE-2) is top product of rectifying column. In the stripping column, bioethanol, acetaldehyde, fuse oil and water purge to top product and the stillage as bottom product of stripping column. Furthermore, top product is purifying in purifying column and stripper-rectifier column. The bioethanol 95% (volume) product is taken as a top product of rectifier-stripper column. Acetaldehyde product is taken as a top product of rectifying column and fuse oil is taken as sides draw at rectifying column.
Figure 2 shows basic process 2 which is a combination of Danish Distilleries process (production plant) with Othmer process (separation plant). The operation pressure on separation process at process 1
is 1 atmosphere. Bioethanol production from Danish distilleries is heated in heat exchanger (HE-2), and then continued in heater (H-2) to obtain bubble point condition. The heating medium in heat exchanger (HE-2) is the top product stream of rectifying column. Furthermore, top products of stripping column are separated in purifying column and aldehyde-stripper column. In rectifying column, bioethanol, acetaldehyde, fuse oil vaporizing go to head of the column. Acetaldehyde product is taken as a top product of rectifying column and fuse oil is taken as sides stream at rectifying column. The product alcohol side-stream from rectifier is fed into the plate of the aldehyde column, and in descending, is stripping of volatiles to produce an bioethanol 95% (volume) bottoms product. Aldehyde carrying vapours from the head of aldehyde-stripper are returned to rectifying column.
product of aldehyde-stripper column and fuse oil is taken as sides draw at aldehyde-stripper column. The bottom products of aldehyde-stripper column are
concentrated in rectifying column. Bioethanol is vaporizing to the top of the column while water is withdrawn as bottom product of the rectifying column.
CW
Fig. 3 Flow diagram of basic configuration of process 3
3. Results and Discussion
3.1. Evaluation of Energy Consumption
Before carrying out evaluation, selection of model of phase equilibria to predict bioethanol-water system was conducted. Simulation results showed that Wilson’s model can predict azeotrop point better than NRTL model while Margules model cannot converge to predict the azeotrop point bioethanol-water system with the respective parameters. Hence, Wilson’s model of phase equlibria will be used for evaluation and calculation of bubble point and dew point throughout this study. Further, the phase equilibria model were used to determine the minimum reflux and minimum theoretical plate number and respective bottom and top product composition of all separators.
Energy and mass balances were firstly carried out for all three basic processes by using MATLAB®. The evaluation results are presented in Table 1 belows.
Table 1.
The energy consumption of processes 1, 2 and 3 and that of Kosaric et al. work [6]
Process Energy needs x 10
-6 kJ/h
Kosaric et al. The results of evaluation
1 42.84 21.96 + 24,29*
2 28.21 2.04 + 32.18*
3 20.90 34.81+ 13.12*
Note: *) the later value shows energy consumption used in distillation
or process separarion
The results of this study is compared with that of Kosaric et al. [6] who obtained lower energy consumption. In the Kosaric et al. work, however, less information about ratio reflux, and reflux ratio for process evaluation and they are apparently taken from theoretical tray calculation. The result of these studies shows that the most energy efficient process among the three processes evaluated is the Othmer process, followed by the Barbet process and the process involving vacuum operation, with steam consumption, 3.23, 4.11, 4.79 kg of 3-atm steam/ litre bioethanol, respectively. The differences of steam consumption were caused by using of ratio reflux in rectifying column and aldehyde-stripper column. Hence, the results of evaluation from this study are then used as base case design.
3.2. Evaluation of Energy Consumption by Using Pinch Technology
evaluations are maximum energy recovery (MER), energy of heating and energy of cooling are presented in Table 2. The values on second rows are the evaluation results for process evaluation 1, 2, and 3 without involving re-boiler at rectifying and re-boiler at aldehyde-stripper column. The negative values of efficiency improvement show decrease of maximum energy recovery, MER, if the results process evaluation compared with base case design data.
The process evaluation results of process 1 shows increasing of MER, compared with that of base case design data of process 1. Increasing of maximum energy recovery causes the decreasing of heating adn cooling energy, hence increasing energy efficiency. The results of evaluation process 2 shows that increasing maximum energy recovery achieved when process evaluated without involving re-boiler at aldehyde-stripper column. If process evaluation involves re-boiler at aldehyde-stripper column, the result shows decrease of
maximum energy recovery. The result of evaluation of the process 3 shows that decreases in maximum energy recovery. From the evaluation results, the study proceed to the design of heat exchanger networks of process having increasing or optimum MER.
3.3. Grid Diagram
Grid diagram is the results of matching process of streams in the each process configuration and combining the results of matching process at the above
pinch point and the below pinch point. To match process
streams, it will use the rules of the basis for the network design procedure. The system above the pinch requires a heat input and it is therefore a net heat sink while below the pinch, the system rejects heat and so it is a net heat source.
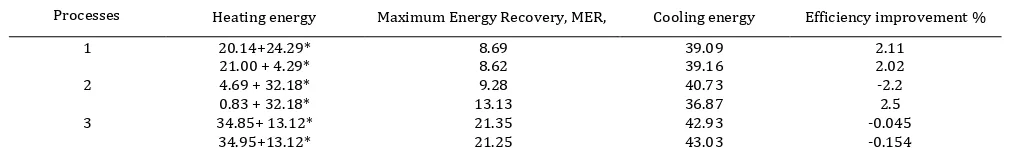
Table 2.
The results of evaluation by using pinch technology about energy consumption 1, 2 and 3 processes (x 10-6 kJ/jam)
Processes Heating energy Maximum Energy Recovery, MER, Cooling energy Efficiency improvement %
1 20.14+24.29*
21.00 + 4.29*
8.69 8.62
39.09 39.16
2.11 2.02
2 4.69 + 32.18*
0.83 + 32.18*
9.28 13.13
40.73 36.87
-2.2 2.5
3 34.85+ 13.12*
34.95+13.12*
21.35 21.25
42.93 43.03
-0.045 -0.154 Note: *) the later value shows energy consumption used in distillation or process separarion
The rules of the basis for the network design procedure are as follows,
There must be no external cooling above the pinch
There must be no external heating below the pinch
There must be no heat across the pinch, i.e., exchange heat from a hot stream above the pinch temperature with heat a cross stream below the pinch temperature [1, 2]
For retrofitting applications the design procedure will
correct the exchangers that are passing the heat across
the pinch [2].
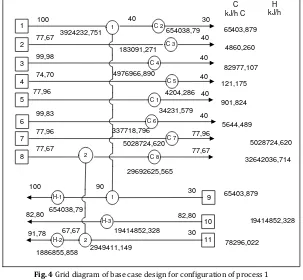
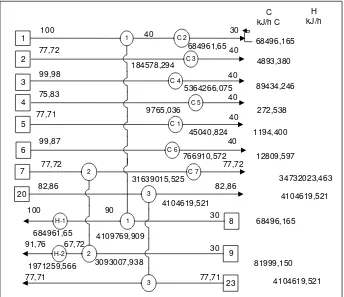
In the grid diagram, hot streams are shown at the top of the figure, from left to right. Cold streams run across the bottom, from right to left. A vertical line joining circles on the two matched streams shows a heat exchanger transferring heat between the process streams. A heater is shown as a circle with a notation H and a cooler is shown as a circle with a notation C. The results of matching process are presented in figure 5, 6 and figure 8. For comparison, figure 4 and figure 7 are heat exchanger networks of base case design of process configuration 1 and 2.
Figure 5 shows heat exchanger networks of process 1 configuration, if process evaluation involving re-boiler at aldehyde-stripper column (H-3). The heat exchangers (HE-2) and (HE-4) are used for transferring heat between the process stream 1 to the process stream 9.
This couple is duty couple because caloric capacity flow rate of second streams are same. Process integration between stream numbers 9 and stream number 1, shows the utilization of heat to sterilize medium fermentation for preheating of fermentation medium. Feed to stripping column is heated consecutively in heat exchanger (HE-3) and (HE-5). Further heating of feed is carried out in the heat exchanger 3 after HE 5. This research obtained more integrated grid diagram that that of base case design for configuration of process 1. The number of heat exchanger used for transferring heat is five, whereas in base case process is two.
Figure 6 displays heat exchanger networks of process 1 configuration whenever process evaluation without involving a reboiler at the aldehyde-stripper column (H-3). The bottom part is heated with saturated steam. There are three heat exchangers used for transferring heat, with two heat exchangers located at the top of pinch or pinch point, and 1 located under the pinch. HE-1 and HE-2 are used for heating fermentation medium, while HE-3 for heating feed stream to the stripping column. In this grid diagram, the feed temperature reached by using stillage before fed to the stripping column, whereas in the base case design by using top product aldehyde-stripper column.
HE-1 and HE-2 are used for heating fermentation medium, while HE-3 for heating feed stream to the stripping column. In this grid diagram, the feed temperature reached by using stillage before fed to the stripping column, whereas in the base case design by using top product aldehyde-stripper column.
Process evaluation of configuration of process 2 shows that increasing energy efficiency if process evaluation without involving reboiler at aldehyde-stripper column (HE-3). Reboiler is heated with a part of top product stripping column. Note that difference temperature in this re-boiler is Tmin= 5.15oC. The
heating may be conducted because this kind of process is applied in Othmer process and analyzed by [10].
The results of matching process are presented in figure 8. The number of heat exchanger used for transferring heat is four. HE-1 and HE-4 are used for transferring heat between stream of sterilized medium fermentation with that of fermentation medium. HE-2 is used for transferring heat between stillage stream with stream fed to stripping column. HE-3 is reboiler at aldehyde-stripper column, that heating use a part of top product stripping column.
C 4
Fig. 4 Grid diagram of base case design for configuration of process 1
4
2
2
30
77,67 40
4 3
11 5
40 99,98
74,7
77,96 40
3 30
4696195,4
C kJ/h C
H kJ/h
3
7 6
8
77,96 40 99,83
77,96
77,67 77,67
89,98
9
2 30
1 1
100
100
H-1 1 89,98
99,98
1308,078
90
78296,022 901,824 121,175 82977,107 4860,260 65403,879
32642036,714 5028724,620 5644,489
65403,879
C 8 C 5
C 2
C 3
C 1
C 6
C 7
43,38 40
183091,271
4204,286
34231,579
337718,796
5028724,620 654038,79
3922924,662
32642036,714
ABOVE PINCH BELOW PINCH
654038,79 91,78
H-2 89,98
140932,8396
PINCH
Fig. 6 Grid diagram for evaluation of process 1 without involving re-boiler at aldehyde-stripper column (H-3)
In the grid diagram of base case design of process 2 configuration, feed to stripping column heated by using enthalpy of top product rectifying column, whereas in the results of evaluation by using stillage (HE-2). The
heat exchangers networks obtained simpler than base case design. The numbers of heat exchangers after evaluation is less than base case design with the number of coolers 7, compared with 8 in the base case.
C 4 C 2
C 5
C 1
1 1
C 3
2
100 30
77,72 40
4 3
9 5
40 40 99,98
75,83
77,71 40
91,76
H-2 2 30
184578,294
5364266,075
9765,036
45040,824
3093007,938 67,72
C kJ/h C
H kJ/h
81999,150 1194,400
272,538 89434,246 4893,380 68496,165
1971259,566
C 6
C 7 2
7 6
77,72 40 99,87
77,72
100
766910,572
34732023,463 12809,597
8
H-1 1 30
90
40
4109769,909
68496,165 684961,65
684961,65
3
20 82,86 82,86 4104619,521
23 77,71
3 77,71
4104619,521
4104619,521 31639015,525
C 2
C 5
C 1 4
C 3
2
99,98 30
77,72 40
4 3
9 5
40 44,99 99,98
75,83
77,71 40
89,98
2 30
184578,294
4918309,017
9765,036
45040,824
C kJ/h C
H kJ/h
81999,150 1194,400
272,538 89434,246 4893,380 68496,165
C 6
C 7 2
7 6
77,72 40 99,87
77,72
89,98
766910,572
34732023,463 12809,597
8
4 30
40 4108417,971
68496,165 684961,65
145958,487
3
20 82,86 82,86 4104619,521
23 77,71
3 77,71
4104619,521
4104619,521
ABOVE PINCH BELOW PINCH
PINCH
89,98
1 100 1
91,76
H-2
100
H-1 90 1
1369,923
684961,65
34732023,463
Fig. 8 Grid diagram for evaluation of process 2 without involving re-boiler at aldehyde-stripper column (HE-3)
6. Conclusion
The three separation and production systems for producing bioethanol from renewable resources have been evaluated and discriminated. The best model of phase equilibria for bioethanol-water system has been selected by optimizing parameters to correlate the experimental data and the predicted ones. The Wilson’s model has been applied to conduct process evaluation for production process of Danish Distilleries with three different kinds of separation processes i.e. Othmer process, Barbet process and a separation process that operates under vacuum condition. The separation system will yield 95% (v/v) bioethanol. The production capacity of the plant is estimated about 4 x 10⁷ litre of bioethanol 95% (v/v) per year. The three configuration processes have been evaluated comprehensively by using pinch technology especially using composite diagram, problem table and matching of streams. The result of the studies shows that the most energy-efficient process among the three separation processes evaluated is the Othmer process followed by the Barbet process and the process involving vacuum operation, with steam or energy consumption, 3.23, 4.11, 4.79 kg of 3-atm steam/ litre bioethanol, respectively. The evaluation also shows that further energy saving can be carried for Barbet and Othmer process configuration when Tmin = 10oC for heat exchange possible.
References
[1] Linnhoff B, Townsend DW, Boland D, Hewitt GF, Thomas BEA, Guy AR, Marsland RH (1982). User Guide on Process Integration for the Efficiency Use of Energy. Institution of Chemical Engineers, London.
[2] Kemp, I.C. (2006). Pinch Analysis and Process Integration: A User Guide on Process Integration for the Efficient Use of Energy, 2nd edition. Butterworth-Heinemann.
[3] Lee KL, Morabito M, Wood RM (1989) Refinery Heat Integration Using Pinch Technology. Hydrocarbon Processing pp: 49-53.
[4] Townsend SDW, Linhoff B (1983) Heat and Power Networks in Process Design. Part I and II, AIChe Journal 29 (5): 742-771. [5] Linnhoff B, Dunford, H Smith R (1983) Heat Integration of
Distillation Column into Overall Processes. Chem. Eng. Sci. 38 (8): 1175-1188.
[6] Kosaric N, Duvnjak D, Farkas A, Sahm H, Bringer-Meyer S, Goebel O, Mayer D (1993) Ethanol. in Ullmann's Encyclopedia of Industrial Chemistry, 5 edition, Vol. A9., Verlag-Chemie, Weinheim, Jerman, pp: 587-653.
[7] Black C (1980) Distillation Modeling of Ethanol Recovery and Dehydration Processes For Ethanol and Gasohol. Chem Eng Prog: 78-85.
[8] Standiford FC, Weimer LD (1983) Energy Conservation in Alcohol Production. Chem Eng Prog. pp: 35-39.
[9] Collura MA, Luyben WL (1988) Energy Saving Distillation design in Ethanol Production. Ind.Eng.Chem.Res, American Chemical Society: 1686-1696.
[10] Ficarella A, Laforgia D (1999) Energy conservation in alcohol distillery with the application pinch technology. Energy Conversion & Management. pp: 1495-1514.