*Corresponding author. Tel.:#31-40-247-2390; fax:# 31-40-246-7497.
E-mail address: [email protected] (A.C. Brombacher).
Accelerated stress testing in a time-driven product
development process
Yuan Lu
!
, Han Tong Loh
!
, Aarnout Cornelis Brombacher
"
,
*
, Elke den Ouden
#
!Centre for Robust Design, National University of Singapore, Singapore"Eindhoven University of Technology, Faculty of Technology Management, Product and Process Quality Section, P.O. Box 513,
5600 MB Eindhoven, The Netherlands
#Centre for Manufacturing Technology Asia Pacixc, Philips Singapore Pte Ltd, Singapore
Abstract
In order to compete in the market, companies have to produce the right products with a shorter time to market and at lower costs than before. Shorter time to market requires the product development process (PDP) to change the way of working from the classical &wait and react' to anticipating and preventing problems as early as possible in the development process. This requires a new, and di!erent role for the quality and reliability tests used. While in a classical PDP products could be tested when available from (pilot) production, a modern, time-driven development process requires optimisation long before larger series of products are available. Accelerated stress testing (AST) is a classical solution for the implementation of tests where product failures need to be activated faster (and cheaper) in a well-controlled environment at the early stage of the PDP. This paper reviews the classical AST strategy and some most recent AST strategies. It demonstrates that these accelerated test strategies are mainly based on generic lists of failure mechanisms and have only very limited relation with the actual failure rate curve of products. The theoretical background of the four-phase roller coaster failure rate curve is addressed and from this an alternative AST strategy is developed based on the relevant phases of the roller coaster curve using a concept called stressor-susceptibility analysis. A discussion, on the application of the proposed AST strategies and their impacts on the four-phase roller-coaster curves, is given at the end. ( 2000 Elsevier Science B.V. All rights reserved.
Keywords: Reliability testing; Time-driven product development process; Validation test; Analysis test; Accelerated stress testing; HAST; MEOST; Stressor-susceptibility analysis
1. Introduction
1.1. New demands for PDP
In order to manufacture products for a competi-tive market, four main business drivers, function, quality, time and cost, become the cardinal con-cerns for the manufacturers. Increasing demands
from the market requires more companies to adopt a systematic strategy to produce a better product in a faster and cheaper way. It is better to be the"rst to market with a good product than to be the last to market with the best product. Therefore, the product development processes (PDP) of com-panies, active in areas with strong demands on costs, quality and with a high degree of innovation, are faced with a number of, often con#icting, demands.
In order to meet these requirements di!erent companies adopt di!erent strategies [1]. Some
companies try to improve their time to market by shortening existing development processes. Al-though initially this may lead to short-term suc-cesses due to strong motivation of the people involved, in the long run these classical time-squeezed PDPs can su!er from a lot of problems (and therefore delay) in the back-end of the process. Another approach, often applied in companies driven strongly by quality standards like ISO9000, is to stick rigidly to procedures. Although this pre-vents a lot of failures in the back-end of the process it will lead to lack of#exibility and lack of capabil-ity to introduce new technology [1].
A third approach to reduce time to market is the use of sophisticated tools in the design process such as QFD, FMEA, FTA, etc. Without these tools embedded as part of the PDP, however, the authors have observed that, without adequate input data and without feedback loops on the results of these tools in the PDP, the added value is questionable. At the same time, the importance of product quality has been changed from &nice to have' to a prerequisite during the last 10 years [1]. If a prod-uct does not have a competitive quality, it does not make sense to produce it for the market. The re-quirements on product quality have also changed over years. The end users have a higher expectation on the product performance of both functionality and quality. There is also a trend to extend war-ranty periods for consumer products.
All of these new trends in the market have added new demands to the PDP. It is supposed to be able to make changes as early as possible to meet the shorter time to market and low cost requirements. It has to move from the reactive way of working to the proactive way, i.e. anticipate and resolve prob-lems early. Concurrent engineering is widely pro-moted under this circumstance [2]. Although many people perceive Concurrent Engineering as &just doing things in parallel', the main aim of concur-rent engineering is to identify and resolve risks early in the PDP, in a phase of maximal#exibility where design changes cause minimal delay.
1.2. New demands for quality and reliability testing
These changes in the PDP have also a major impact on the role of testing in the development
processes. A classical test satis"es, when a product prototype becomes available, the ability of the product to meet its speci"cations. In a classical, sequential, development process functional aspects are validated in the design phase, aspects of pro-duction are validated in the (pre-) propro-duction phase and aspects of customer use are validated at the moment when a larger quantity of products becomes available for the "rst time. This causes, however, a direct con#ict with the concurrent engineering development process because in such a process po-tential problems, found normally during product tests, should have been identi"ed already during the earlier phases of product development.
to tackle all these risks. For example, the length of a product development cycle is originally half a year with 6}8 weeks for reliability testing. Due to the increased market pressure, the length of the development cycle has to be reduced to 4 months. Then, to perform the original 6}8 weeks reliability testing is no longer feasible to meet the reduced development cycle time. There is a strong need to supplement validation tests by something giving information earlier in the PDP.
Testing the product at the earliest possible stage in the PDP is desirable because design improve-ments are least costly and times consuming when the design is still not de"nitively de"ned and fewer agreements with third parties (suppliers of tools, materials, etc.) have been settled [3]. An analysis test is recommended under this condition to be performed at the very early stage of the PDP where a product prototype with limited "nal product information is available. It is meant to invoke real-istic product failures early in the PDP and to detect as many failures as possible. Then, control loops and follow-up actions could be taken to prevent and control those potential failure mechanisms. Finally, product design could be optimised.
For a time-driven PDP, both validation tests and analysis tests are required to optimise the product design through monitoring realistic and potential product failure mechanisms and to validate product design against speci"cation to con"rm the product's quality and reliability. An obvious challenge is how to do analysis tests. It requires implementing analysis tests at the early stage of the PDP to stimulate the most realistic product failures that may happen a few years from now in the "eld. A classical solution is to use accelerated stress testing (AST) to "nd reliability failures in products already during product devel-opment. AST aims to invoke product failures faster and cheaper in house according to its strategy. A natural question that arises is whether the avail-able AST strategies are e!ective and e$cient enough to support the role of analysis tests in the time-driven PDP.
In the following sections, a review of the classical AST strategy is given"rst. Most recent AST strat-egies, Highly Accelerated Stress Test (HAST), Mul-tiple Environmental Over Stress Test (MEOST)
and Random Multiple Environmental Over Stress Test (RMEOST) are discussed. All the available AST strategies are shown to be irrelevant to realis-tic product reliability performance in the"eld. It is mentioned that a Maturity Index on Reliability (MIR) [1,7] analysis can help a company obtain reliable failure mechanism information from prod-uct"eld performance. The theoretical background of the four-phase roller coaster failure rate curve is discussed. The knowledge of the product reliability performance, four-phase roller coaster failures rate curve [4] and stress-susceptibility relationship [4,11] can be used to derive relevant test strategies for the time-driven PDP.
2. Classical accelerated stress testing strategies
2.1. Generic list
The classical AST tests products according to a commonly accepted test standard/generic list against the constant failure rate model. For example, products are tested according to IEC standard under the condition of vibration, shock, temperature, or transient for mechanical failure mechanisms. A typical example of using a generic list is Arrhenius law. Already in the early days of reliability analysis, people realised that for failure mechanisms dominated by chemical reactions there is indeed an option of accelerated testing. The reac-tion speed of chemical reacreac-tions is described by the so-called Arrhenius equation [5].
The use of Arrhenius equation in reliability engineering has had considerable impact. By elev-ating the temperature it becomes possible to carry out tests not requiring millions of products and test hours (product]hours) but only several hundreds.
Fig. 1 [6] below gives a typical example of a rela-tion between temperature and number of prod-ucts]hours required in a test.
In this case, testing of components with failure rates in the order of magnitude of 10~6 at room temperature would require millions of prod-uct]hours. From an industrial perspective
Fig. 1. Accelerated testing assuming activation energy of 0.6 eV [6].
Testing at an elevated temperature of 120 K higher than room temperature would reduce the 106 product]hours to 102 product]hours. This
would result in tests that can be done in-house under controlled conditions involving much reduced numbers of products and testing hours.
It is obvious that the latter is far more attractive than the former. This could be one explanation why accelerated life-test has become very popular in industry. The use of the constant failure rate model in combination with applying Arrhenius law results in testing of components only using a small number of components at an elevated temperature. How-ever, the use of Arrhenius law is valid only where the failure mechanisms of the products are deter-mined by the components only and the failure mechanisms in the components are of a thermo-chemical nature. Researches have shown that this is in many practical situations not the case [7,8].
There are some known risks of using the generic list to conduct AST. It could be possible that unrelated failure mechanisms might be activated, irrelevant stresses might be used, or test results might be interpreted wrongly without the know-ledge of the genuine failure mechanisms that may happen in the"eld. In other words, classical AST only tests for the constant failure rate with poor correlation to the actual product"eld performance.
2.2. More recent accelerated stress testing strategies
There are some very recently developed AST strategies, i.e. Highly Accelerated Stress Test
(HAST) [9], Multiple Environment Over Stress Test (MEOST) [10] and Random Multiple Envi-ronment Over Stress Test (RMEOST).
f HAST: HAST tests products under a condition
where a single stress is increased step by step from one level to another until failure occurs. From the test results, rating or derating strat-egies could be determined. A risk of carring out this test is that irrelevant failure mechanisms may be activated. A challenge to HAST is to assure that the relevant failure mechanisms are to be stimulated. A drawback of applying HAST is that the possible interactions among di!erent stresses which are valid in the"eld may be ignored.
f MEOST: MEOST tests products under a
condi-tion where several combinacondi-tions of stresses are increased step by step until failure occurs. To perform MEOST requires the knowledge of rel-evant failure mechanisms in the "eld, stresses, and interaction among di!erent stresses. It also requires many in-house experiments.
f RMEOST: RMEOST tests products under
a condition where several combinations of the stresses are randomly applied. It requires know-ledge of failure mechanisms and stresses. This test method has shown its advantage in the iden-ti"cation of the localised failures when limited information in failure mechanisms and their interactions is available. Product passes and fail-ures are counted to determine rating or derating strategies. However, RMEOST requires even more experiments than MEOST.
From authors'experiences, the use of HAST is very common in consumer industry. MEOST is still in the experiment stage. However, generic lists instead of the realistic failure mechanisms are used to conduct these tests.
Fig. 2. Roller coaster curve with main phases.
The most important step is to identify the most relevant "eld failure mechanisms from "eld. This results in three questions.
1. How to obtain genuine product failure informa-tion from the"eld?
2. What is the genuine product reliability perfor-mance in the"eld?
3. What do we want to predict by using analysis tests?
Alternative strategies can be developed provided these three questions are answered.
3. Alternative AST strategy
It has been mentioned that the classical AST strategy does not correspond with the failure mech-anisms from the"eld. An alternative to the classical AST strategy that arises naturally is to test the product against the failure mechanisms identi"ed from the analysis of the physics of the"eld failures. This strategy is termed Physics of Failure strategy. It requires the knowledge of the relevant failure mechanisms, product susceptibility, product speci-"cations, the interaction between di!erent failure mechanisms, etc. The Maturity Index on Reliability (MIR) concept [1,7] and a stress-susceptibility concept [4,11] can help companies determine the relevant failure mechanisms from the"eld. A MIR analysis can help companies to obtain reliable product quality and reliability information from the"eld while a stressor-susceptibility analysis can derive the relevant failure mechanisms from the reliable information.
3.1. Modern reliability analysis
In many companies reliability analysis is per-formed as part of product development or market-ing. Reliability"gures are generated, for example, as part of the commercial speci"cation of a product. Although industry uses a wide range of reliability analysis methods [11], most methods use standard component reliability data as input. In a situation where product reliability is predominantly deter-mined by the reliability behaviour of components
and the component reliability models re#ect the behaviour of the respective components in the"eld, constant component failure rate model and parts count method can be used without serious risks. Researches, by Wong [8] as well as Brombacher [7], have shown that in several branches of elec-tronics industry, especially in the areas with a high degree of technological innovation, the require-ments mentioned above are not ful"lled. A roller coaster failure rate (Fig. 2) has been developed to replace the constant failure rate to model the prod-uct behaviour generally in the"eld.
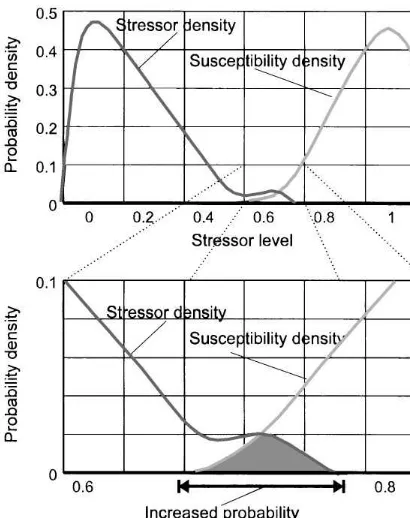
In order to explain the roller coaster curve one of the authors has introduced the so-called& stressor-susceptibility'concept [4,11]. This concept is based on the analysis of physical failure mechanisms in products. A stressor is de"ned as a physical stress in#uencing the quality and reliability of products while susceptibility of a product to a certain failure mechanism is de"ned as a probability function in-dicating the probability that the product will fail after a certain time under a given set of stressors. Although mathematically quite similar to load-strength analysis or stress-load-strength analysis [12,13] there are some di!erences:
f Stressor-susceptibility analysis uses four di!erent
phases instead of three phases to describe the failure rate or hazard rate curve of products (Fig. 3).
f Stressor-susceptibility concentrates strongly on
Fig. 3. Stressor/susceptibility interaction.
1One of the major sources of the "rst phase of the roller coaster curve are a not technically defective products but prod-ucts where a mis-match between the technical product speci" ca-tion and the (often implied) customer speci"cation exists.
As mentioned above the stressor-susceptibility concept of the failure rate curve uses four di!erent classes of failures not all of which may occur (Fig. 4):
1. Hidden 0-hour failures:Products that arrive out-of-(customer1)spec at the customer. These prod-ucts have either slipped through"nal tests, have been damaged during transport or are used in an unanticipated manner. Although, theoretically, these failures should all be observed at the mo-ment of commissioning of the product, complex functionality or delay in customer reporting can cause delay in observing and reporting a failure. 2. Early wear-out: For high-volume consumer products it is not unlikely that there are con-siderable di!erences between either any two items of a product or between how any two
customers will use the same product. In some cases this can lead to situations where a distinct sub-population of products shows di!erent re-liability behaviour than the main population with respect to wear-out. Examples are products that are produced with internal #aws. These #aws can cause a far faster wear-out than the main population. In the failure rate curve these sub-populations can appear as one or more &humps'. These sub-populations are quite di$ -cult to test during production because on the product level they initially perform according to speci"cations.
3. Random failures: Products are designed to be used against anticipated (&normal') user condi-tions. It is, however, di$cult to anticipate and to design against all events to which a product can be subjected. External events with a strong& ran-dom'character, such as lightning and mechan-ical shocks, can cause product failure at any moment in time. Although many of these events have a comparatively low probability, these rare events can always happen. In those cases where the likelihood of occurrence for these events is constant in time and constant over the product population the e!ect will be a constant failure rate.
4. Systematic wear-out: Many products, parti-cularly mechanical products &also certain cat-egories of electronic products'show some form of degradation over time. Well-known time ef-fects are corrosion of metals and increased brit-tleness of plastics. Although the level of degradation will be di!erent for every product in a large population there will be a moment in time when the"rst product fails due to degrada-tion and a moment when the last product has failed. At the moment in time where these fail-ures start to dominate the failure rate curve it will lead to an increasing failure rate.
Fig. 4. Four-phase roller coaster failure rate.
Fig. 5. Increased likelihood testing.
common strategies that can be used to accelerate the stress in AST.
(a) Increase the probability of the extreme stress One strategy is to increase the probability of the occurrence of the failure by increasing the frequency of the real but extreme stress condi-tion of the"eld or by increasing the operation cycles of the product under test conditions given that the failure mechanisms remain the same for both the test and the"eld. Consider a light bulb. Its extreme stress occurs when it is switched on and o!. Assume that this light bulb is designed for an operation life of 5 years and it is to be switched on/o!twice every day under normal usage. If, instead, it is switched on and o! thousands of times each day, then a failure can be expected to happen in a few days instead of months. The probability of the occurrence of failure is increased. This strategy requires the knowledge of the real but extreme stresses and the frequency of the occurrence of the extreme stresses. The advantage of using this strategy is that products are tested under real but extreme operating conditions and that
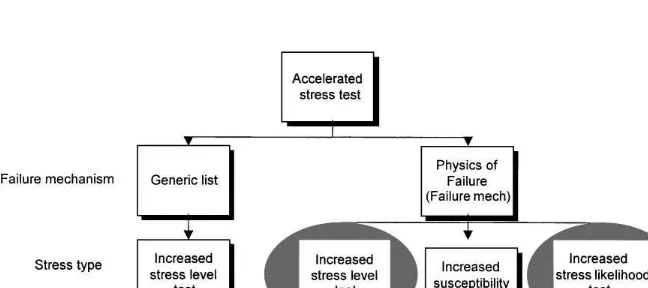
Fig. 7. Various AST strategies. Fig. 6. Increased level testing.
(b) Increase the level of extreme stress
The other strategy is to increase the severity of the real but extreme stress given the failure mechanisms remain the same at both"eld and test. For example, high temperature or high humidity can weaken an adhesive mechanical bond in the"eld. If during the in-house test, the level of temperature or humidity is highly in-creased but the relevant failure mechanism, weakening an adhesive mechanical bond, still remains the same, the occurrence of such a fail-ure would be increased. This strategy also re-quires the knowledge of the stresses and their relevant ranges to elicit the same failure mecha-nisms. It is very easy to perform in practice. However, a strong understanding on the stress severity is necessary to maintain the link be-tween the test and reality (Fig. 6).
Based on the idea of the stress-susceptibility in-teraction [4], theoretically there is still a third
strat-egy that could be used. It is to decrease the product strength so that normal stress acts like extreme stress. In this way, the probability of having a fail-ure is also increased. However, such a test is very di$cult to design and perform in practice. This test method is still in the theoretical research stage only. A summary of the di!erent AST strategies dis-cussed here is given in Fig. 7.
4. Four-phase roller coaster curve and AST strategies
In this section, how to correlate the AST strat-egies with the four-phase roller coaster curve is discussed. In order to have a clear understanding of the common AST strategies used currently and their future trend,"ve high-volume consumer prod-ucts manufacturers were invited for a discussion with some of the authors. The participants repres-ent a variety of functional backgrounds. They are from Development, Quality Assurance and Pro-duction Departments. The main questions directed to them were
f What are the AST strategies used in your
com-pany? What is the basis of using these strategies?
f Do you use HAST, MEOST and RMEOST?
How do you choose stressors for the test?
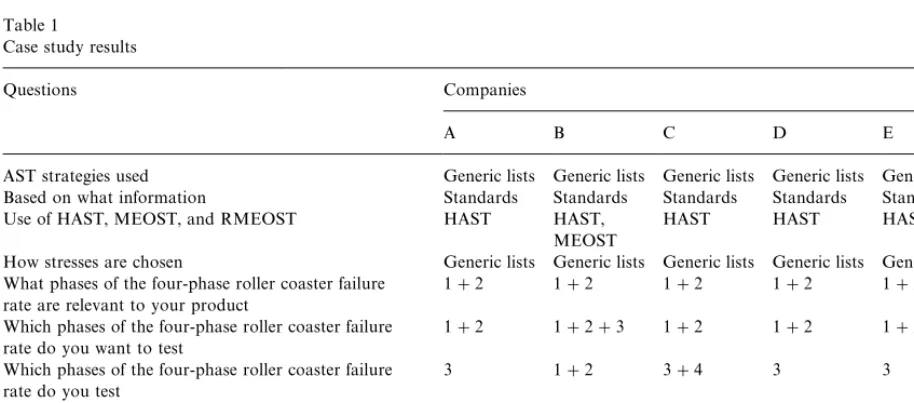
Table 1
Case study results
Questions Companies
A B C D E
AST strategies used Generic lists Generic lists Generic lists Generic lists Generic lists
Based on what information Standards Standards Standards Standards Standards
Use of HAST, MEOST, and RMEOST HAST HAST,
MEOST
HAST HAST HAST
How stresses are chosen Generic lists Generic lists Generic lists Generic lists Generic lists What phases of the four-phase roller coaster failure
rate are relevant to your product
1#2 1#2 1#2 1#2 1#2
Which phases of the four-phase roller coaster failure rate do you want to test
1#2 1#2#3 1#2 1#2 1#2
Which phases of the four-phase roller coaster failure rate do you test
3 1#2 3#4 3 3
Do you have the knowledge of the statistical behaviours of
The entire product population
Yes Yes Yes Yes Yes
Relevant product sub-populations
No No No No No
standards. HAST is widely used by them while MEOST is still at the experimentation stage. How-ever, the stressors for the test are identi"ed from the generic lists not the real failure mechanisms. From the discussion in Section 2, we know that the use of generic lists in AST has its disadvantages as well as advantages. Then more questions were directed to them to"nd out how generic lists detect the realis-tic product failures e!ectively.
f What phases of the four-phase roller coaster
failure rate curve are relevant to your products?
f What phases of the four-phase roller coaster
failure rate curve do you want to test?
f What phases of the four-phase roller coaster
failure rate curve are you testing?
f Do you have knowledge of the statistical
behav-iour of the entire product population?
f Do you have knowledge of the statistical
behav-iour of the relevant product sub-populations?
For all the companies, the responses were that phase 1 and 2 of the four-phase roller coaster curve are relevant. But the standard tests they apply are only able to measure phases 3. For consumer prod-ucts, phases 3 and 4 are less relevant now than before. Due to improved technologies, product quality has improved and faces fewer problems in phase 3. There are not too many phase 3 and
4 problems. At the same time, they are also eco-nomically less important due to rate of technology development, as new products come into the mar-ket to replace old ones before they reach phase 3 and 4. Phases 1 and 2 have become relatively more and more important. From previous section, we have known that only certain sub-populations of products contribute to phases 1 and 2. However, the companies'knowledge of the sub-populations is limited. Further discussion was held to identify areas of improvement for the correlation between the AST strategies and the relevant phases of their products. The common steps that the companies are willing to commit resources for improvement are
f Identify sub-populations from phase 1 and 2. f Identify relevant realistic failure mechanisms. f De"ne alternative AST strategies based on the
realistic failure mechanisms.
The discussion results are summarised in Table 1. From this case study results and discussion in previous sections, a general approach to correlate the AST strategies to the four-phase roller coaster curve can be developed.
to go is to identify the relevant sub-populations from reliable"eld information. Then, the root cause of these sub-populations has to be found. From there, appropriate AST strategies can be developed to test the relevant failure mechanisms. Though phases 1 and 2 are both early product failures, they are di!erent intrinsically. Phase 1 failures happen when the product does not ful"l customer speci" ca-tions, or not caught by the test program or just fail after tests are performed. The idea is to pick out this sub-population under the test program, in which the relevant stress is applied before sending them to the customer. Phase 2 failures happen when a sub-population that is made of weak materials, comes from an unstable production line, and is misused by customer. It is very di$cult to test them in produc-tion since the failure can only be triggered when high stresses are applied. The appropriate ap-proach is to build special analysis prototypes for this sub-population and test them by either increas-ing the stress levels or by increasincreas-ing the likelihood of the extreme stresses at the early PDP.
Phases 3 and 4 product failures are related to the entire population. Phase 3 failures are mainly due to customer use. Operating condition that mimics extreme customer behaviours are simulated on prototypes to increase the likelihood of detecting product failures in the early PDP. Then, design improvement can be done and reliability of this product can be improved. Phase 4 failures are mainly due to the natural wear-out of design and material and due to customer use. Analysis proto-types that represent the entire population are to be tested under the elevated identi"ed relevant stress levels at the early PDP. It would lead to an opti-misation of the product design.
The ideas given in previous section can help to identify the relevant sub-populations and relevant failure mechanisms and to design AST strategies. Early design changes can be made to improve product performance and prevent quality and relia-bility problems later.
5. Conclusion
In this paper, we have discussed the new trends in reliability testing in a time-driven PDP. A fast
and balance reliability-testing scheme is required to invoke realistic product failures at the early stage of the PDP. AST is a classical solution to the require-ments. Currently available AST strategies do not take into account the four-phase roller coaster fail-ure rate curve, but only the constant failfail-ure rate. From the authors' experiences, early fail-ures are especially relevant for most consumer products. Systematic strategies for testing all the phases of the failure rate curve can be derived based on MIR analysis, the knowledge of the four-phased roller coaster curve and the stress-susceptibility concept.
References
[1] P.C. Sander, A.C. Brombacher, MIR: The use of reliability information#ows as a maturity index for quality manage-ment, QREI (1999).
[2] S. Minderhoud, Quality and reliability in product creation
*extending the traditional approach, QREI (1999). [3] P.G. Smith, D.G. Reinertsen, Developing Products in
Half the Time, Van Nostrand Reinhold, New York, 1991.
[4] A.C. Brombacher, D.C.L. Van Geest, O.E. Herrmann, Simulation, a tool for designing-in reliability, ESREF'92 conference Schwabisch's GmuKnd (D), 1992.
[5] W. Nelson, Accelerated Testing, Statistical Models, Test Plans and Data Analysis, Wiley, New York, 1982. [6] Philips Internal Standard UAW0341, Philips Internal
Publication, 1995.
[7] A.C. Brombacher, MIR: Covering non-technical aspects of IEC61508 reliability certi"cation, in: Reliability Engineering and System Safety, Elsevier, Amsterdam, 1999.
[8] K.L. Wong, O!the bathtub onto the roller-coaster curve, Proceedings Annual Reliability and Maintainability Sym-posium, IEEE, New York, 1988.
[9] B.J. Walker, Y.N. Dordi, J. Kitchin, J.A. Steele, Jr., A parison of HAST to conventional THB testing on com-modity SRAM's, 44th Electronic Components and Technology Conference Proceedings, 1994, pp. 877}882. [10] K.R. Bothe, Strategic Supply Management, American
Management Association, New York, 1989.
[11] Rouvroye, Goble, Spiker, A.C. Brombacher, A comparison study of qualitative and quantitative analysis techniques for the assessment of safety in industry, Paper Presented at PSAM III Conference, Crete, Greece, June 1996. [12] E.E. Lewis, Introduction to Reliability Engineering, Wiley,
New York, 1996.
![Fig. 1. Accelerated testing assuming activation energy of 0.6 eV[6].](https://thumb-ap.123doks.com/thumbv2/123dok/3115966.1378524/4.544.31.240.49.177/fig-accelerated-testing-assuming-activation-energy-ev.webp)