Modelling populations of
Erigone atra
and
E. dentipalpis
(Araneae:
Linyphiidae) across an agricultural gradient in Scotland
I.S. Downie
a, I. Ribera
a,1, D.I. McCracken
a,∗, W.L. Wilson
b, G.N. Foster
a, A. Waterhouse
c,
V.J. Abernethy
b,2, K.J. Murphy
baEnvironmental Division, Scottish Agricultural College, Auchincruive, Ayr KA6 5HW, UK
bDivision of Environmental and Evolutionary Biology, IBLS, Graham Kerr Building, University of Glasgow, Glasgow G12 8QQ, UK cFood and Farming Systems, Scottish Agricultural College, Auchincruive, Ayr KA6 5HW, UK
Received 15 July 1999; received in revised form 10 December 1999; accepted 14 December 1999
Abstract
Linyphiid spiders are important generalist predators of insects in agricultural habitats. Their ability to rapidly disperse and colonise disturbed habitats makes them important as a natural form of pest control, often present before other predatory groups arrive. This paper examines the distribution ofErigone atraandE. dentipalpis, which are amongst the commonest linyphiid species to be found on agricultural land in Scotland. The habitat preferences of these species were assessed using abundance and proportion data from 71 independent sites sampled using pitfall traps over 2 years and a selection of repeat first-year sites sampled during the second year, incorporating a range of land-uses from extensive moorland, through grasslands to intensive arable fields.E. atra dominated in autumn sown crops, andE. dentipalpisdominated at the other end of the agricultural management spectrum in low-intensity grasslands. Both species were considered absent from upland and moorland habitats. Linear regression modelling was used to create a model which best estimated the variance in proportions ofE. atrain the catch across the sites using a selection of vegetation, soil, management and landscape variables. This model was based on data from 58 sites whereErigonespecies were abundant and explained 66% of the variation inE. atra. The variables included were increasing vegetation biomass above 50 mm and increasing levels of mixed grazing (both positive), and a combination of increasing plant species richness and vegetation stem density (negative). The efficiency of the model was examined using data from 13 sites which were sampled in the subsequent year to assess the effects of no changes and changes in land-use on the proportions of the two species. Only two sites were considered inaccurate (more than 20% different from the model), suggesting a relatively high level of accuracy. Interaction between the two species was tested for and not found to explain the differences in proportion observed. Comparisons with other studies were carried out, showing similar trends in proportions and in some of the variables identified as important. The influence of specific variables on each species is described in light of possible allometric-type effects, and the importance of these species for conservation and pest control in agriculture is discussed. © 2000 Elsevier Science B.V. All rights reserved.
Keywords: Erigone atra; E. dentipalpis; Agricultural land; Modelling; Scotland
∗Corresponding author. Tel.:+44-1292-525299; fax:+44-1292-525333.
E-mail address:[email protected] (D.I. McCracken)
1Present address: Department of Entomology, Museum of Natural History, Cromwell Road, London SW7 5BD, UK. 2Present address: RSPB Scotland, Dunedin House, 25 Ravelston Terrace, Edinburgh EH4 3TP, UK.
1. Introduction
Linyphiid spiders (Araneae: Linyphiidae) are the most species-rich family of spiders in Britain, and are important predators of insects in most terrestrial habi-tats (Sunderland et al., 1986). Their strong tendency towards aerial dispersal by ballooning within disturbed habitats, such as those typical of agriculture, often re-sult in linyphiid spiders being the first predatory group to arrive in cultivated areas (Weyman et al., 1995), and in these situations they are thought to limit the increases of pest populations before the arrival of more specific predators (Reichart and Lockley, 1984; Sun-derland et al., 1986). Many studies have commented on the general distribution, life-cycle and behaviour of species from this spider family (e.g. Duffey, 1956; De Keer and Maelfait, 1988; Topping and Sunderland,
1992), and often one particular genus (Erigone
Au-douin) accounts for the majority of individuals inves-tigated. Adults of this genus can be found throughout Britain, some widespread, others only from particu-lar habitats. In agricultural systems, they are primarily ground-dwelling species, building webs predominantly over small depressions in the ground, feeding on small prey items such as Collembola, aphids and thrips (Sun-derland et al., 1986; Alderweireldt, 1994).
Ten species ofErigoneare currently known in Britain.
Four were found in this survey, of which, two are
con-sidered common and widespread;E. dentipalpis(Wider)
andE. atra(Blackwall). E. promiscua(O.P.-Cambridge) is widespread, but appears to be less common by
com-parison (Roberts, 1987).E. aletris(Crosby & Bishop)
has only recently been recorded from Britain (Snazell, 1980), and although it is confined to south-east Scot-land, its range is expanding (Stewart, 1997). Other
mem-bers of the genus tend to be rare (E. capra Simon,
E. welchiJackson) or restricted to particular habitat
types (E. longipalpis(Sundevall),E. arctica(White))
or high altitude (E. tirolensisL. Koch,E. psychrophila
Thorell), and were not found in the present survey. Regression models were used to determine the man-agement and environmental factors which best estimate the distribution using proportion data for adult
spec-imens of two of the commonest species of Erigone
found on agricultural land in Scotland;E. dentipalpis
andE. atra. These species are nearly always found to-gether as they have almost identical life cycles, niches and habits (De Keer and Maelfait, 1988; Hänggi
et al., 1995). However, recent surveys suggested that the relative proportions of each species varies across the agricultural land-use gradient. A review of previous ecological studies concentrating on spiders in agricul-tural systems indicated that differences in proportionate abundance were most pronounced between sites which differ greatly in management intensity. For example, in high intensity arable fields, such as autumn sown wheat, E. atrawas more abundant thanE. dentipalpis (Sun-derland et al., 1986; Topping and Sun(Sun-derland, 1992; Thomas and Jepson, 1997; Feber et al., 1998), whereas the reverse was found in less intensive sites such as established grassland habitats (Rushton et al., 1987; Rushton, 1988).
There are many possible reasons for this variation. De Keer and Maelfait (1988) found small differences in
habitat preferences ofE. dentipalpisandE. atrain
pas-tures. For example, webs ofE. dentipalpisfemales are
almost only found in short-grazed areas during spring
and summer, but those ofE. atraare usually higher in
the vegetation. Although it has been shown that web location has little relation to prey capture (possibly, but not exclusively, they provide a base for active prey cap-ture (Alderweireldt, 1994)), this (and probably other) differences in microhabitat choices might explain why these species can coexist. In addition it is thought that the increase in numbers during the life cycle in any given habitat is closely followed by the rapid dispersal of most specimens, thereby preventing competitive ex-clusion proceeding to its conex-clusion, and leaving only a small fraction to give rise to the next years’ popu-lations (De Keer and Maelfait, 1988). Small scale dif-ferences in response to management and environmen-tal variables therefore seem the most likely cause for the change in dominance within the two species across the larger agricultural ecosystem, with the question remaining which factors are the most important.
controlling the populations of two species of farm-land spider, both regarded as useful generalist preda-tors, with the aim of identifying activities that maintain more stable populations of each species in the farming landscape to enhance overall species diversity, richness and pest control potential.
2. Material and methods
2.1. Sampling areas
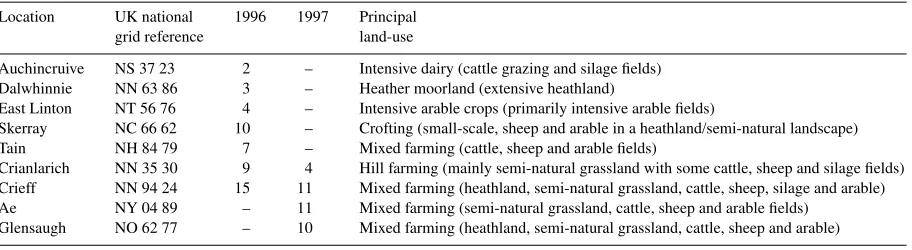
Seventy-one sites were sampled from nine localities throughout mainland Scotland during 1996 and 1997 covering an agricultural land-use gradient of arable crops, through intensive pasture and silage fields, to up-land extensive sheep grazing and crofting. Examples of heather moorland and gorse pasture were also included, but forestry was excluded. Some restricted land-use types such as the machair areas (restricted to the islands and coastal areas of north-western Scotland) or organic farming were not included. Fig. 1 shows the princi-pal areas where trapping occurred during both years. Table 1 summarises the location, principal land-use and number of trap sites for each area. This spread of sam-pling sites was designed to replicate the land-use gra-dient across a broad range of altitudes, latitudes and geo-climatic conditions prevailing in Scotland.
2.2. Methods
Ground-layer spiders were collected using nine pit-fall traps (plastic cups; 75 mm diam) placed 2 m apart
Table 1
Number of pitfall trap sites at each sampling location (with approximate national grid reference for the centre of the sampling location), the year sampled and the principal agricultural land-use of the study area
Location UK national 1996 1997 Principal
grid reference land-use
Auchincruive NS 37 23 2 – Intensive dairy (cattle grazing and silage fields) Dalwhinnie NN 63 86 3 – Heather moorland (extensive heathland)
East Linton NT 56 76 4 – Intensive arable crops (primarily intensive arable fields)
Skerray NC 66 62 10 – Crofting (small-scale, sheep and arable in a heathland/semi-natural landscape) Tain NH 84 79 7 – Mixed farming (cattle, sheep and arable fields)
Crianlarich NN 35 30 9 4 Hill farming (mainly semi-natural grassland with some cattle, sheep and silage fields) Crieff NN 94 24 15 11 Mixed farming (heathland, semi-natural grassland, cattle, sheep, silage and arable) Ae NY 04 89 – 11 Mixed farming (semi-natural grassland, cattle, sheep and arable fields)
Glensaugh NO 62 77 – 10 Mixed farming (heathland, semi-natural grassland, cattle, sheep and arable) Fig. 1. Map showing location of principal sampling areas in Scotland during 1996 and 1997. See Table 1 for numbers of sites and land-use type in each area.
50 sites during 1996, and 324 traps on 36 sites during 1997. Fifteen of the 1996 sites from Crianlarich and Crieff areas (see Fig. 1) formed part of the 1997 sur-vey as a selection of repeat sites of varying land-use including some management changes, giving a total of 71 independent and 15 repeat sites over the 2 years. The traps were serviced at roughly 4-week intervals for 4 months, beginning in May of both years, ending early September. The material from all nine traps at each site was collected and bulked before identification of all spider species captured.
The use of pitfall traps for between site comparisons within spider species poses well known problems of variations in trap efficiency between the different habi-tats (see Toft and Riedel (1995) for an extensive
dis-cussion). However, the members of theErigonegenus
are very similar in their ecology and behaviour,
par-ticularly E. dentipalpis and E. atra, living close to
the ground (Sunderland et al., 1986) and having sim-ilar powers of dispersal (Blandenier and Fürst, 1998). With this in mind, numerical comparisons based on proportions of each species within each site were con-sidered acceptable: the primary aim was to study the relationships between the two most common species at each site across a broad management gradient. Top-ping and Sunderland (1992) found similar ratios of these species occurring in relation to each other from
both density (3.09:1atra:dentipalpisindividuals ratio
with D-Vac) and pitfall trap (3.14:1) samples from win-ter wheat fields suggesting that the sampling method is largely independent. Where between site compar-isons of abundance of the two species were investi-gated, non-parametric methods of analysis were used (Spearman’s rank correlation).
2.3. Environmental and landscape variables
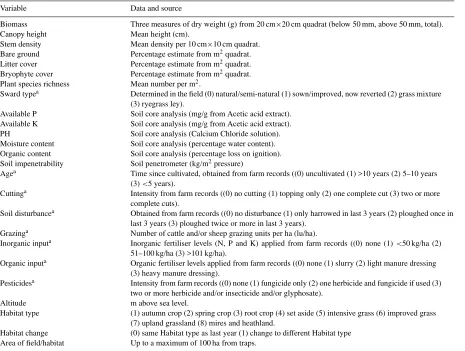
Table 2 lists the vegetation, soil, land-use/manage-ment and wider environland-use/manage-mental variables collected. Veg-etation data (means) were collected three times during each season (June–August) at approximately monthly
intervals from a permanent 10 m×10 m quadrat located
adjacent to the pitfall traps. Soil and environmental variables were collected during early May (except soil penetrability which was averaged from five samples per season), and management information was obtained from the land owners at the end of each season. A composite management index was devised to provide
a single measure of management intensity for each site based on eight management variables labelled in Table 2; soil disturbance, cutting, grazing, inorganic fertiliser, organic manure levels, pesticides, sward type and age. Each was assigned a score on a four-point scale, from 0 to 3 in ascending order of intensity (e.g. Soil disturbance — (1): only harrowed once in previ-ous 3 years (2): ploughed once in previprevi-ous 3 years (3): ploughed twice or more in previous 3 years. Cutting — (1): topping only (2): one complete cut and removal of vegetation (3): two or more complete cuts and removal of vegetation). From the summation of these scores, the cumulative Management Intensity Index (MII) was compiled (giving a possible range of 0–24) for each site.
An initial investigation into multi-collinearity within the variables was performed and, as expected, there were very high correlations between some variables. For example, soil organic and moisture contents were
significantly correlated across all sites sampled (r=0.87,
df=70,p>0.001) and those included in the analysis of
the proportion data (r=0.88, df=57, p>0.001). As a
result, soil organic content and biomass total (the lat-ter highly correlated with biomass above 50 mm) were removed from the analyses. All remaining data were transformed where necessary.
2.4. Analysis of E. dentipalpis and E. atra relationships with variables
The main aim of the analyses was to model the pro-portional data of each species across the agricultural gradient. Before this, Spearman’s rank correlation was used to identify variables of importance in determining the abundance of each species across all 71 sites. This non-parametric approach allowed for the caution re-quired when analysing pitfall traps and was used only for identifying potentially important species:variable relationships. However, this analysis also highlighted any differences in direction and magnitude of response of the species to the different variables. Variation in the proportion data could result from both species having different directions of response to significant variables
(for example, if E. atra responded positively to any
variable, yetE. dentipalpisresponded negatively, this
Table 2
Vegetation, soil, land-use/farming methods and wider landscape/environment variables recorded for each site
Variable Data and source
Biomass Three measures of dry weight (g) from 20 cm×20 cm quadrat (below 50 mm, above 50 mm, total). Canopy height Mean height (cm).
Stem density Mean density per 10 cm×10 cm quadrat. Bare ground Percentage estimate from m2quadrat. Litter cover Percentage estimate from m2quadrat. Bryophyte cover Percentage estimate from m2quadrat. Plant species richness Mean number per m2.
Sward typea Determined in the field (0) natural/semi-natural (1) sown/improved, now reverted (2) grass mixture (3) ryegrass ley).
Available P Soil core analysis (mg/g from Acetic acid extract). Available K Soil core analysis (mg/g from Acetic acid extract). PH Soil core analysis (Calcium Chloride solution). Moisture content Soil core analysis (percentage water content). Organic content Soil core analysis (percentage loss on ignition). Soil impenetrability Soil penetrometer (kg/m2pressure)
Agea Time since cultivated, obtained from farm records ((0) uncultivated (1) >10 years (2) 5–10 years (3)<5 years).
Cuttinga Intensity from farm records ((0) no cutting (1) topping only (2) one complete cut (3) two or more complete cuts).
Soil disturbancea Obtained from farm records ((0) no disturbance (1) only harrowed in last 3 years (2) ploughed once in last 3 years (3) ploughed twice or more in last 3 years).
Grazinga Number of cattle and/or sheep grazing units per ha (lu/ha).
Inorganic inputa Inorganic fertiliser levels (N, P and K) applied from farm records ((0) none (1)<50 kg/ha (2) 51–100 kg/ha (3) >101 kg/ha).
Organic inputa Organic fertiliser levels applied from farm records ((0) none (1) slurry (2) light manure dressing (3) heavy manure dressing).
Pesticidesa Intensity from farm records ((0) none (1) fungicide only (2) one herbicide and fungicide if used (3) two or more herbicide and/or insecticide and/or glyphosate).
Altitude m above sea level.
Habitat type (1) autumn crop (2) spring crop (3) root crop (4) set aside (5) intensive grass (6) improved grass (7) upland grassland (8) mires and heathland.
Habitat change (0) same Habitat type as last year (1) change to different Habitat type Area of field/habitat Up to a maximum of 100 ha from traps.
aVariables included in management intensity index (MII; see text). A combined grazing score was created for the MII based on four categories ((0)=none (1)=low (<0.8 livestock units (lu/ha)) (2)=moderate (0.8–1.14 lu/ha) (3)=high livestock density (>1.14 lu/ha).
then the changes in proportion would be due to an allometric-type response (in this sense differential rates of response by the two species), which would validate any relationships found during the modelling process.
The proportion ofE. atrarelative toE. dentipalpis
at each of the independent sites was then analysed us-ing the Generalised Linear Interactive Modellus-ing pack-age (GLIM, Royal Statistical Society, 1992) to develop multiple regression models relating the proportion of E. atrato the variables at each site. Thirteen sites where less than five specimens of both species combined were found were removed before the modelling process, leav-ing 58 sites included in the model. The appropriate
error pattern, link function and overdispersion
proce-dures were used (binomial, logit and Pearsonχ2scale
directive, respectively within GLIM).
All variables in the data set were first considered independently to indicate which had the greatest influ-ence on the model. Significance was assessed using the
χ2approximation andt-tests on coefficients (Crawley,
1993). These variables were used as seeds for regres-sion model development. Considerable care was taken in the interpretation of the results, especially when the
parameters were marginally significant (p values
be-tween 0.05 and 0.01) or when they explained a small
(more relevant in analyses involving 30 or less sam-ples; Crawley, 1993). The effects of these variables were then considered when used in combination (and through interaction) with each other and the remaining variables. A minimum adequate model was then con-structed (using both insertion techniques which added random variables to the initial best-fit variable, and deletion techniques which removed random variables from the maximal model) which explained the maxi-mum significant fit with as few variables as possible.
The model was applied to the repeat sites to
com-pare predictedE. atra proportions with those actually
recorded during 1997. Although these sites were not spatially independent, they nevertheless provide infor-mation on the effects of both no changes and changes in
land-use and management on theErigoneproportions.
The land-use at these sites during 1997 included low, medium and high intensity grassland and spring crops (autumn sown crops were not sown on the repeat sites so none were available for testing).
Finally, the abundance data for each species was modelled individually using GLIM (Poisson error, log
link and Pearsonχ2scale directive) to test for interaction
between the species. The residuals of the maximal model (all variables) related to each species were obtained and correlated. If a positive relationship was found be-tween the species after all variables were extracted, then this would indicate that some variation was still unaccounted for through an unmeasured variable, or that if some level of interaction exists between the species, it does not explain the differences in propor-tion observed. A negative relapropor-tionship would suggest that there was an interaction influencing the results, and no relationship would suggest that all variables included in the maximal models fully explained the variation.
3. Results
A total of 30,546Erigonespecimens was collected
from the 71 independent sites over the 2 years, with a further 6594 taken from the 15 repeat sites sampled
during 1997 (see Table 3).E. dentipalpisandE. atra
comprised 63.5 and 34.4% of the combined total,
re-spectively. The only other species of Erigone found
wereE. promiscuaandE. aletris,which represented only 1.7 and 0.4% of the total catch, respectively.
Table 4 shows the results of the Spearman’s rank cor-relations relating the different variables with the
abun-dance of bothE. atraandE. dentipalpis at all sites.
The most important environmental variables indicated forE. dentipalpiswere cattle grazing levels, soil pH and impenetrability (all positive). The most important
variables forE. atraincluded plant species richness,
bryophyte cover, soil moisture (all negative) and soil pH, available P (both positive). In addition, habitat type and MII were important, both indicating that, as general management increases, be it on the MII scale or by the
broad land-use categories included in Table 2,E. atra
populations increased. These results are constrained by the problems with pitfall trapping and should be treated with caution, hence the non-parametric approach.
Table 4 also shows that both species respond to each variable of importance in the same direction, or where there is a difference in direction, then one of the scores is non-significant, as in the case of stem density. This suggests that both species are responding in the same direction to each variable measured, and it is the dif-ferences in magnitude of response (or importance of the variables) which is influencing the differences in proportions found (an allometric-type response). These differences include lower amounts of litter cover, higher stem density and greater soil impenetrability which
were more associated withE. dentipalpisnumbers than
E. atra. In contrast,E. atrawas more associated with low plant species richness, low biomass below 50 mm, higher levels of available P and lower altitudes.
Sites with small numbers ofE. dentipalpisandE.
atra tended to be heather dominated or wet upland
grassland, and these were removed from the binomial model analysis. Fig. 2 shows the remaining 58 sites classified into five main land-use groups (autumn and spring crops and three grassland groups based on
man-agement intensity) and the proportion ofE. atrataken
at each site. Autumn sown crops had the highest
propor-tion ofE. atrapresent, followed by spring-sown crops
and then grassland (F4,53=18.5,p<0.001). There was
little difference among the three grassland categories,
although the results suggest thatE. atraincreases in
proportion as intensity increases. These findings equate well with the results from the Spearman’s correlations, withE. dentipalpispreferring the more compacted and
established grassland areas andE. atracrop situations.
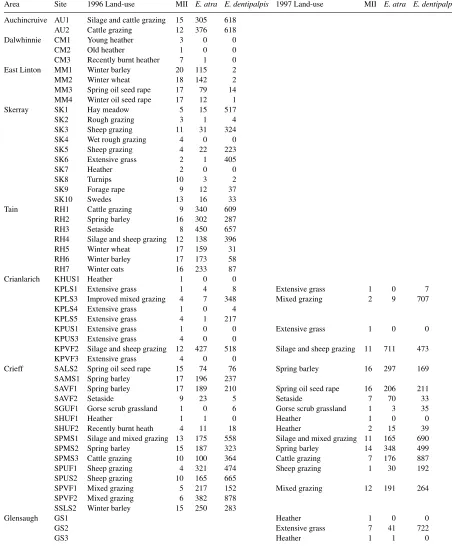
Table 3
Land-use, management intensity index (MII) and numbers ofE. atraandE. dentipalpisfound at each site during 1996 and 1997
Area Site 1996 Land-use MII E. atra E. dentipalpis 1997 Land-use MII E. atra E. dentipalpis Auchincruive AU1 Silage and cattle grazing 15 305 618
AU2 Cattle grazing 12 376 618
Dalwhinnie CM1 Young heather 3 0 0
CM2 Old heather 1 0 0
CM3 Recently burnt heather 7 1 0 East Linton MM1 Winter barley 20 115 2
MM2 Winter wheat 18 142 2
MM3 Spring oil seed rape 17 79 14 MM4 Winter oil seed rape 17 12 1
Skerray SK1 Hay meadow 5 15 517
SK2 Rough grazing 3 1 4
SK3 Sheep grazing 11 31 324
SK4 Wet rough grazing 4 0 0
SK5 Sheep grazing 4 22 223
SK6 Extensive grass 2 1 405
SK7 Heather 2 0 0
SK8 Turnips 10 3 2
SK9 Forage rape 9 12 37
SK10 Swedes 13 16 33
Tain RH1 Cattle grazing 9 340 609
RH2 Spring barley 16 302 287
RH3 Setaside 8 450 657
RH4 Silage and sheep grazing 12 138 396
RH5 Winter wheat 17 159 31
RH6 Winter barley 17 173 58
RH7 Winter oats 16 233 87
Crianlarich KHUS1 Heather 1 0 0
KPLS1 Extensive grass 1 4 8 Extensive grass 1 0 7
KPLS3 Improved mixed grazing 4 7 348 Mixed grazing 2 9 707
KPLS4 Extensive grass 1 0 4
KPLS5 Extensive grass 4 1 217
KPUS1 Extensive grass 1 0 0 Extensive grass 1 0 0
KPUS3 Extensive grass 4 0 0
KPVF2 Silage and sheep grazing 12 427 518 Silage and sheep grazing 11 711 473
KPVF3 Extensive grass 4 0 0
Crieff SALS2 Spring oil seed rape 15 74 76 Spring barley 16 297 169
SAMS1 Spring barley 17 196 237
SAVF1 Spring barley 17 189 210 Spring oil seed rape 16 206 211
SAVF2 Setaside 9 23 5 Setaside 7 70 33
SGUF1 Gorse scrub grassland 1 0 6 Gorse scrub grassland 1 3 35
SHUF1 Heather 1 1 0 Heather 1 0 0
SHUF2 Recently burnt heath 4 11 18 Heather 2 15 39
SPMS1 Silage and mixed grazing 13 175 558 Silage and mixed grazing 11 165 690
SPMS2 Spring barley 15 187 323 Spring barley 14 348 499
SPMS3 Cattle grazing 10 100 364 Cattle grazing 7 176 887
SPUF1 Sheep grazing 4 321 474 Sheep grazing 1 30 192
SPUS2 Sheep grazing 10 165 665
SPVF1 Mixed grazing 5 217 152 Mixed grazing 12 191 264
SPVF2 Mixed grazing 6 382 878
SSLS2 Winter barley 15 250 283
Glensaugh GS1 Heather 1 0 0
GS2 Extensive grass 7 41 722
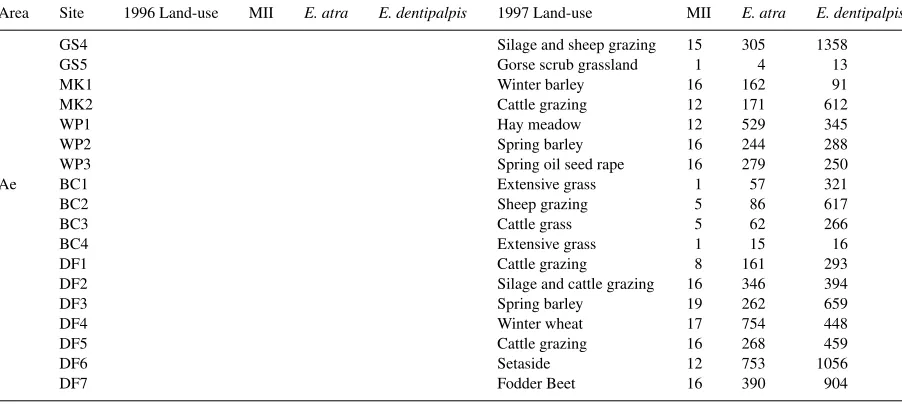
Table 3 (Continued)
Area Site 1996 Land-use MII E. atra E. dentipalpis 1997 Land-use MII E. atra E. dentipalpis
GS4 Silage and sheep grazing 15 305 1358
GS5 Gorse scrub grassland 1 4 13
MK1 Winter barley 16 162 91
MK2 Cattle grazing 12 171 612
WP1 Hay meadow 12 529 345
WP2 Spring barley 16 244 288
WP3 Spring oil seed rape 16 279 250
Ae BC1 Extensive grass 1 57 321
BC2 Sheep grazing 5 86 617
BC3 Cattle grass 5 62 266
BC4 Extensive grass 1 15 16
DF1 Cattle grazing 8 161 293
DF2 Silage and cattle grazing 16 346 394
DF3 Spring barley 19 262 659
DF4 Winter wheat 17 754 448
DF5 Cattle grazing 16 268 459
DF6 Setaside 12 753 1056
DF7 Fodder Beet 16 390 904
analysis. Because of the large number of variables avail-able for testing and the necessary caution required in identifying marginally significant variables, significance
was taken atp<0.01. Habitat type proved to be the
pre-dictor which explained the most variation in the pro-portion data, followed by five variables associated with vegetation structure. These variables were used as the
Table 4
Significant Spearman’s rank correlations between variables andE. dentipalpisandE. atraabundance∗
Variable E. dentipalpis E. atra
Plant species richness −0.19 −0.58∗
Litter cover −0.35∗ −0.12
Bryophyte cover −0.39∗ −0.53∗
Stem density 0.39∗ −0.04
Biomass below 50 mm −0.07 −0.39∗
Cattle (lu/ha) 0.59∗ 0.48∗
Soil pH 0.43∗ 0.60∗
Available P 0.31 0.55∗
Moisture −0.35∗ −0.56∗
Soil impenetrability 0.52∗ 0.29
MII 0.37∗ 0.68∗
Altitude −0.21 −0.38∗
Field/site area −0.34∗ −0.46∗
Habitat type −0.30 −0.62∗
Change in habitat 0.31∗ 0.48∗
∗Significance taken at p<0.01, variables which were
not-significant against both species are not shown.
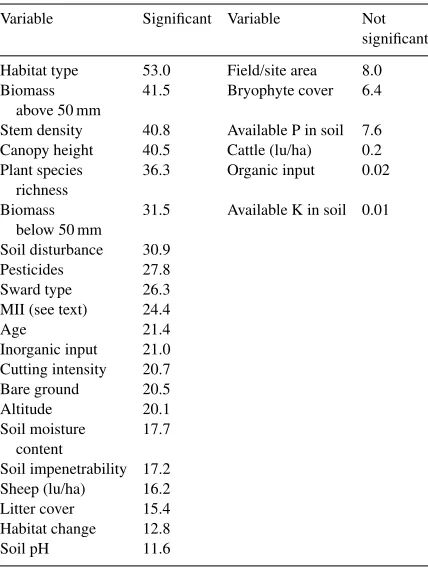
starting points for further GLIM analyses. The large number of variables which represent a significant pro-portion of the variance (see Table 5) is probably an arte-fact of the multi-collinearity of many of the variables, i.e. they explain similar proportions of model variance. The next step was to find the variables which among them represented the maximum significant variation in E. atraproportions.
Each variable was added to the different starting vari-ables in turn, and subtracted from the maximal model, including interaction variables. Table 6 shows the final results (minimum adequate model) of the GLIM analy-sis, which explains 66.2% of the variation in proportion ofE. atrarelative toE. dentipalpis. Increasing vege-tation biomass above 50 mm accounted for the largest variation, positively explaining 41.5%. The addition of decreasing plant species richness further altered the explained variation by 14.8%, and low stem density another 2.8%, although when considered alone, stem
density was not significant. However, when both plantS
and density were combined through interaction, this al-tered the explained variation by 20.3%, additional to the biomass above 50 mm model, which had a significant
and negative effect on theE. atraproportion. Neither
in-Fig. 2. Mean proportion (±s.e.) ofE. atrarelative toE. dentipalpistaken in the catch at each main land-use. Grassland has been classified into three groups based on their Management Intensity Index scores which ranged between 1 and 16 (low: 0–5, medium: 6–10, high: 11–16). Numbers in parenthesis indicate number of sites in each land-use category.
Table 5
Percentage variance accounted for (in decreasing importance) by considering each environmental variable independently using GLIM, against the proportion ofE. atrataken across the sites
Variable Significant Variable Not significant Habitat type 53.0 Field/site area 8.0 Biomass 41.5 Bryophyte cover 6.4
above 50 mm
Stem density 40.8 Available P in soil 7.6 Canopy height 40.5 Cattle (lu/ha) 0.2 Plant species 36.3 Organic input 0.02
richness
Biomass 31.5 Available K in soil 0.01 below 50 mm
Soil disturbance 30.9 Pesticides 27.8 Sward type 26.3 MII (see text) 24.4
Age 21.4
Inorganic input 21.0 Cutting intensity 20.7 Bare ground 20.5
Altitude 20.1
Soil moisture 17.7 content
Soil impenetrability 17.2 Sheep (lu/ha) 16.2 Litter cover 15.4 Habitat change 12.8
Soil pH 11.6
dicating that when grazing levels were high from both
types of livestock,E. atraproportions increased.
Al-though the categorical variable habitat type explained the greatest variation of all initial variables, the value of 53% deviance accounted for could not be improved with additional single or interactive variables without loss of significance of parameters. Thus, using the
nec-essary transformations, the proportion ofE. atrain the
combined species catch is best represented by:
1
1+(1/exp(−a+(Biomass×b))−((PlantS
×Density)× c)+((Cattle×Sheep)×d))
wherea,b,canddrepresent the coefficient estimates
shown in Table 6 and where× indicates interaction
with.
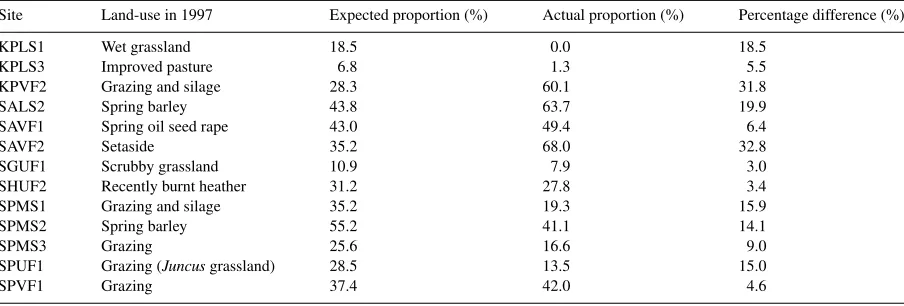
The predictive efficiency of this model was examined further using the repeat sites sampled in 1997. Only 13 of the 15 sites were used for predictive testing as two sites recorded less than five individuals of either species (during 1996 and 1997). Table 7 shows the expected
proportions ofE. atraat each site using the above model
Table 6
Amount of variation in proportion ofErigone atraaccounted for by considering vegetation biomass above 50 mm, vascular plant species richness, vegetation stem density, cattle and sheep grazing (in lu/ha) together in the GLIM analysis in the null modela
Source Deviance accounted for Change in d.f. Percentage explained
Biomass above 50 mm 26.54 1 41.5
Plant (S)×Stem density 12.96 1 20.3
Cattle×Sheep 2.86 1 4.5
Model deviance 42.36 66.2
Residual deviance 21.63 54
Coefficient estimateb SE Parameter t-value
−0.6255 (a) 0.1999 1
0.0236 (b) 0.0075 Biomass (>50 mm) 3.15***
−0.0004 (c) 0.0001 Plant (S)×Stem density 3.20***
0.4021 (d) 0.2348 Cattle×Sheep 1.71*
aTotal deviance=63.99; d.f.=57; Probability distribution=Binomial; Link function=Logit; Scale parameter=77.10;×indicates interaction with.
batodrelate to the model present in the text.
32%) and a set aside field at Crieff (SAVF2: 33%). Both sites were underestimated, suggesting that there was perhaps some landscape or management variable not measured influencing the proportion variation.
Testing for interaction between the species, the max-imal models produced using GLIM using abundance
data (natural log) explained 80% (E. atra) and 78% (E.
dentipalpis) of the variation. The residuals produced from the analysis of each species were obtained and compared, and a significant and positive relationship
was found (r=0.58, df=70,p<0.001). These results
confirm that there may still be some variation within
Table 7
Predictive testing of the binomial model showing expected values ofErigone atraproportions compared to actual values found during 1997 Site Land-use in 1997 Expected proportion (%) Actual proportion (%) Percentage difference (%)
KPLS1 Wet grassland 18.5 0.0 18.5
KPLS3 Improved pasture 6.8 1.3 5.5
KPVF2 Grazing and silage 28.3 60.1 31.8
SALS2 Spring barley 43.8 63.7 19.9
SAVF1 Spring oil seed rape 43.0 49.4 6.4
SAVF2 Setaside 35.2 68.0 32.8
SGUF1 Scrubby grassland 10.9 7.9 3.0
SHUF2 Recently burnt heather 31.2 27.8 3.4
SPMS1 Grazing and silage 35.2 19.3 15.9
SPMS2 Spring barley 55.2 41.1 14.1
SPMS3 Grazing 25.6 16.6 9.0
SPUF1 Grazing (Juncusgrassland) 28.5 13.5 15.0
SPVF1 Grazing 37.4 42.0 4.6
the environment or management which has not been sampled influencing both species, or that if some level of interaction exists between the species, it does not explain the differences in proportion observed.
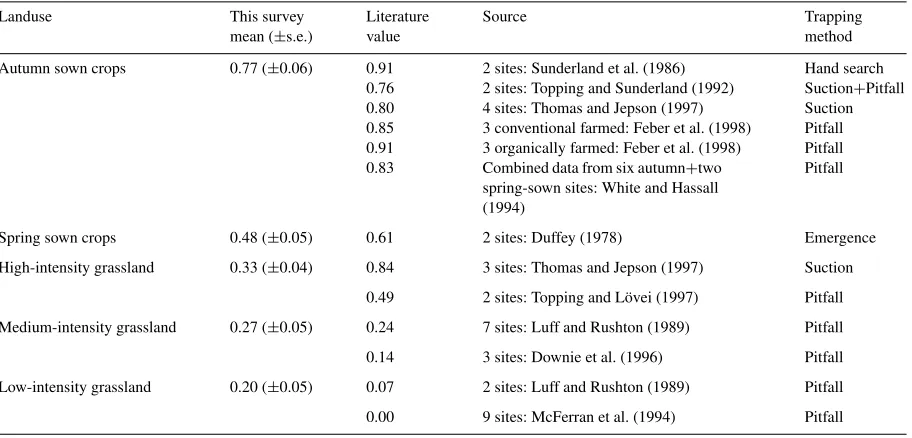
Similar patterns in the relative proportions ofE. atra
have been found in many other studies, using a variety of sampling methods, in the UK and Ireland. Table 8
provides a comparison of the mean values ofE. atra
found in each of the main land-use categories (psented in Fig. 2). Comparable, but highly variable
re-sults are obvious. Autumn sown crops are high inE.
Table 8
Comparison of proportion ofE. atrarelative toE. dentipalpisin catch with literature data
Landuse This survey Literature Source Trapping
mean (±s.e.) value method
Autumn sown crops 0.77 (±0.06) 0.91 2 sites: Sunderland et al. (1986) Hand search 0.76 2 sites: Topping and Sunderland (1992) Suction+Pitfall 0.80 4 sites: Thomas and Jepson (1997) Suction 0.85 3 conventional farmed: Feber et al. (1998) Pitfall 0.91 3 organically farmed: Feber et al. (1998) Pitfall 0.83 Combined data from six autumn+two
spring-sown sites: White and Hassall (1994)
Pitfall
Spring sown crops 0.48 (±0.05) 0.61 2 sites: Duffey (1978) Emergence
High-intensity grassland 0.33 (±0.04) 0.84 3 sites: Thomas and Jepson (1997) Suction 0.49 2 sites: Topping and Lövei (1997) Pitfall Medium-intensity grassland 0.27 (±0.05) 0.24 7 sites: Luff and Rushton (1989) Pitfall 0.14 3 sites: Downie et al. (1996) Pitfall Low-intensity grassland 0.20 (±0.05) 0.07 2 sites: Luff and Rushton (1989) Pitfall 0.00 9 sites: McFerran et al. (1994) Pitfall
sown crops, and grasslands show a gradual decrease as management intensity decreases. The values for
au-tumn sown crops are in general higher (76–91% E.
atra) than those found during this survey (77%). Also,
the high-intensity grasslands were considerably higher (49–84% compared to only 33%). Despite these dif-ferences within land-use type, the overall trend of
au-tumn sown crops being dominated byE. atrarelative to
E. dentipalpis, and the reverse for low-intensity grass-lands, is clear and apparently independent of sampling method.
4. Discussion
The binomial modelling process identified three vari-ables (or combinations of varivari-ables) which best reflect these differences; vegetation biomass above 50 mm, plant species richness and structural density combined, and levels of mixed cattle and sheep grazing. Autumn-sown crops represent the sites sampled with highest levels of plant biomass above 50 mm throughout the year, as by June, when the first vegetation measure-ments were taken, these sites already had a high canopy compared with the spring-sown crops. This aspect of vegetation present throughout the winter may be
impor-tant forE. atrapopulations. Both species are successful
colonisers of recently disturbed habitats
(Weyman et al., 1995), shown by the almost equal pro-portions of both species in spring-sown crops.
How-ever, it appears thatE. atrais more successful if there
is a stable canopy cover over the winter, just after distur-bance events such as ploughing and crop sowing which allow colonisation. Dispersal of these species relies on specific climatic conditions (Duffey, 1956) but is usu-ally motivated by stress on the populations such as food shortage (Weyman et al., 1995) or harvesting (Blande-nier and Fürst, 1998). A combination of these factors results in maximal dispersal events of both species oc-curring during October and November (De Keer and Maelfait, 1988; Blandenier and Fürst, 1998), although ballooning can occur in any month. Ironically, neither biomass above 50 mm nor canopy height were corre-lated with log abundance of either species (Table 4), strengthening the argument that it is timing of the dis-turbances and subsequent succession that influences the data most (also suggested by Duffey, 1978).
High numbers of plant species and high stem den-sity were not favourable situations for high
propor-tions of E. atra. Crops were both species poor and
proportions ofE. atra. Edwards et al. (1976) also found
a strong negative relationship (r=−0.61) betweenE.
atraand increasing plant richness, and commented on
E. atraincreasing in numbers in high yield–low species grasslands.
Grazing by either cattle or sheep had no significant influence on the model. However, in combination they
represented an increase inE. atra. Ironically, grazing
tends to reduce the vegetation biomass and frequently
diversifies the sward, which would suggest fewer E.
atraspecimens. It is possible therefore that it is the
ac-tual physical intensity of mixed grazing which provides
a habitat whichE. atrais able to colonise successfully.
Cattle and sheep grazing combine to make a sward that is both uniform and closely cropped, different from the sward resulting from either just cattle or sheep (Nolan and Connolly, 1977; Vallentine, 1990), where some de-gree of structural heterogeneity usually persists. Under normal conditions (i.e. not over-grazed) swards grazed by sheep tend to develop tussocks through selective grazing (Grant et al., 1985; Frame, 1992), and swards stocked with cattle develop distinct dung-heap areas which are not grazed (Forbes and Hodgeson, 1985). Although the variables described above represent the
maximum variance for describingE. atra, the
oppo-site effects must influenceE. dentipalpisin a similar
fashion. This may explain the effect of grazing on the proportions found. As mixed grazing increases, it may
have a more detrimental effect onE. dentipalpis
pop-ulations than E. atra, thus E. dentipalpis abundance
decreases more rapidly thanE. atragiving the latter a
higher proportion in the catch (the allometric-type ef-fect again). This may be evident for several variables, but only important for those included in the model.
Interaction between the two species of spider was excluded as contributing to the habitat preferences and proportions found. Although they have almost identi-cal life cycles, niches and habits in pasture areas in Belgium, De Keer and Maelfait (1988) concluded that they probably coexist without exclusion of one another through dispersal processes. However, in this broader land-use situation in Scotland, clear preferences for particular habitats, and the factors probably influencing this distribution are evident.
The residual variation not explained in the model is most likely a combination of landscape structure and some specific management technique (or timing of) not recognised in this survey. Linyphiid dispersal is greatly
influenced by land-use type, with higher levels of dis-persal activity occurring in cereal fields compared with perennial grass fields (Thomas and Jepson, 1999). This is probably because of a variety of factors associated with a gradual deterioration of habitat quality with time, such as unfavourable changes in microclimate (Geiger et al., 1995) or shortages in food resources (Weyman et al., 1994). These observations may have important consequences for conservation and pest control in in-tensively managed agricultural landscapes. Maintain-ing populations or metapopulations of each species in the environment is probably self-regulating if the land-scape consists of a patchwork of varying land-use, all acting as sources and sinks of dispersal and coloni-sation (Thomas and Jepson, 1999). The variation and rotation in the mixed farming situation means that pop-ulations of either species will never be excessively low during periods of the year, with dispersal behaviour re-founding local extinctions (Gilpin and Hanski, 1991). However, large fields within an intensive arable
land-scape will result in lower proportions ofE. dentipalpis,
as well as lower densities of linyphiid spiders in gen-eral (Halley et al., 1996), especially if the trend in the area is for autumn-sown crops.
The allometric-type response pattern has strong im-plications for habitats managed for the conservation of specific species. The apparent spectacular differences in proportions between the different habitats sampled here may in reality be the result of small differences in response to variables that are otherwise very similar. Even if species have similar ecology (which is usually measured in crude terms like positive or negative re-sponses to environmental variables), the actual effects of habitat manipulations, for farming or conservation purposes, can produce extremely dissimilar results be-tween species. Hence, in situations where specific bio-diversity programmes target single or few species by habitat conservation management, an awareness must be made of the possible detrimental effects on the other species within the same niche. After all, overall biodi-versity is just as important as individual species within the environment.
Maintaining both species ofErigonewithin the local
the environment, maintaining a greater degree of pest control.
The binomial modelling process used in this analysis was not intended to identify the specific relationships between the variables and each species (other authors have highlighted specific relationships not discussed here, e.g. positive correlations between soil P and K
and bothE. atraandE. dentipalpishave been shown
by Edwards et al., 1976), rather it aimed to present an indication of how best to estimate the relative propor-tions of each species in the catch. Although only 66% of the variation was explained by the minimal model, the results nevertheless suggest that relatively accurate
predictions ofE. atraandE. dentipalpispresence can
be made across the Scottish agricultural gradient exam-ined here. This approach has formed a useful first step in estimating the numbers of these agriculturally im-portant species. Further sampling from a wider range of sites or from other existing datasets would facilitate more accurate testing of the model.
Acknowledgements
The authors thank S. Blake for useful discussions on the analyses and George Thomas and Nigel Willby for reading a draft version of the manuscript. A. Burrows, N. Hammond, K. Leech and C. Tyrrell provided assis-tance with trapping and sorting pitfall material. Thanks are also expressed to the many farmers and land-owners who allowed access to sample their land. The project was funded by the Scottish Office Agriculture, Envi-ronment and Fisheries Department (SOAEFD) under Flexible Fund UGW/814.
References
Alderweireldt, M., 1994. Prey selection and prey capture strategies of linyphiid spiders in high-input agricultural fields. Bull. Br. Arachnol. Soc. 9, 300–308.
Blandenier, G., Fürst, P.-A., 1998. Ballooning spiders caught by a suction trap in an agricultural landscape in Switzerland. In: Selden, P.A. (Ed.), Proceedings of the 17th European Colloquium on Arachnology: 1997, Edinburgh. British Arachnological Society, Burnham Beeches, pp. 177–186.
Crawley, M.J., 1993. GLIM for Ecologists. Blackwell Scientific Publications, London.
De Keer, R., Maelfait, J.-P., 1988. Observations on the life cycle of Erigone atra(Araneae, Erigoninae) in a heavily grazed pasture. Pedobiologia 32, 201–212.
Downie, I.S., Abernethy, V.J., Foster, G.N., McCracken, D.I., Ribera, I., Waterhouse, A., 1998. Spider biodiversity on Scottish agricultural land. In: Selden, P.A. (Ed.), Proceedings of the 17th European Colloquium on Arachnology: 1997, Edinburgh. British Arachnological Society, Burnham Beeches, pp. 311–317. Downie, I.S., Coulson, J.C., Butterfield, J.E.L., 1996. Distribution
and dynamics of surface-dwelling spiders across a pasture-plantation ecotone. Ecography 19, 29–40.
Downie, I.S., Wilson, W.L., Abernethy, V.J., McCracken, D.I., Foster, G.N., Ribera, I., Waterhouse, A., Murphy, K.J., 1999. The impact of different agricultural land-uses on epigeal spider biodiversity in Scotland. J. Insect Conserv. 3, 275–288. Duffey, E., 1956. Aerial dispersal in a known spider population. J.
Anim. Ecol. 25, 85–111.
Duffey, E., 1978. Ecological strategies in spiders including some characteristics of species in pioneer and mature habitats. Symp. Zool. Soc. Lond. 42, 109–123.
Edwards, C.A., Butler, C.G., Lofty, J.R., 1976. The invertebrate fauna of the Park Grass Plots II. Surface fauna. Report of the Rothamsted Experimental Station, 1975(2), 63–89.
Feber, R.E., Bell, J., Johnson, P.J., Firbank, L.G., Macdonald, D.W., 1998. The effects of organic farming on surface-active spider (Araneae) assemblages in wheat in southern England, UK. J. Arachnol. 26, 190–202.
Forbes, T.D.A., Hodgeson, J., 1985. The reaction of grazing sheep and cattle to the presence of dung from the same or other species. Grass Forage Sci. 40, 177–182.
Frame, J., 1992. Improved Grassland Management. Farming Press, Ipswich.
Geiger, R., Aron, R.H., Todhunter, P., 1995. The climate near the ground. Friedr. Vieweg & Sohn Verlagsgesellschaft mbH, Braunschweig/Wiesbaden.
Gilpin, M., Hanski, I., 1991. Metapopulation dynamics: empirical and theoretical investigations. Biol. J. Linn. Soc. 42(1) & (2), Academic Press, London.
Grant, S.A., Suckling, D.E., Smith, H.K., Torvell, L., Forbes, T.D.A., Hodgeson, J., 1985. Comparative studies of diet selection by sheep and cattle: the hill grasslands. J. Ecol. 73, 987–1004. Halley, J.M., Thomas, C.F.G., Jepson, P.C., 1996. A model for the
spatial dynamics of linyphiid spiders in farmland. J. Appl. Ecol. 33, 471–492.
Hänggi, A., Stöckli, E., Nentwig, W., 1995. Habitats of Central European Spiders. Miscellanea Faunistica Helvetiae, No. 4. Centre Suisse de Cartographie de la Faune, Neuchâtel. Luff, M.L., Rushton, S.P., 1989. The ground beetle and spiders fauna
of managed and unimproved upland pasture. Agric. Ecosyst. Environ. 25, 195–205.
McLaughlin, A., Mineau, P., 1995. The impact of agricultural practices on biodiversity. Agric. Ecosyst. Environ. 55, 210–212. McFerran, D.M., Montgomery, W.I., McAdam, J.H., 1994. The
impact of grazing on communities of ground-dwelling spiders (Araneae) in upland vegetation types. Proc. R. Irish Acad. 94b, 119–126.
Nolan, T., Connolly, J., 1977. Mixed stocking by sheep and steers — a review. Herb. Abstr. 47, 367–374.
Reichart, S.E., Lockley, T., 1984. Spiders as biological control agents. Annu. Rev. Entomol. 29, 299–320.
Roberts, M.J., 1987. The spiders of Great Britain and Ireland, Vol. 2, Linyphiidae. Harley Books, England.
Rushton, S.P., 1988. Castor Highlands National Nature Reserve, Cambridgeshire, UK. Biol. Conserv. 46, 169–182.
Rushton, S.P., Topping, C.G., Eyre, M.D., 1987. The habitat preferences of grassland spiders as identified using Detrended Correspondence Analysis (DECORANA). Bull. Br. Arachnol. Soc. 7, 165–170.
Snazell, R., 1980.Erigone aletrisCrosby and Bishop, a spider new to Britain. Bull. Br. Arachnol. Soc. 5, 97–100.
Stewart, J., 1997.Erigone aletrisCrosby & Bishop, 1928 range extension in SE Scotland. Newsl. Br. Arachnol. Soc. 78, 4. Sunderland, K.D., Fraser, A.M., Dixon, A.F.G., 1986. Distribution
of linyphiid spiders in relation to capture of prey in cereal fields. Pedobiologia 29, 367–375.
Thomas, C.F.G., Jepson, P.C., 1997. Field-scale effects of farming practices on linyphiid spider populations in grass and cereals. Entomol. Exp. Appl. 84, 59–69.
Thomas, C.F.G., Jepson, P.C., 1999. Differential aerial dispersal of linyphiid spiders from a grass and a cereal field. J. Arachnol. 3, 294–300.
Toft, S., Riedel, W., 1995. Arthropod natural enemies in arable land 1. Density, spatial heterogeneity and dispersal. Aarhus University Press, Denmark.
Topping, C.J., Lövei, G.L., 1997. Spider density and diversity in relation to disturbance in agroecosystems in New Zealand, with a comparison to England. New Zealand J. Zool. 21, 121– 128.
Topping, C.J., Sunderland, K.D., 1992. Limitations to the use of pitfall traps in ecological studies exemplified by a study of spiders in a field of winter wheat. J. Appl. Ecol. 29, 485–491.
Vallentine, J.F., 1990. Grazing management. Academic Press, London.
Weyman, G.S., Sunderland, K.D., Fenlon, J.S., 1994. The effect of food deprivation on ballooning behaviour inErigonespp. spiders (Araneae, Linyphiidae). Entomol. Exp. Appl. 73, 121– 126.
Weyman, G.S., Jepson, P.C., Sunderland, K.D., 1995. Do seasonal changes in numbers of aerially dispersing spiders reflect population density on the ground or variation in ballooning motivation? Oecologia 101, 487–493.