Standardized precipitation index and nitrogen rate effects on
crop yields and risk distribution in maize
C.F. Yamoah
a,1, D.T. Walters
a, C.A. Shapiro
b,2, C.A. Francis
a,∗, M.J. Hayes
c,3aDepartment of Agronomy, University of Nebraska, Lincoln, NE 68583-0949, USA bHaskell Agricultural Laboratory, University of Nebraska, Concord, NE 68728, USA
cSchool of Natural Resource Sciences, 239 L.W. Chase, University of Nebraska, Lincoln, NE 68583-0728, USA
Received 9 March 1999; received in revised form 5 January 2000; accepted 25 January 2000
Abstract
Crop performance in rainfed cropping systems generally is dependent on rainfall amount and distribution. The objective of this study was to analyze the long-term consequences of rainfall expressed as a standardized precipitation index (SPI) and fertilizer nitrogen (N) on yields and risk probabilities of maize in the udic-ustic moisture regimes in the Great Plains in Nebraska. The SPI is a precipitation index for classifying drought stress conditions. The study was conducted on a Kennebec silt loam (Cumulic Hapludoll) over an 11-year period, 1986–1996, using monoculture maize (Zea mays L.) and maize in rotation with soybean (Glycine max.(L.) Merr.) in combination with N fertilizer levels between 0 and 160 kg ha−1. Maize yields in
monoculture ranged from 4.8 to 5.7 Mg ha−1, and from 6.4 to 6.8 Mg ha−1in rotation. The differences in yields between
monoculture and rotation were larger at low N rates and decreased as N fertilizer increased above 40 kg ha−1. Current year’s
maize yields either exhibited a weak or no response to N fertilizer in years when the preceding preseason (October–April) and the previous growing season (May–August) were dry (negative SPI value). Regression of yield as the dependent variable and the 12-month April SPI as the independent variable explained up to 64% of yield variability in a curvilinear relationship. Optimum SPI values were in the range of−1.0 to 1.0, substantiating the adaptability and performance of crops under mild stress as proposed by other scientists. Prediction of subsequent yields using past SPI data was relatively better in rotations (R2=41–50%) than in monoculture (R2=15–40%). Risk, calculated as the lower confidence limit of maize returns over
variable cost of fertilizer, was less in rotations than in monoculture, and in both cropping systems returns were maximized with the application of N fertilizer at 40 kg ha−1. Used with other criteria, the SPI can be a practical guide to choice of crops,
N levels, and management decisions to conserve water in rainfed systems. © 2000 Elsevier Science B.V. All rights reserved.
Keywords: Climate; Crop rotations; Rainfed cropping systems; Risk analysis; Nebraska USA
∗Corresponding author. Tel.:
+1-402-472-1581; fax:+1-402-472-4104.
E-mail addresses: [email protected] (C.A. Shapiro),
[email protected] (C.A. Francis), [email protected] (M.J. Hayes)
1Present address: Council for Scientific & Industrial Research,
Soil Institute, Accra Centre, Ghana.
2Tel.:+1-402-584-2803; fax:+1-402-584-2859. 3Tel.:+1-402-472-4271; fax:+1-402-472-6614.
1. Introduction
Agricultural success in non-irrigated cropping sys-tems depends on efficient use of precipitation. Farmer decisions on which crops to plant and cultural prac-tices such as mulching or reduced tillage that conserve soil moisture are determined in part by rainfall up to planting time. Crop rotations and multiple cropping
systems that include two or more crops grown on a parcel of land may exploit moisture at different soil depths (Francis, 1989). Rotational systems use wa-ter more efficiently than monocrops (Pierce and Rice, 1988; Campbell et al., 1990; Varvel, 1994). These are practical options available to farmers in the udic-ustic moisture regimes in the Great Plains.
Halvorson (1990) compared adequately fertil-ized 3-year and annual crop rotations with a wheat (Triticum aestivum L.)-fallow rotation and found the former more profitable. Different crops and crop-ping systems have been shown to exhibit marked differences in efficiency of water use. Varvel (1994)
reported precipitation use efficiency (PUE) of
36–137 kg ha−1cm−1 for continuous maize as
com-pared with 57–165 kg ha−1cm−1 in maize–soybean
rotations. Varvel (1995) also found that PUE for
soy-bean averaged 30 kg ha−1cm−1, whereas sorghum
(Sorghum bicolor (L.) Moench) was 89 kg ha−1cm−1 during an 8-year period. Interactions between precip-itation and N rates are well documented. These sev-eral factors may influence the differences in rainfall use between monoculture maize and maize–soybean rotations.
The purpose of this study was to evaluate the ef-fects of the standardized precipitation index and N rate on yields and risk of maize-based cropping systems, as measured by maize yields, under limited-rainfall conditions in northeast Nebraska. The goal was to provide farmers with practical guidelines on nitrogen application according to preseason rainfall, based on long-term experimental results. Most empirical stud-ies of precipitation use efficiency and N-use include only short-term datasets, whereas the results reported here are based on 11-year experimental results.
2. Materials and methods
2.1. Field experiment
The study was conducted from 1986 to 1996 at the University of Nebraska Northeast Research and Extension Center near Concord. The soil is a
Ken-nebec silt loam with average organic matter=4.1%,
pH=5.7, exchangeable soil K=0.13 cmol kg−1, and Bray P1 extractable P=40.1 ppm. Mean rainfall in this site is 610 mm per year. The experiment design was a
split-plot factorial with four replications. Main treat-ments were tillage: spring no-till, spring plow, and disk; subplots were rotation: maize–soybean rotation and continuous maize; sub-subplots were five N rates (0, 40, 80, 120 and 160 kg ha−1) broadcast pre-plant as ammonium nitrate (33-0-0) to maize crops only. This corresponds to normal farmer practice in the area, al-though a delay in application of part of the required N fertilizer may be a more efficient practice. No fertilizer was applied in 1989 because a severe drought in 1988 (average maize yield=2.7 Mg ha−1) resulted in soil ni-trate concentrations exceeding 250 kg N ha-m−1. Al-though soil moisture storage and crop water use are dependent on many factors, precipitation and soil N status are the two that were studied in this experiment. Maize (Pioneer hybrid ‘3575’, 100-day relative ma-turity) was seeded in early May each year at approx-imately 45,400 plants ha−1. Seeding rate of soybean (‘Century 84’) was 90 kg ha−1. Herbicides were used to control weeds using current recommendations. Maize was harvested by hand around 1 October and soybean was combine-harvested 1 week later. Treat-ments were compared using analysis of variance with a minimum significant different criterion set at the 0.05 probability level. Years were used as replications with each data point the mean of four replications in each year and treatment.
2.2. Risk analysis
Probabilities of risk associated with maize incomes were examined only for the period between 1986 and 1996, a decade of highly variable rainfall. Risk can be quantified by determining the lowest expected yield or income at a given level of probability using confidence intervals. Yield and income uncertainties or risk levels were calculated as the lower confidence limit of the mean yields and net returns according to the formula:
Risk=Y−(tdf=n−1)(Sd) n1/2
cost of N fertilizer (V) for maize production, i.e. Returns=(Yc×Pc)−(Vc). In computation of returns, the variable cost of fertilizer at US$ 0.33 kg−1 and assumed other costs such as land preparation, her-bicides, and insecticides were the same for both cropping systems. Input costs were based on current prices and cropping practices in Nebraska (Selley et al., 1996).
2.3. Effects of the SPI on yields
Rainfed farming in northeastern Nebraska is not entirely dependable without supplemental irrigation (Peterson et al., 1990). As both soil water storage and crop water use are influenced by precipitation, the SPI model (McKee et al., 1993) was applied to predict current year yield from previous years’ rain-fall events. Precipitation is not normally distributed, therefore, absolute rainfall values are usually more poorly correlated with yields than when rainfall val-ues are standardized (McKee et al., 1993; Teigen and Thomas, 1995). Calculation of the SPI requires a long-term monthly precipitation data base with 30 years or more of data. The probability distribution function is determined from the long-term records by fitting a Gamma function to the data (Mood and Graybill, 1963). The cumulative distribution is then transformed using equal probability to a normal dis-tribution with a mean of 0 and a standard deviation of 1 (Edwards and McKee, 1997). A particular precipita-tion total for a specified time period corresponds to an SPI value consistent with the probability of that pre-cipitation value occurring. Positive SPI values signify greater than median precipitation, whereas negative values signify less than median precipitation. An SPI of 0 indicates average conditions and values greater than +2 or less than −2 generally indicate extreme conditions associated with events that occur only 5% of the time. Obviously, current year precipitation is a very important determinant of maize yield; however, this study takes into account precipitation from the previous growing season and the intervening fallow months before planting. Growing season precipita-tion in this region is insufficient for full expression of maize yield potential and soil water storage is an important component of total crop water supply. Pre-season precipitation would then provide an effective estimate of potential soil water storage at the start of
the current growing season. These are the data avail-able to farmers that can influence crop choice and nitrogen application before planting.
3. Results and discussion
3.1. Yields and variability
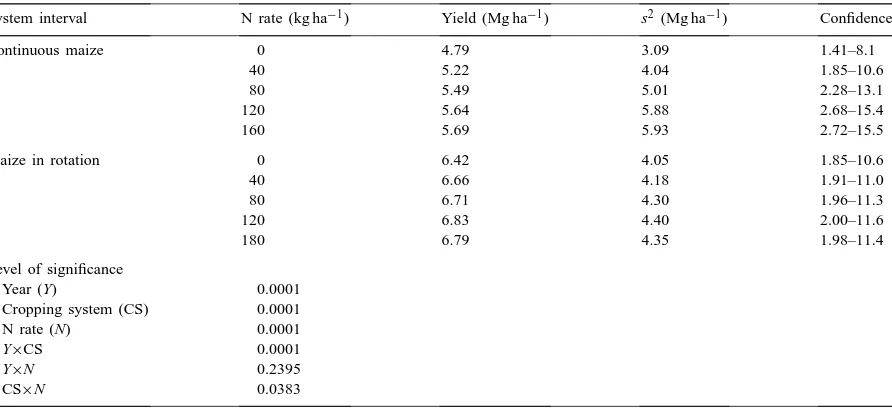
Table 1 shows the effect of N fertilizer and crop-ping systems on maize yields and variability across 11 years. As expected, maize yields in rotations with soy-bean were higher (P=0.0001) than maize yields in the monoculture system. The yield ranges for monocul-ture were 4.8–5.7 Mg ha−1, and for maize in rotation yields ranged between 6.4 and 6.8 Mg ha−1. The vari-ability as indicated by variance (s2) and the confidence intervals of variances were larger in monoculture maize than maize in rotation. There was a significant
interaction (P=0.04) between cropping systems and
N rate. Yield differences between rotation and mono-culture were larger at lower N rates (0–40 kg ha−1) and narrowed as N fertilizer rate increased, indicat-ing that physiological N use efficiency or N recovery efficiency was not the same between rotations.
3.2. Effect of SPI on maize response to N
Table 1
Cropping systems and N rate effects on maize yield and its variability (s2) over a 11-year period (1986–1996) in Nebraska
System interval N rate (kg ha−1) Yield (Mg ha−1) s2 (Mg ha−1) Confidence
Continuous maize 0 4.79 3.09 1.41–8.1
40 5.22 4.04 1.85–10.6
80 5.49 5.01 2.28–13.1
120 5.64 5.88 2.68–15.4
160 5.69 5.93 2.72–15.5
Maize in rotation 0 6.42 4.05 1.85–10.6
40 6.66 4.18 1.91–11.0
80 6.71 4.30 1.96–11.3
120 6.83 4.40 2.00–11.6
180 6.79 4.35 1.98–11.4
Level of significance
Year (Y) 0.0001
Cropping system (CS) 0.0001
N rate (N) 0.0001
Y×CS 0.0001
Y×N 0.2395
CS×N 0.0383
Response of maize to N fertilizer in continuous maize was high when SPI was positive. Nitrogen fertil-izer accounted for 80–97% of the variability of maize yields during 1986, 1992, 1993 and 1994 (Table 2). On the contrary, R2-values for maize response in ro-tations for the same years were low and explained only 55–72% of the variability, not significant at the 5% probability level (Table 2). The lack of response to N fertilizer of maize in soybean–maize rotation is
Table 2
Maize yield response to N fertilizer under different preseason moisture conditions over an 11-year period (1986–1996) in Nebraska Year Standardized precipitation index Maize response to increasing N rate, R2 (significance level)
5-month SPIa 7-month SPIb Continuous maize Maize rotation with soybean
1986 0.58 0.88 0.80 (p=0.041) 0.55 (p=0.340)
1987 −0.01 0.06 0.35 (p=0.295) 0.46 (p=0.205)
1988 −0.59 −0.98 0.62 (p=0.111) 0.54 (p=0.157)
1989 −1.92 −1.58 0.01 (p=0.852) 0.22 (p=0.427)
1990 −0.94 −1.18 0.32 (p=0.320) 0.02 (p=0.810)
1991 −0.63 −0.08 0.02 (p=0.814) 0.54 (p=0.156)
1992 1.41 0.70 0.97 (p=0.002) 0.72 (p=0.066)
1993 1.21 1.07 0.97 (p=0.002) 0.58 (p=0.132)
1994 0.49 −0.08 0.90 (p=0.013) 0.62 (p=0.116)
1995 0.65 0.79 0.28 (p=0.363) 0.36 (p=0.285)
1996 −0.20 −0.68 0.86 (p=0.022) 0.48 (p=0.193)
aThe 5-month standardized precipitation index (SPI) was based on rainfall from 1 May to 30 September of the previous growing season. bThe 7-month standardized precipitation index (SPI) was based on rainfall from 1 October of the previous season to 31 April in the
current preseason.
common (Varvel, 1994; Green and Blackmer, 1995) and may be caused by the soil ameliorative effects of legume–cereal rotational systems such as N trans-fer during the soybean year. In addition, the non-soil related factors such as the reduction of insects and pathogens that are reduced by rotations may improve yields.
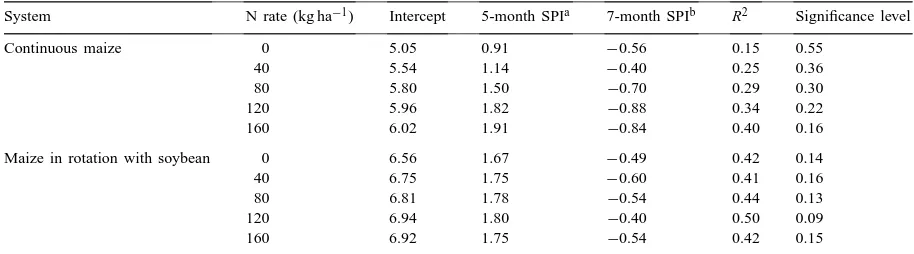
Table 3
Regression equations estimating current maize yields from previous rainfall records
System N rate (kg ha−1) Intercept 5-month SPIa 7-month SPIb R2 Significance level
Continuous maize 0 5.05 0.91 −0.56 0.15 0.55
40 5.54 1.14 −0.40 0.25 0.36
80 5.80 1.50 −0.70 0.29 0.30
120 5.96 1.82 −0.88 0.34 0.22
160 6.02 1.91 −0.84 0.40 0.16
Maize in rotation with soybean 0 6.56 1.67 −0.49 0.42 0.14
40 6.75 1.75 −0.60 0.41 0.16
80 6.81 1.78 −0.54 0.44 0.13
120 6.94 1.80 −0.40 0.50 0.09
160 6.92 1.75 −0.54 0.42 0.15
aThe 5-month standardized precipitation index (SPI) was based on rainfall from 1 May to 30 September of the previous growing season. bThe 7-month standardized precipitation index (SPI) was based on rainfall from 1 October of the previous season to 31 April in the
current preseason.
cultivars or hybrids that are more responsive to N fertilization. Such farmers may apply high N rates (about 80–120 kg ha−1) and expect to get high yields in monoculture when both the previous crop season and the current preseason moisture are high, e.g. pos-itive SPI value. It would be advisable to use less N fertilizer (<100 kg ha−1) for maize in rotation to re-duce cost and prevent excessive leaching of nitrate under similar climate conditions. Also, farmers may avoid growing maize and plant a more drought tolerant crop such as sorghum when the previous season and pre-plant moisture conditions are below average, as noted in an earlier study in eastern Nebraska (Yamoah et al., 1998).
3.3. Estimation of yields from previous moisture conditions
The objective in relating SPI as a function of yield is to advise farmers on adjusting their cropping plans ahead of time to maximize returns or reduce costs. Table 3 shows regression equations predicting yields from past rainfall events. Evidently, predictions were better in rotations than in continuous maize using the R2value as indicator of predictive power. The R2 val-ues in monoculture varied from 15 to 40%; the respec-tive range in rotations was 41–50% and none were sig-nificant at the 5% level of probability. The fact that R2 increased as N rate increased indicates that SPI works best in predicting yield when N is non-limiting with optimum management practices as alluded to by Dirks
and Bolton (1981). Given the importance of food pro-duction on a global scale, it would seem rational to accept significance levels identified by maize in rota-tion for previous moisture alone, recognizing that fer-tilizers, cultivars, management, and other variables are equally important factors that may contribute to the variability in yields.
Among the predictor variables, the 5-month September SPI was found to be relatively more im-portant (t-value not shown) than the 7-month April SPI. Agronomically, moisture status at the end of the previous growing season is most critical for the next crop because it controls mineralization of residues if the soil surface is not frozen. Usually loss of soil moisture through evapotranspiration is small during winters and in addition snow may contribute to the soil moisture reserve as well. It appears that 5-month SPI governs water deficit and that 7-month SPI is a much weaker predictor because loss of water dur-ing the 7 months is not well described by a simple 7-month index.
3.4. Effect of SPI and N on yields
Fig. 1. The 12-month standardized precipitation index (SPI) (May–April) effect on yields of non-fertilized maize in monoculture and in rotation with soybean.
(fertilized as an average of all N rates and unfer-tilized) (Figs. 1 and 2). The 12-month April SPI alone explained about 60% of variation in maize yields in non-fertilized soybean–maize rotations and almost 50% of maize yields in non-fertilized monoculture systems (Fig. 1). Similarly, precipi-tation accounted for 64 and 51%, respectively, of
Fig. 2. The 12-month standardized precipitation index (SPI) (May–April) effect on yields of fertilized maize in monoculture and in rotation with soybean.
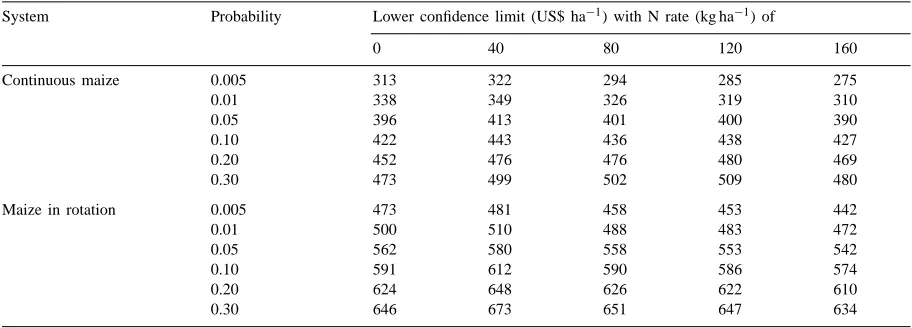
Table 4
Risk analysis of maize returns in continuous and rotational systems
System Probability Lower confidence limit (US$ ha−1) with N rate (kg ha−1) of
0 40 80 120 160
Continuous maize 0.005 313 322 294 285 275
0.01 338 349 326 319 310
0.05 396 413 401 400 390
0.10 422 443 436 438 427
0.20 452 476 476 480 469
0.30 473 499 502 509 480
Maize in rotation 0.005 473 481 458 453 442
0.01 500 510 488 483 472
0.05 562 580 558 553 542
0.10 591 612 590 586 574
0.20 624 648 626 622 610
0.30 646 673 651 647 634
3.5. Risk of production and income
The objective of the risk analysis is to provide infor-mation and potential tools that can be used by farm-ers to make decisions based on their specific circum-stances. Table 4 shows risk analysis of maize returns over variable cost of fertilizer N. Overall, risks are lower in rotations than for maize in monoculture. For instance, at the 5% probability level maize returns over variable costs of 40 kg N ha−1 were US$ 413 ha−1
for monoculture compared with US$ 580 ha−1 in
ro-tations. Practically, this implies that profit from maize when grown in rotation with soybean will be at least
US$ 580 ha−1 in 95 out of 100 years compared with
US$ 413 ha−1 for monoculture. Risk seemed to
in-crease as N rate inin-creased above 40 kg ha−1especially for the rotation system. However, producers who are less risk averse would be prone to increase fertilization rate up to 120 kg N ha−1under monoculture (contin-uous) maize. Application of 160 kg ha−1fertilizer in both monoculture and rotations tended to be riskier, probably arising from year-to-year weather fluctua-tions, vis-a-vis the cost of fertilizer. In drought years, maize returns over cost of N fertilizer may be expected to decrease with increasing rates of applied N.
4. Conclusions
Farmers in Nebraska often make crop, cultivar, rota-tion, and nitrogen application decisions based on past
experience and the results of the preceding year’s crop performance. There are few quantitative tools avail-able to better summarize recent weather data and how this information could be used to make rational deci-sions for the coming cropping season. The SPI takes into account the previous year’s precipitation as well as long-term average for a given site, and allows the farmer to add this information to other current data such as crop prices and prospects, soil test N levels, characteristics of newly-available crop cultivars, and options for crop rotation.
The experiment comparing monoculture (continu-ous) maize with maize in rotation with soybean over 11 years showed that yields are higher and relatively more stable in the rotation system. Optimum conditions and highest maize yields were observed when the SPI was
between −1.0 and +1.0, indicating conditions with
Acknowledgements
Joint contribution of the Department of Agron-omy and the School of Natural Resource Sciences, University of Nebraska, Lincoln. Journal Series No. 12548, Agricultural Research Division, University of Nebraska, Lincoln, NE, USA.
References
Campbell, C.A., Zentner, R.P., McConkley, B.G., Selles, F., 1990. Snow and fertilizer management for spring wheat in southern Saskatchewan. In: Proc. Great Plains Conservation Tillage Symposium, 21–23 August. Bismark, ND, USA.
Dirks, V.A., Bolton, E.F., 1981. Climatic factors contributing to year-to-year variation in grain yield of corn on Brookston clay. Can. J. Plant Sci. 61, 293–305.
Edwards, D.C., McKee, T.B., 1997. Characterization of 20th century drought in the United States at multiple time scale. Climatology Report Number 97-2. Department of Atmospheric Science, Colorado State University, Fort Collins, CO, USA.
Francis, C.A., 1989. Biological efficiencies in multiple-cropping systems. Advances Agron. 42, 1–37.
Green, C.J., Blackmer, A.M., 1995. Residue decomposition effects on nitrogen availability to corn following corn or soybean. Soil Sci. Am. J. 59, 1065–1070.
Halvorson, A.D., 1990. Cropping systems and N fertilizer for efficient water use in the great plains. In: Proc. Great Plains Conservation Tillage Symposium, 21–23 August. Bismark, ND, USA.
Hildebrand, P.E., Russell, J.T., 1996. Adaptability Analysis: a Method for the Design, Analysis, and Interpretation of On-farm Research-Extension. Iowa State University Press, Ames, IA, USA.
McKee, T.B., Doeskin, N.J., Kleist, J., 1993. The relationship of drought frequency and duration to time scales. In: Proc. 8th Conference on Applied Climatology, 17–22 January. Anaheim, CA, USA, pp. 179–184.
Mood, A.M., Graybill, F.A., 1963. Introduction to the Theory of Statistics, 2nd Edition. McGraw-Hill, New York, NY, USA. Peterson, T.A., Shapiro, C.A., Flowerday, A.D., 1990. Rainfall and
previous crop effects on crop yields. Am. J. Altern. Agric. 5, 33–37.
Pierce, F.J., Rice, C.W., 1988. Crop rotation and its impact on efficiency of water and nitrogen use. In: Hargrove, W.L. (Ed.), Cropping Strategies for Efficient Use of Water and Nitrogen, Special Publication 51. Am. Soc. Agron., Madison, WI, USA, pp. 21–42.
Selley, R.A., Bitney, L.L., Clark, R.T., Jose, H.D., Holman, T., Klein, R.N., Massey, R.E., 1996. Nebraska Crop Budgets. Nebraska Cooperative Extension, EC96-872S, p. 129. Teigen, L.D., Thomas Jr., M., 1995. Weather and yield, 1950–94:
relationships, distributions, and data. Commercial Agriculture Division, Economic Research Service, U.S. Department of Agriculture, Staff Paper No. 9527.
Varvel, G.E., 1994. Monoculture and rotation systems effects on precipitation use efficiency of corn. Agron. J. 86, 204–208. Varvel, G.E., 1995. Precipitation use efficiency of soybean and
grain sorghum in monoculture and rotation. Soil Sci. Soc. Am. J. 59, 527–531.