3D MODELLING OF
TROMPE L’OEIL
DECORATED VAULTS USING DENSE
MATCHING TECHNIQUES
F. Chiabrando b, A. Lingua b, F. Noardo b, A. Spanò a
a
Politecnico di Torino, Dipartimento di Architettura e Design, Viale Mattioli 39, 10125 Torino, Italy - [email protected]
b Politecnico di Torino, Dipartimento di Ingegneria dell'Ambiente, del Territorio e delle Infrastrutture, , Corso Duca degli Abruzzi 24, 10129 Torino, Italy - (filiberto.chiabrando, andrea.lingua, francesca.noardo)@polito.it
KEY WORDS: Image matching, digital photogrammetry, area-based-matching, feature-matching, TLS, 3D models, Cultural Heritage
ABSTRACT:
Dense matching techniques, implemented in many commercial and open source software, are useful instruments for carrying out a rapid and detailed analysis of complex objects, including various types of details and surfaces. For this reason these tools were tested in the metric survey of a frescoed ceiling in the hall of honour of a baroque building. The surfaces are covered with trompe-l’oeil paintings which theoretically can give a very good texture to automatic matching algorithms but in this case problems arise when attempting to reconstruct the correct geometry: in fact, in correspondence with the main architectonic painted details, the models present some irregularities, unexpectedly coherent with the painted drawing. The photogrammetric models have been compared with data deriving from a LIDAR survey of the same object, to evaluate the entity of this blunder: some profiles of selected sections have been extracted, verifying the different behaviours of the software tools.
1. INTRODUCTION
Today the need for a digital metric survey which is even more suitable for acquiring 3D data and consequently for generating 3D detailed models obliges the operators responsible for the documentation and preservation of Cultural Heritage to deal with the methodology and techniques developed for 3D data recording. The two most common techniques used for 3D data acquisition are represented by the Terrestrial Laser Scanner (TLS, active sensor) and digital photogrammetry (passive sensor) which are more and more frequently used in dense matching techniques.
Many tests and studies have been successfully carried out on the TLS and the pro and cons are well known in the scientific community as well as the obtainable products. One of the main problems observed when using TLS for carrying out an analysis is the cost (unfortunately even if it is less compared to the 90s, it still costs around 50 kEuro). Moreover the integration of high resolution images and point cloud in a single instrument is not yet available and the post-processing fusion is very time consuming.
On the other hand, thanks to the boost of the computer vision researchers, image matching techniques have led to the development of low cost and open-source semi-automatic software that enable us to extract metrically-reliable 3D informations from digital images with high resolution or acquired from low cost cameras as well.
3D modelling deriving from this kind of digital survey (both active or passive sensors) are deemed to provide more details and appear to be quicker than other survey systems. These models enable us to obtain shape documentation and thematic characterizations which are more sustainable in terms of costs (especially when using the digital photogrammetry techniques) and regarding the amount of available information compared to that obtained from other systems. Following the digital
revolution, the traditional models on architectural representation has carefully reassigned with a renewed aims improved by 3D continuous models. The traditional mainstream models, plans, front and cross sections, 3D models generated by plane entities, rotation surfaces or generally surfaces with known equations, can obviously furthermore be textured by orthoimages. They differ to those derived from digital survey due to the totally manual generation, adding to minor accuracy and lower adjacency to real objects.
Starting from the aforementioned assumption, the first part of the paper is a short analysis of the algorithmic aspects of dense matching techniques in order to identify the optimal characteristics of the surfaces in question for carrying out a good and advantageous matching process. In the second part, a description of the case study is reported: the TLS survey and the results obtained, the dense matching approach and the relative products using two different types of software, Photoscan (Agisoft) and MICMAC/Apero (IGN France). Finally the level of accuracy achieved using the techniques proposed and the errors observed are reported in the discussion section.
1.1 Dense matching detectors
Over the last decade the algorithmic aspects linked to image processing techniques in relation to geomatic fields have greatly improved. The MSER: Maximally Stable Extremal Regions (Matas et al., 2002), SIFT: Scale Invariant Feature Transform (Lowe, 2004), SURF: Speed Up Robust Feature (Bay et al., 2006) are the three most important algorithms in digital photogrammetry (structure from motion, dense matching etc.) developed by computer graphic scientists. MSER algorithm extracts a number of covariant regions from an image which are called MSERs: an MSER is a stable connected component of some gray level sets of the image. MSER is based on the idea of taking regions which remain nearly the same through a wide ISPRS Annals of the Photogrammetry, Remote Sensing and Spatial Information Sciences, Volume II-5, 2014
range of thresholds. This operation can be performed by first performs well on images containing homogeneous regions with distinctive boundaries, it works well for small regions but it is detection, keypoint localization, orientation assignment and keypoint descriptor. The first stage used the difference-of-Gaussian function to identify potential points of interest which were invariant to scale and orientation. Difference of Gaussian was used instead of Gaussian to improve the computation speed. In the keypoint localization step, the low contrast points were rejected and the edge response was eliminated. The Hessian matrix was used to compute the principal curvatures and eliminate the key points which have a ratio between the principal curvatures greater than the ratio. An orientation histogram was formed from the gradient orientations of sample points within a region around the keypoint in order to get an orientation assignment (Lowe 2004, Ke and Sukthankar 2004).
The last “main” algorithm developed in this scenario was the SURF. This detector creates a “stack” without 2:1 down
sampling for higher levels in the pyramid resulting in images of the same resolution. Due to the use of integral images, SURF filters the stack using a box filter approximation of second order Gaussian partial derivatives, since integral images allow for the computation of rectangular box filters in near constant time. In the keypoint matching step, the nearest neighbour is defined as the keypoint with the minimum Euclidean distance for the invariant descriptor vector (Bay et al., 2006, Bay et al., 2008). Nowadays the strategy adopted by the principal commercial and non-commercial software are based on SIFT (Bundler, PMVS) or the modified version of SIFT (MICMAC/APERO, MICMAC/APERO and Photoscan, the two software used in this application) the noise is reduced and no artefacts are present in the derived products.
Since several previous studies (Kersten and Lindstaedt, 2012; Abdel-Wahab et al., 2012;Hullo et al. 2009) have shown that Cultural Heritage documentation can be efficiently achieved with these techniques, some tests were carried out using a multi-image matching approach. The test was performed during a survey of a painted vault with internal frescos, in order to have hypothetically better conditions according to the main principle driving the algorithm in the research of tie points: the high radiometric contrast. In other words, a well-textured object (i.e. brick surface rather than plaster surface) represents the optimal conditions.
Since the frescos of this case study are able to deceive the human eye creating the illusion of a much more articulated architecture, these two types of systems were used to test if they
were able to read the geometry of the construction correctly or if they could be influenced by the geometry of the paintings.
2. THE CASE STUDY
The test was carried out on the vault of the hall of honour of the Stupinigi royal estate (TO, Italy). This baroque estate was projected and realized by the architect Filippo Juvarra for the Royal House of Savoy as a country residence for hunting from 1729 onwards (Figure 1).
Figure 1 The Stupinigi royal estate, the hall of honour can be seen in the box.
This is part of a project concerning a series of decentralised residences on the land. The purpose of the Royal House was to be present and influence the territory outside Turin which was the capital of the kingdom. The architectonic complex is composed of several long buildings surrounding a central node: the hall of honour, which is the centre of the symmetric composition and the heart of life on the estate: it was the meeting point for hunting expeditions and the hall used for royal ceremonies. The hall of honour is composed of an oval-based two-floor cylinder, closed by a vault composed of a rib vault in the centre and four bowl-shaped vaults linked together by plane surfaces and arcs. The hall is decorated with frescoes of the hunting goddess Diana who triumphs in trompe-l’oeil technique painted architectonical frame. The painted architecture consists in a series of cornices, moldings and plaster decorations which surround the main scenes, ceiling coffer decorations on the arcs between the vaults and some bas-relief medallions at the corners of the central vault (Figure 2).
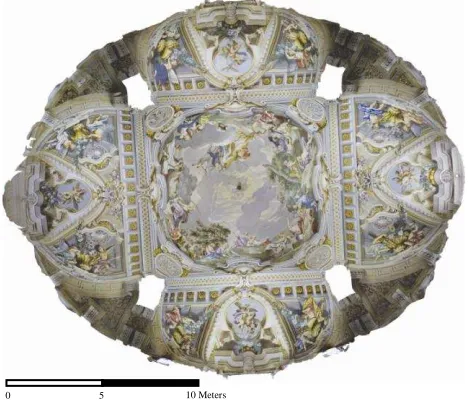
Figure 2 Orthophoto of the hall 5
0 10 Meters
Moreover, most of the architectonical elements in the hall (columns, capitals, friezes, and so on) are not sculpted but the relief is painted onto a smooth, plastered surface. The frescoes were painted by the Valeriani brothers from Venice, under the direction of the architect – scenographer Filippo Juvarra: he defined the decorations and supervised the painting of the frescoes as established in the convention between painters and commissioners in 1731. Juvarra’s scenographic technique evolved from the theories of Pozzo and later Bibiena to a new kind of representation using discontinued points of view for a more dynamic effect. As we can observe from the details of the painting, the transitions between different surfaces of the paintedarchitecture are represented without clear lines by using colour shade and nuance which give a more realistic effect to the human eye and perhaps could create problems for photogrammetry software interpretation as well.
3. DATA ACQUISITION
The Survey Laboratory of Politecnico di Torino – DAD carried out the survey of the hall (resp. arch. A. Spanò), appointed by the Ordine Mauriziano Foundation with the aim of supporting the artistic restoration of the walls and the decoration furnishings.
Detailed metric surveys were carried out with a laser scanner clouds processing and orthophoto applications obtained by digital photogrammetry algorithms. These methods enable us to acquire data rapidly and extract an accurate shape model even for this kind of object which is rich in decoration.
The various data were processed in a unique, local coordinate system using a reference network of 9 points situated in the hall, partly at ground level and partly on the balcony on the first floor. Traditional high-precision total stations were used with redundant and reliable schema of traditional topographic measurements and the network was adjusted using the least squares method in order to reduce instrumental residuals and to control accidental errors. These points were used as the reference for measuring all the Control Point coordinates, both through the positioning of targets and by collimating the natural points on the decorations.
3.1 TLS survey
The LIDAR survey was realized with the terrestrial Laser Scanner Focus3D– CAM 2. 28 scans were performed on three levels: 8 on the ground floor, 12 on the balcony floor and 8 at a middle level, positioning the scanner on scaffolding in order to obtain better recordings of data concerning the decorations and the architectonic order. The scanner used such a resolution that that 10 m far measured points have a mutual distance of 6 mm. Contextually some well-distributed plane targets were placed and measured by means of topographic methods in order to control processing better. The clouds obtained were post-processed using the FARO software SCENE to adjust them to the same reference system, through reference targets, reaching a precision of about 1 cm (Figure 3). The model was meshed using the software 3D Reshaper (Technodigit).
The point cloud obtained was geometrically very satisfactory (the accuracy fulfill the requirements for a 1: 50 representation scale); the good indoor performance of FARO with short distances are indeed well known (Chiabrando and Spanò, 2012). The limitation of this instrument is the low resolution of the integrated camera (7 megapixels) which is sufficient for correct data interpretation and fast visualisation but not for an exhaustive study of architectural cultural heritage. Therefore in a detailed and radiometrically rich context like in this case study
presents, the TLS data must be integrated with high resolution images acquired by means of a photogrammetric approach.
Figure 3 TLS point clouds adjusted in the same coordinate system
3.2 Photogrammetric survey
High resolution photogrammetric images were made of the decorations and decorated surfaces in order to obtain a large-scale model of the decoration details. For this purpose a calibrated photogrammetric Canon EOS-1Ds Mark II camera with the following characteristic was used: Pixel size 7.2 x 7.2 m, Sensor size 24x 36 mm, equipped with a 20 mm focal lens. The vault system was acquired by means of 19 nadir images from scaffolding about 8 meters above the ground floor arranged in the shape of a cross along the two axis of the hall. They overlap each other by about 80-90% and most of the surface is included in more than 9 images (Figure 4).
Figure 4 Camera locations and multiple image overlaps
Some natural points (Figure 5), identified on the decoration drawings, were measured using topographic instrumentation, in order to reference the processing products to the local coordinate system of the whole object.
Figure 5 GCP used for bundle block adjustment
4. DATA PROCESSING
4.1 Image-matching models
The images of the vault were processed using two different software tools: the commercial low-cost software Agisoft Photoscan and the open-source suite Apero – MicMac implemented by IGN. The results were compared both between the softwares and with the TLS measurements in order to evaluate their quality, accuracy and behaviour in the context of trompe-l’oeil frescoes.
4.1.1 Agisoft PhotoScan processing
This is an inexpensive, commercial photogrammetry software which reconstructs 3D coordinates of objects in overlapping photographs and produces a dense point cloud, using the Structure from the Motion (SfM) process developed in computer vision (Koutsoudis, 2013).
The final product is achieved through various steps: firstly PhotoScan detects tie points in the source photos (stable under viewpoint and lighting variations) and generates a descriptor for each point based on its local neighbourhood. In this way it carries out a feature matching across the images similar to the SIFT approach. By later reading the available calibration parameters from the Exif file of the digital image, it uses a algorithm to find the approximate camera locations and then refines them through a bundle-adjustment algorithm. In this way it solves intrinsic and extrinsic orientation, defining camera positions and assets. At this point the software realize a first point cloud describing the relative orientation of aligned photograms.
Some Control Points are introduced in all the images in order to orientate the model in the same reference system and estimate the accuracy of the final output. As reported in Table 2 (1.5 cm), according to the RMS value of reprojection errors it is possible to state that the accuracy of the BBA (Bundle Block Adjustment) results obtained is comparable to the one achieved by TLS point clouds. This was obtained by only considering GCPs with a maximum of 2,5 cm (or 3 pixels) residuals. A strict selection was performed on used GCPs on the vault since they were natural points identified from the details of the frescoes at ground level. The level of accuracy achievable in these conditions, without targets and shaded drawings as reference points, was not optimal. This problem was solved by measuring
the superabundant GCPs in order to be able to select the best. After which the first part of the processing can be run again to obtain the roto-translation of the point cloud in the correct coordinate system.
In the following step, PhotoScan uses the before generated descriptor to detect correspondences of homologous pixels across the photos for a dense point cloud generation, using a multi-view approach (Harwin and Lucieer, 2012). Starting from these points the surface is constructed (Figure 6) probably using traditional triangulation methods. PhotoScan blends source photos to the surface parts for applying a photo texture by forming a texture atlas based on which it exports ortophotos. Table 1 and table 2 show the synthetic results of Photoscan processing.
Number of images: 19
Pose Distance: 14.488 m
GSD 4.4 mm/pix
Coverage area: 385.1 m2
Tie-points: 119951
Extracted points 471409
Table 1 - Results of PhotoScan model construction processing
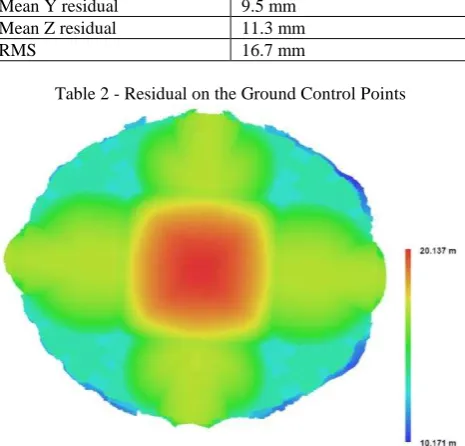
Mean X residual 7.7 mm
Mean Y residual 9.5 mm
Mean Z residual 11.3 mm
RMS 16.7 mm
Table 2 - Residual on the Ground Control Points
Figure 6 The digital surface model of the vault
4.1.2 Apero – MicMac processing:
According to the traditional steps of photogrammetric data processing, the pipeline of MicMac firstly consists in all the automated tie-point extractions, after which the bundle adjustment and the camera parameters are computed, moreover a dense image matching for surface reconstruction is realized and finally the orthoimages are generated. The first step is the computation of tie points (TPs) from all pairs of images: a modified version of the SIFT algorithm which is able to work with large images is used for the computation of the TPs (Pierrot-Deseilligny,, Cléry, 2011). The second step is the external orientation (with the camera calibration). This step is usually only performed in local coordinates following which a complete bundle block adjustment is carried out (Figure 7) ISPRS Annals of the Photogrammetry, Remote Sensing and Spatial Information Sciences, Volume II-5, 2014
using GCPs or pose centre coordinates (usually employed in aerial photogrammetry).
Finally multi image matching is performed to generate the dense DSM (Figure 8). MicMac is based on a scale, multi-resolution, pyramidal approach, using an energy minimization function. The orthophoto of each image is also computed during the matching process.
The last step is the generation of the true orthophoto mosaic and the realization of the point cloud (converting an .xml file in to a .ply file).
Figure 7 Screen shot of the computed camera location
Figure 8 Shaded view (left) and 8bit colored DSM (right) achieved using MicMac
The point clouds can be computed with or without colour using the radiometric information extracted from the processed images.
The final result was a complete coloured point cloud, the main characteristics of the results obtained are reported in Tables 3 and 4.
Number of images: 19
Pose Distance: 14.488 m
GSD 4.4 mm/pix
Coverage area: 385.1 m2
Tie-points: 284000
Extracted points 3306000
Table 3 - Results of MicMac model construction processing
Max X residual 6.3 mm
Max Y residual 5.5 mm
Max Z residual 9.3 mm
RMS 14.7 mm
Table 4 – Residual on the Ground Control Points 4.2 Comparing image-matching clouds with TLS model
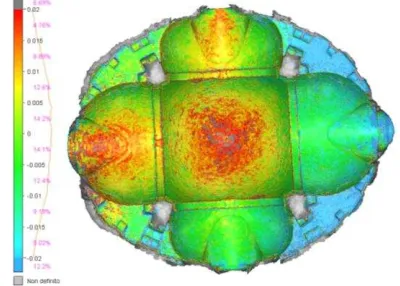
All the point clouds obtained were georeferred through measured GCP in the same reference system, so that it was easy to compare them and integrate them with various data. The two models obtained from the image-matching software tools were reasonably accurate considering the 1:50 representation scale: the maximum differences are inferior to 2 cm in both cases, even if the remaining errors are distributed in different ways, as
shown in Figures 9 and 10. In order to assess this dissimilarity, the 3D models generated by PhotoScan and MicMac were compared to the 3D model triangulated from the LIDAR data in 3D Reshaper; a mapped model was generated for visualizing the differences. The point clouds were then compared with Cloud Compare software and the values reported in Tables 5 and 6 were computed. By observing these maps of differences, we can deduce that the main errors of PhotoScan are distributed symmetrically according to the form of the object, while the main errors of MicMac are possibly influenced by the different lighting arrangement of the vaults. Wide windows on the perimeter between the projections of the pilasters on the wider sides of the oval, disposed symmetrically respect to the major axis of the oval, are the main sources of light.
These windows have an approximate north-south orientation so we can consider that most of the northern portion of the vault is illuminated by natural light. (Figure 10).
Furthermore, the images were acquired on 25th June at 1 pm, and the façade was shaded on one side by the external scaffolding thus the light could be somewhat asymmetrical. This aspect could also explain the major discrepancy of the MicMac model compared to the TLS data (Table 6) relative to the discrepancies of the Photoscan data from TLS point cloud (Table 5). If light strongly influences the texture interpretation in the construction of the model in MicMac, the data can differ significantly to the reference geometry, even if the model was constructed using more tie points for the orientation and a higher number of points were extracted to build the model (Table 3). Further research is required concerning this issue.
Figure 10 - Map of differences between the model from LIDAR data and the model produced by PhotoScan. 3D Reshaper
processing.
Figure 11 - Differences map between the model from LIDAR data and the model produced by MicMac. 3D Reshaper
processing.
Max discrepancy. 48.8 mm
Mean discrepancy 6.3 mm
RMS 5.3 mm
Table 5 - Comparison between the point cloud from LIDAR data and the point cloud produced by PhotoScan. Cloud
Compare processing.
Max discrepancy. 69.1 mm
Mean discrepancy 118.1 mm
RMS 50.1 mm
Table 6 - Comparison between the point cloud from LIDAR data and the point cloud produced by MicMac. Cloud Compare
processing.
From this maps more errors in correspondence with the painted architecture can be seen which led us to investigate this phenomena.
5. ERRORS ON TROMPE L’OEIL FRESCOS
5.1 The instances
On the two meshes obtained with image-matching techniques it is possible to see how some geometry appears in correspondence with the trompe-l’oeil frescoes in which no relief is actually present as confirmed by the comparisons with TLS point clouds (Figure 11-14). This especially occurs in part of the architectonic frame painted in the frescos. The moulders appear as a clearly observable relief which can be seen in the mesh visualisation (Figures 11 and 13).
Figure 12 - Detail of a corner of the PhotoScan model of the central vault
Figure 13 – Detail of a corner of the TLS model of the central vault
As shown in the two models, this geometry is not as noticeable as the design of fresco intended it to be (it does not protrude more than few cm in the model), but it emerges coherently from the background in accordance with the changes of direction of the painted surfaces. This is more evident when observing the extracted sections in 5.2.
Figure 14 - Detail of the MicfMac model of a bowl-shaped vault
Figure 15 - Detail of the TLS model of a bowl-shaped vault
5.2 Fault evaluation on some proposed sections
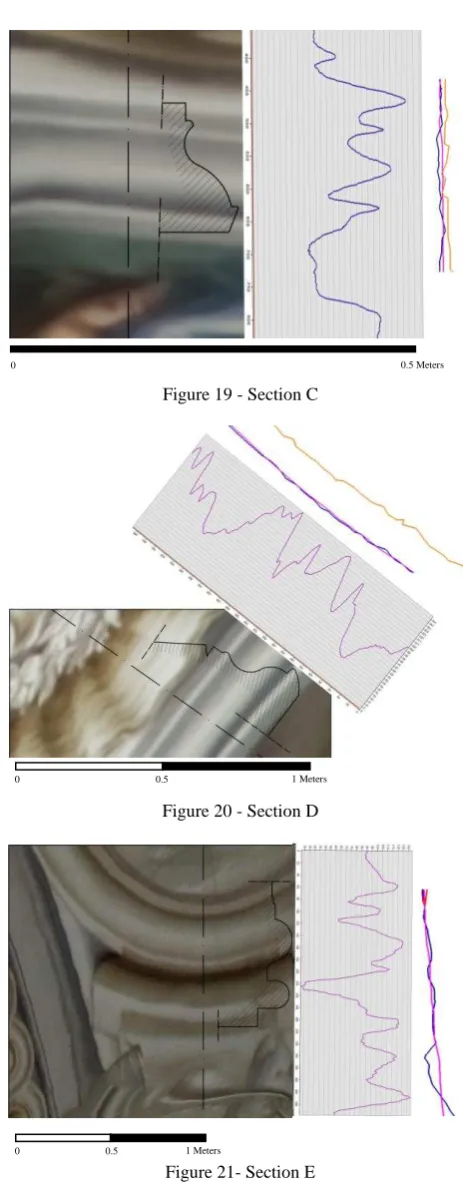
To evaluate this particular error, some sections were selected (Figure 15) in order to compare different profiles: the two section profiles obtained from image-matched meshes (MicMac processing in orange and PhotoScan processing in blue), the profile from the laser scanner survey (in pink) and the graphs of radiometric values coinciding with the selected sections of the images (Figures 16-20).
Figure 16 - Sections reference scheme ISPRS Annals of the Photogrammetry, Remote Sensing and Spatial Information Sciences, Volume II-5, 2014
An ideal shape of the mouldings outlined by the architect was assumed in order to determine if the drawing of the painted architecture of the fresco is related to the shape of the models obtained. The conjectured profiles are reported in the following figures compared to the other sections extracted (from TLS and image-matching models).
The profiles were extracted with 3D Reshaper (Technodigit) software and the radiometric sections were calculated with ESRI ArcMap.
Figure 17 - Section A
Figure 18 - Section B
Figure 19 - Section C
Figure 20 - Section D
Figure 21- Section E
5.3 Results and discussion
According to the results obtained it is clear that both the photogrammetry – image matching softwares are suitable for reconstructing the general geometry although some defects are observed in both cases.
Photoscan without manual instruction is able to produce highly-accurate products and could be a useful tool for inexperienced users but there are few possibilities of customization. This can be a problem, as it is important to obtain detailed information
0 0.5 1 Meters
0 0.5 1 Meters
0 0.5 1 Meters
0 0.5 1 Meters
0 0.5 Meters
concerning data processing, especially when a complete survey is required (various sensors and consequently data fusion). MicMac is more difficult to use but it is able to control processing parameters better and offers a more typical photogrammetric workflow. However the model presents some incongruences with the real object (measured with the TLS point cloud as reference) which may be influenced by the inharmonious lightening. This issue requires further investigation.
A secondary aspect which can be seen by observing the profiles extracted in 5.2 concerning almost every section, is that some deviations of the surface following the painted geometry are evident in the MicMac model (orange profile). This is the case in section A and B. On the other hand, the PhotoScan model (blue profiles) shows some deviation of the main surface but without a clear geometric discontinuity.
By relating the radiometric profiles of the sections to the model profiles, it is possible to state that in cases where there is more contrast between the adjacent zones (shaded or black and white parts), MicMac read a false geometric discontinuity and a shape similar to the painted one was reconstructed in this case (Figure 18). In order to achieve the matching, the standard value of Malt command in MicMac was used without any additional parameters (windows size 5x5, Zstep 0.4, min visible images for the matching 3). PhotoScan is not so susceptible to these variations, even if a change of light in the model profile is, however, noticeable.
Further research is being carried out on this aspect and an in-depth analysis on the several customized parameters of MicMac is ongoing in order to understand if these blunders could be solved by changing the default parameters of the matching.
6. CONCLUSIONS
New image – matching digital photogrammetry software tools are useful for obtaining rapid and inexpensive results thus representing a good solution for analysing many kinds of objects as they can provide us with satisfying outputs even in this case which is characterized by a complex radiometry a great amount of details.
However, when processing painted surfaces, some SfM software tools can mistake the painted geometries for real surfaces or the trompe-l’oeil drawings can disturb the reconstruction of the model. The software does not construct the entire painted object, but the base surface tends to follow the direction of the painted geometry discontinuity especially when there is a strong contrast in colour. This is caused by the painting technique which is not composed of clear lines but some shading nuances to pass from surface to another. Future studies will be focused on other painted surfaces in order to determine and solve the problems related to this aspect.
7. REFERENCES
References from Journals:
Abdel-Wahab, M., Wenzel, K., & Fritsch, D., 2012. Automated and Accurate Orientation of Large Unordered Image Datasets for Close-Range Cultural Heritage Data Recording, Photogrammetrie - Fernerkundung - Geoinformation (PFG). Heft 6(2012), pp. 679-690.
Bay, H., Ess, A., Tuytelaars, T., Van Gool, L., 2008. SURF: Speeded Up Robust Features, Computer Vision and Image Understanding (CVIU), Vol. 110, No. 3, pp. 346—359.
Bay, H., Tuytelaars, T., Van Gool, L., 2006. SURF: Speeded Up Robust Features, In: 9th European Conference on Computer Vision Graz, Austria May 7 - 13, 2006.
Chiabrando F., Spanò A., 2013. Points clouds generation using TLS and dense-matching techniques. A test on approachable accuracies of different tools, Isprs Annals of The Photogrammetry, Remote Sensing and Spatial Information Sciences, Volume II-5/W1,
Chiabrando F., Spanò A., 2012. I sistemi laser scanning nei progetti e percorsi formativi d'Architettura, Bollettino della società italiana di fotogrammetria e topografia, 3, pp. 65-84.
Harwin, S, Lucieer, A, 2012. Assessing the Accuracy of Georeferenced Point Clouds Produced via Multi-View Stereopsis from Unmanned Aerial Vehicle (UAV) Imagery, Remote Sensing, 4, (6) pp. 1573-1599.
Lingua A; Marenchino D; Nex F, 2009. Performance analysis of the SIFT operator for automatic feature extraction and matching in photogrammetric applications. In: SENSORS, vol. 9 n. 5, pp. 3745-3766.
Ke, Y., Sukthankar, R., 2004. PCA-SIFT: A More Distinctive Representation for Local Image Descriptors, Computer Vision and Pattern Recognition
Kersten, T.P., Lindstaedt, M., 2012. Potential of Automatic 3D object reconstruction from multiple Images for applications in Architecture, Cultural Heritage and Archaeology. International Journal of Heritage in the Digita l Era, Multi Science Publishing, pp.399-420.
Koutsoudis A., et al., 2013. Multi-image 3D reconstruction data evaluation, Journal of Cultural Heritage. http://dx.doi.org/10.1016/j.culher.2012.12.003 (02 Feb. 2014)
Lowe, D., 2004. Distinctive Image Features from Scale-Invariant Keypoints, Int. Journal of Computer Vision, Vol. 60, pp. 91-110.
Mikolajczyk, K., Tuytelaars T., Schmid C., Zisserman A., Matas J., Schaffalitzky F., Kadir T., and van Gool L., 2005. A comparison of affine region detectors, IJCV, vol. 65, no. 1/2, pp. 43–72
Vedaldi, A., 2006. An open implementation of the SIFT detector and descriptor. In: UCLA CSD Tech. Report 070012
References from Other Literature:
Farenzena, A. M., Fusiello, A., Gherardi, R., 2009. Structure-and-Motion Pipeline on a Hierarchical Cluster Tree. In: Proceedings of the IEEE International Workshop on 3-D Digital Imaging and Modeling, Kyoto, October 2009.
Forssen P., Lowe D., 2007. Shape descriptors for maximally stable estrema regions. In IEEE ICCV, Rio de Janeiro, Brazil.
Hullo, J.F., Grussenmeyer P., Fares S., 2009. Photogrammetry and dense matching approach applied to the documentation of the cultural heritage site of Kilma (Saudi Arabia). In: 22nd CIPA Symposium, October 11-15, 2009, Kyoto, Japan.
Matas, J., Chum, O., Urban, M., Pajdla, T., 2002. Robust wide baseline stereo from maximally stable extremal regions. In: Proc. of British Machine Vision Conference, pp 384–396.
Pierrot-Deseilligny, M., Cléry, I., 2011. APERO, an Open Source Bundle Adjusment Software for Automatic Calibration and Orientation of a Set of Images. In: Proceedings of the ISPRS Commission V Symposium, Image Engineering and Vision Metrology, Trento, Italy.