Desember 2008. Vol. 7 No. 2. pp. 103 - 112
EVALUASI KINERJA BANK PEMBANGUNAN
DAERAH: CAMEL, DATA ENVELOPMENT
ANALYSIS DAN STOCHASTIC FRONTIER
Marthen Sengkey
Staff Pengajar Fakultas Ekonomi Universitas Klabat
Performance evaluastion is an important factor used in financial institution goal setting and management performance assessment. Traditional tools used by banks to measure their performance are financial ratios such as CAR, profitability ratios, activity ratios etc. However, those ratios are not enough for management to evaluate business performance as a whole. This study used DEA, SFA, and CAMEL to present a general measure of state banking performance. The combination of these three well-known methods for bank’s performance is also supplemented by three statistical approaches such as ANOVA, Spearman rank correlation, and Tobit regression model. The aim of this study is to examine the efficiency performance of Indonesia’s regional development banks, using cross-sectional, and timel series data analyses of 26 regional development banks in Indonesia from 1994-2004 with one output variable, four input variables, and also four exogenous variables. The output variable is total loans, and input variables are (1) total deposits, (2) total operational expenses, (3) capital, and (4) total fixed assets. Other environmental variables (zs) are government intervention, ownership, location of banks, and ABC classification described by Central Bank of Indonesia. The result suggests that financial ratios are not enough indicators of overall bank performance. There is no statistical significant difference between technical efficiency scores of SFA (62.8%), and DEA (38.3%). Bank’s technical efficiency is affected by government intervention, location, ownership, and ABC classification prescribed by bank authority. Except capital to total assets (C/TA) ratio and cash and cash placement to Central Bank and other banks to total deposits and borrowing (CPCBB/TDB) ratio, all of CAMEL ratios were found significantly associated with efficiency estimate of DEA.
The original contributions of the study are as follows: 1. Bank performance measurement by DEA and SFA. 2. Correlates deterministic and stochastic results.
3. Linked the CAMEL; model and DEA results to TOBIT regression.
Keywords: banking performance, CAMEL, data envelopment analysis (DEA), stochastic frontier analysis (SFA), and technical efficiency (TE).
Introduction
Over the past two decades, the measurement of financial institution‟s efficiency using nonparametric frontier models has received considerable attention. Most of studies utilized Data Envelopment Analysis (DEA) to measure bank‟s efficiency: see (Athanassopoulos, 1998), (Zenios, et al., 1999), (Jermic and Vujcic, 2002), (Chien, 2004); (Krishnasamy et al., 2004). Furthermore, previous studies dealt mainly with financial indicators as their performance measures. In economic and management literature, efficiency and financial performance were examined separately and not combined, therefore leaving the issue of linkages between efficiency and financial performance largely unanswered. However, literature using models of accounting and stochastic frontier analysis, accounting and DEA, or DEA and SFA in evaluating the efficiency and productivity of banks are scarce or still un-researched area.
To examine the efficiency performance of Indonesia‟s regional development banks, this study employed DEA and SFA to complement the weaknesses of each model. The combination of these three well-known methods for bank performance, supplemented by other statistical approaches in one study is a gap in the existing banking literature. This is the first study to apply these combined general performance measurements on state-owned banks, particularly in Indonesia.
Theoretical Framework. This study used organization theories to develop such a framework and used that framework to examining the efficiency performance of regional development banks in Indonesia during 1994 through 2004. This theoretical framework was based on theories of state banking, bank
management, financial performance (bank balance sheet; financial ratio analysis; capital adequacy), and productive-efficiency theory and inefficiency.
State Banking Theory. Banks are among the most important financial institutions in the economy. They are the principal source of credit (loanable funds) for millions of households (individuals and families) and for most local units of government (school districts, cities, counties, etc). States that banks are financial-service firms, producing and selling professional management of the public‟s funds as well as performing many other roles in the economy.
During the 1970s, Indonesia‟s state banks benefited from supportive government policies, such as the requirement that the growing state enterprise sector banks solely with state banks. State banks were viewed as agents of development rather than profitable enterprises, and most state bank lending was in fulfillment of government mandated and subsidized programs designed to promote various economic activities, including state enterprises and small-scale pribumi businesses. State bank lending was subsidized through Bank Indonesia, which extended "liquidity credits" at very low interest rates to finance various programs. Total state bank lending in turn represented about 75 percent of all commercial bank lending (U.S. Library of Congress).
State banks will need to undergo sweeping reforms in this new competitive environment, and so will lose significant market share. In Korea, Taiwan, China, Malaysia, Singapore, Indonesia, and India, state-owned banks played a major role in the banking sector in the 1980s and 1990s (Casserley et al., 1999). For instance, in 1997, China‟s Big Four state banks controlled 85 percent of total deposits, and Indonesia‟s five lending state banks had 41 percent of total deposits. In some cases, the state was involved in banking as a critical element of a supply driven economic strategy, where funneling funds to priority industrial sectors was part of centrally controlled economic policy. areas specializing in particular activities, and ally themselves with other entities to extract the value of their customers relationships, and networks without trying to overcome the enormous cultural challenges involved in full change program (Carsserley et al., 1999).
According to Casserley et al., (1999), the world‟s best-performing financial institutions typically demonstrate a number of common characteristics in each area. These characteristics are following: leadership, human resources, risk management, marketing, distribution, and processing. These characteristics are relevant for both state-owned and privately owned banks.
Bank Management. Strong competition among banks encourages the bank‟s management to be more prudent on how to improve their productivity. Hempel et al., (1994) stated that managing a commercial bank promises to be a challenging task. He said that some banks and other depository institutions will fail to face this challenge. Furthermore, there will be numerous acquisitions and mergers in the banking and depository industries. After the financial crisis in1997, many banks, securities firms, and finance companies closed, merged, or effectively withdrew from the market that resulted in loss of jobs for those some people employed in the financial sector in Asian countries (Casserley et al., 1999).
Bank‟s manager has four primary concerns on how to manage bank‟s assets and liabilities in order to earn the highest possible profit. The first is to make sure that bank has enough ready cash to pay its depositors when there are deposits out flows second, the bank Manager must pursue and acceptably low level of risk by acquiring assets that have a low rate of default and by diversifying assets holdings (assets management). The third concern is to acquire funds at low cost (liability management). Finally, they must decide the amount of capital the bank should maintain and then acquire the needed capital (capital adequacy management) (Mishkin, 2003).
Risky assets may provide bank with higher earnings when they pay off; but if they do not pay off and the bank fails, depositors are left holding the bag. If the bank was taking on too much risk and depositors were able to monitor the bank easily by acquiring information on its risk – taking activities, they would immediately withdraw their deposits.
Bank regulations that restrict banks from holding risky assets such as common stock are a direct means of making bank avoid too much risk. Furthermore, bank
regulations promote diversification, which reduce risk by limiting the amount of loan in particular categories or to individual borrowers. Requirements that banks should have sufficient bank capital are another way to change the bank‟s incentives to take on less risk. Bank supervision is also an important method to protect the consumers or depositors from moral hazard (Mishkin, 2003).
Financial Statement. Balance Sheet is a list of bank‟s assets and liabilities. As the name implies, this list has the characteristic: total assets = total liabilities + capital. Furthermore, a bank‟s balance sheet lists sources of bank funds (liabilities) and the uses which they are put (assets).
Banks obtain funds by borrowing and by issuing other liabilities such as deposits. They then use these assets such as securities and loans. Banks make profits by changing an interest rate on their holdings of securities and loans that is higher than the expenses on their liabilities. For example of asset items of commercial banks are cash, placement with central bank and other banks, securities, loans, and other assets such as physical assets. On liabilities side, items such as checkable deposits, nontransaction deposits, borrowings, and bank capital (Mishkin, 2003).
Marthen Sengkey –Evaluasi Kinerja Bank Pembangunan analysis, regardless of whether cross-sectional or time-series analysis is used. (5). When the ratios of the one firm are compared with those of another or with those of the firm itself over time, results can be distorted due to inflation.
Based on these causations, they concluded that there is no criterion for selecting a ratio that is agreeable by all users. For example, when we choose character A, to compare the performance between company X and Y then company X is better than Y, but when we choose character B, company Y is better than X. Therefore, lack of an objective standard for selecting the ratios would cause instability. The ratios in the financial statement have been added or simplified, and could not satisfy the needs of all users.
Two popular approaches to a complete ratio analysis are (1) the Dupont system of analysis and (2) the summary of a large number of ratios. Each of these approaches has merit. The Dupont system acts as a diagnostic tool with which to assess the key areas
responsible for the firm‟s financial condition. The summary analysis approach tends to view all aspects of the firm‟s financial activities to isolate key area of responsibility.
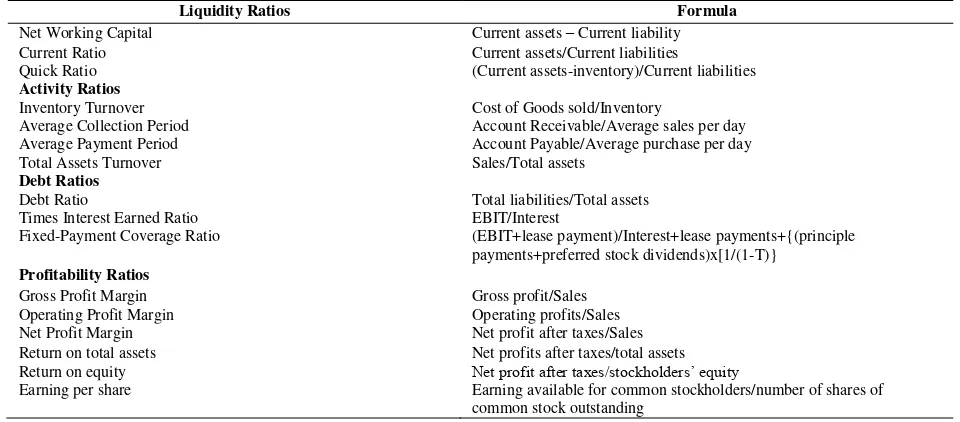
The Dupont system links the net profit margin (which measures the firm‟s profitability on sale) with its total assets turnover (which indicates how efficiently the firm has used its assets to generate sales). The Dupont formula then multiplies these two ratios to find the firm‟s return on total assets (ROA). It allows the firm to break down it return on total assets into a profit-on sales and efficiency-of –assets used component. The second step in the DuPont system employs the modified DuPont formula. This formula relates the firm‟s return on assets (ROA) to the return on equity (ROE). The later is calculated by multiplying the ROA by the financial leverage multiplier (FLM), which is the ratio of total assets to stockholders‟ equity. The summary of a large number of ratios include liquidity, activity, debt, and profitability shown on the table below:
Table 1. The Summary Analysis of Large Number of Ratios
Liquidity Ratios Formula
Net Working Capital Current assets – Current liability
Current Ratio Current assets/Current liabilities
Quick Ratio (Current assets-inventory)/Current liabilities
Activity Ratios
Inventory Turnover Cost of Goods sold/Inventory
Average Collection Period Account Receivable/Average sales per day Average Payment Period Account Payable/Average purchase per day
Total Assets Turnover Sales/Total assets
Debt Ratios
Debt Ratio Total liabilities/Total assets
Times Interest Earned Ratio EBIT/Interest
Fixed-Payment Coverage Ratio (EBIT+lease payment)/Interest+lease payments+{(principle payments+preferred stock dividends)x[1/(1-T)}
Profitability Ratios
Gross Profit Margin Gross profit/Sales
Operating Profit Margin Operating profits/Sales
Net Profit Margin Net profit after taxes/Sales
Return on total assets Net profits after taxes/total assets
Return on equity Net profit after taxes/stockholders‟ equity
Earning per share Earning available for common stockholders/number of shares of common stock outstanding
In this study, CAMEL was used to evaluate the liquidity, profitability, and efficiency of Indonesia‟s regional development banks over the period 1994 to 2004.
DEA – Multistage Model (Input-orientedVRS technology). DEA was originally introduced by Charnes et al., (1978) and is a non-parametric linear programming approach, capable of handling multiple inputs as well as multiple outputs. DEA assumes that the inputs and outputs have been correctly identified. Usually, as the number of inputs and outputs increase, more DMUs tend to get an efficiency rating of 1 as they become too specialized to be evaluated with respect to other units. On the other hand, if there are too few inputs and outputs, more DMUs tend to be comparable. In any study, it is important to focus on correctly specifying inputs and outputs. According to Kruger (2003), DEA is a local method in that calculates the distance to the frontier function through a direct comparison with only those observations in the samples that are most similar to the observation for which the inefficiency is to be determined.
The piece-wise linear form of non-parametric frontier in DEA can cause a few difficulty in efficiency measure. The problem arises because of the sections of
the piece-wise linear frontier, which run parallel to the axes which do not occur in most parametric function (Coelli et al., 1998). Environment is the factor which could influence the efficiency of a firm, where such factors are not traditional inputs and are assumed not under the control of manager. Some examples of environmental variables include ownership, location, labor, and government regulation (Fried et al., 1999). If the values of the environmental variable can be ordered from the least to the most detrimental effect upon efficiency, then the approach of Banker and Morey (1986a) can be followed. On the other hand, if there is no natural ordering of the environmental variable then one can use a method proposed by Charnes et al., (1985).
in this case is to run DEA where all the inputs are treated as controllable and then regress the emerging efficiency scores on non-discretionary inputs.
In this study, the multistage DEA model was utilized to compute the total efficiency scores.
According to Coelli et al., (1998, p. 150), the constant returns to scale (CRS), DEA model is only appropriate when the firm is operating at an optimal scale. Some factors such as imperfect competition, constraints on finance, banking, corruption, political crisis etc. may cause the bank to be not operating at an optimal level in practice.
The fall of Soeharto and five (5) years after the financial crisis, Indonesia is still struggling to deal with economic restructuring and recovery, political transition, decentralization and redefining national identity (Deuster, 2002). Moreover, the Asian financial and economic crisis of 1997-1998 hit the country hardest, which caused its real GDP declined by 13 percent in 1998 as its banking and modern corporate sectors collapsed in the wake of short-term capital outflows. Corporate debts remain largely unreconstructed, bank lending is limited, the government owns or controls most of the banking system and substantial business assets, fiscal sustainability is questionable, inflationary pressures are strong and investment climate is unattractive.
To consider all these environmental factors that may affect the banking performance in Indonesia, this CRS and VRS DEA model is specified as stated by Coelli et al. (1998, pp. 150, 151.
In this study, θi is the technical efficiency score for each bank, N is number of bank which is 26, λ is the lambda weight of each bank to the target or peer, y is the output variable (loan) and x is the input variables (deposit, total expenses, fixed assets, and capital). The defined as follows for observation (bank) i: where ε ~ N(0, σ2), xiand β are vectors of explanatory variables and unknown parameters, respectively. The y* is a latent variab efficiency score will satisfy if the value of θ is less and equal than one. If there is a difference in the CRS and VRS TE scores for a particular firm, then this indicates that the firm has scale inefficiency, and that the scale inefficiency can be calculated from the difference between CRS and VRS TE (Coelli et al., 1998, pp.134, 140, and 141). Furthermore, the nature of the scale inefficiencies for particular firm can be determined by seeing whether the non- increasing return to scale (NIRS) technical efficiency (TE) of NIRS TE score is equal to the VRS TE score. If they are unequal, then increasing return to scale exists for the firm. If they are equal, then decreasing return to scale applies And if TECRS = TEVRS the firm is operating under constant return to scale CRS (Coelli et al. 1998, pp.150- 151). The efficiency scores in this study were estimated, using the computer program known as Efficiency Measurement System -EMS (Scheel, 2000).
Tobit regression model investigates the linkage of financial performance (CAMEL) with DEA multistage (input oriented VRS model). This model was used to results were obtained by the aid of EVIEWS version 5.
y*= β‟xi+ εi (4) yi= y* if y* ≥0 and (5) yi = 0, otherwise
where ε ~ N(0, σ2), xi and β are vectors pf explanatory variables and uknown paremeters,
respectively. The y* is a latent variable and yi is the DEA score.
The likelihood function (L) is maximized to solve β and σ based on 26 observations (banks) of yiand xi is:
The standard Tobit model can be defined for observation (bank) i:
Marthen Sengkey –Evaluasi Kinerja Bank Pembangunan
The first product is over the observations for which the banks are 100 percent efficient (y = 0) and the second product is over the observations for which banks are inefficient (y > 0). Fi is the distribution function of the standard normal evaluated at β‟xi/σ .
Censored response data can be incorporated along with uncensored observations into a procedure called Tobit regression (Judge et al., 1985). It is similar to ordinary least squares (OLS), except that the coefficients are fit by maximum-likelihood estimation. The Tobit model is an alternative to OLS regression designed for situations where the dependent variable is limited (in this case, it could not assume values less than zero) and a large number of observations are clustered at zero. The concentration at zero violates assumptions for OLS analysis. Simply modeling the probability of a limit or non-limit value, as a probit model would do, throws away useful information (i.e., collapses all non-limit cases into a single class).
Results and Discussions
Performance indicator is an important factor used in business goal setting and management performance assessment. Traditionally, companies tend to measure business performance in terms of financial data such as ROE, ROA, etc. However, those indicators are insufficient to evaluating business performance as a whole (Kuang, 2005). This study evaluated the performance of Regional development banks of Indonesia for eleven (11) years, from 1994 to 2004, using financial ratios (CAMEL), non-parametric approach (DEA-multistage VRS input oriented), and parametric approach. Moreover, various statistical tests such as Tobit regression, Spearman rank-correlation and ANOVA were also used. All tools are used to answer the hypotheses of this study.
CAMEL. CAMEL and ANOVA tests were used to answer the objective one (1) found in Chapter 1. These tests were used to evaluate the performance of the regional development banks of Indonesia through capital adequacy ratios, asset quality ratios, management quality ratio, earning ability ratios and liquidity ratio. There were two ratios that were used to measure the capital adequacy (C/TPA, E/TLO); two ratios for assets quality (TLO/TA, NPL/TLO); one (1) ratio to manage the quality (T.Op.Exp./TA); two (2) ratios for earning ability (ROE, ROA), and one (1) ratio for liquidity (CPCBB/TDB).
Barr and Siems (1994) used total loans instead of total assets to measure the capital adequacy ratio. The reason was, loans of finance companies were assets with the highest potential of unanticipated losses, and an adequate level of capital must be maintained to absorb these unanticipated losses. This ratio was also used in accordance with the Central Bank of Indonesia‟s guidelines. The higher the ratio reflects, the higher the capital adequacy and the lower the probability of failure.
Total loans to total assets was used by Wheelock and Wilson (1994), Hooks (1995), and Hwang and Lee (1997). Non-performing loan was used by Gonzalez-Hermosillo et al. (1997). The total loans-to-total assets ratio alleviates the problem that finance companies may
have underestimated their non-performing loans. The higher the ratios imply a poorer asset quality and a higher probability of failure.
Conclusions
This study aimed to evaluate the performance of the regional development banks in Indonesia over the period 1994 to 2004. It used three approaches (CAMEL, DEA and SFA) and three statistical tests (ANOVA test, Tobit regression, and Spearman rank correlation) to achieve its stated objectives. CAMEL approach is used to evaluate the financial performance of the regional development banks in Indonesia over the period 1994 to 2004 to attain the first stated objective of this study. The main ratios that were used for CAMEL approach are capital adequate ratios (C/TPA, E/TLO); assets quality ratios (TLO/TA, NPL/TLO); management quality ratio (T.Op.Exp./TA); earning ability ratios (ROE, ROA); and liquidity ratio (CPCBB/TDB).
Data envelopment analysis is used to address the second and third objectives stated in Chapter 1. The objectives are to compare the efficiency estimates among the Indonesia regional development banks and to determine the input usage/saving and output deterioration for each bank‟s performance. There are four input variables (deposit, operating expenses, capital and fixed assets) and one variable (loan) as output used in this study.
SFA is used to examine the relationship between bank loans (output) and the following input variables: (1) deposit, (2) operational expenses, (3) capital, and (4) fixed assets. Moreover, it was used to test whether there are technical inefficiency effects to the production process with the following environment variables: (1) government intervention, (2) ownership, (3) location, (4) ABC classification stated in the objective four and three.
The Spearman rank correlation is used to investigate the correlation between DEA and SFA efficiency results. Meanwhile, Tobit regression is used to investigate the linkage between bank‟s financial and efficiency performance. The findings of this study can be used as a direction for future investigation on modeling performance management. The significant findings and contributions of the study are as follows.
37.62 percent) of ROA and ROE respectively, and BPDR with the highest ratio (263.94 percent) of cash and placement with central bank and other banks to total deposit and total borrowing. Furthermore, CAMEL model has demonstrated that not all of the banks that have a good performance come out from the banks with CAR above the minimum requirement of bank authority and a bank that has the best performance in one ratio does not automatically have a good performance with other ratios. CAMEL model also proves that each of the 26 banks has its own management‟s strengths and single ratio does not provide sufficient information from which to judge the overall performance of a firm.
Secondly, bank performance is modeled again using a non-parametric DEA model. This model fills in the limitation of CAMEL model (financial), which generates single or partial measurement of efficiency and productivity, by accommodating multiple variables to generate a broader measurement of efficiency and productivity. DEA results suggest that the average estimate scores of sample banks have ranged from 19.14 percent to 69.14 percent. 80.86 percent. Moreover, 69.2 percent of banks have the estimate efficiency score above the mean of 33.28 percent. In general, the efficiency scores of all banks showed a decline when the financial crisis struck the Asian region in 1997.
Another significant contribution of DEA model is a possible explicit determination of bank‟s excesses in input resources and also output deterioration for the first time in Indonesian development banks. Among four input variables, capital has the highest average input slack of 11.26 percent followed by deposit, fixed assets and total operating expenses with the average input slacks of 10.13 percent, 6.44 percent, and 3.65 percent, respectively. For the capital variable, BPDSESU has the highest input slack of 27.30 percent that calls for a reduction of 27.30 percent of the capital used without reducing the output. Further, banks with the highest ratio of other input slacks are BPDENT (29.03 percent) for
deposit, BPDWS (19.27 percent) for operating expenses, and BPDNS (15.17 percent) for fixed assets. Otherwise, there are five banks that have a zero input slack for operating expenses (BPDL, BPDDKI, BPDSS, BPDJ, BPDCK), one bank for capital (BPDSSU), and three banks (BPDWS, BPDR, BPDWJ) for fixed assets. Overall, bank that has the highest weighted mean of the input slack for all variables is BPDENT with the mean value of 16.223 percent. On the other hand bank with the lowest weighted mean of the input slack for all variables is BPDIY with the value of 1.59 percent. Regarding output slack, the result shows that none of the banks has the output slack. In the operation of the banks to produce loans during 1994 to 2004, banks did not incur any deficiency.
Thirdly, bank performance is modeled by a parametric Stochastic Frontier Analysis model, allowing statistical noise (composite error) to influence technical inefficiency. This model overcomes the limitation of DEA approach. SFA findings suggest that those banks that do not receive funds from the bank authority are more efficient than the banks that receive any funds from the bank authority. Likewise, banks that are owned less than 50 percent by the province government, located outside West of Indonesia, and classified as BC level in terms of CAR are more efficient as well. Moreover, the more used of deposit, total operating expenses and fixed asset increased the efficiency of the banks performance. Otherwise, the more used of capital as an input reduced the efficiency performance of the banks. The study found interestingly that BPDWS has the highest efficiency score of 82 percent, eventhough, this bank is classified at the C level in terms of CAR. This finding is consistent between the parametric (SFA) and non-parametric (DEA) models. The result of this study affirmed the results obtained by Bauer et al, (1998), Ferrier and Lovel (1990), for the banking performance in other parts of the world. The new evidence found in the Indonesian regional banks is another new empirical contribution to the banking efficiency literature.
Fifthly, banking performance is further verified by testing relationships between DEA (general measure of efficiency) and CAMEL (partial measure of efficiency) models. Based on the Tobit regression,
there is a significant relationship between financial performance (CAMEL) and the DEA efficiency score. There are four ratios used in CAMEL that have significant linkages with the DEA efficiency score. These ratios are total equity to total loan, total loan to total assets, NPL to total loan, and ROE. Banks with a higher ratio of equity to total loan, total loan to total assets, NPL to total loan, and ROE increased the efficiency of the bank. On the other hand, total operating expenses to total assets, ROA, and cash place with bank central and other banks to total deposit and borrowing ratios (CAMEL) have negative relationships with the efficiency score. The
higher the ratio of operating expenses to total assets, ROA, and cash place with central bank and other banks to total deposit and borrowing resulted in efficiency deterioration of the bank. The remaining CAMEL ratio, which has a negative linkage with the efficiency score but insignificant is the ratio of capital to total performing assets.
Marthen Sengkey –Evaluasi Kinerja Bank Pembangunan
the aid of other statistical tools aside from tests used in this study. Significantly, results of this study contribute significantly to the theoretical modeling of performance (financial, efficiency and productivity) extensively in the banking sector as evident in the Indonesian state banks. The new empirical findings provided by the study are added new contributions to the literature on the banking performance management. Finally, it provides a bias-free information to the householders, business firms, government, and other stakeholders about the financial performance, efficiency and the productivity of the banks for decision making purposes to save or borrow money from these banks.
Recommendations
Based on the findings of this study, the following recommendations are made for the management of regional development banks as well as the government.
Management of regional development banks. 1. Loans of finance companies are assets with the highest potential of unanticipated losses and an adequate level of capital must be maintained to absorb these unanticipated losses. The management of the regional development banks should be more wised to maintain the composition of the capital and total assets to enhance the liquidity. Furthermore, they should keep the lower ratio of operating expenses to total assets ratio through strict control to the interest rate to the deposit salary and benefit, and their unproductive expenses. Moreover, the management of the banks should improve the ability to put in order the institution‟s assets into net earning to upgrade the performance of the bank. 2. The management of the regional development banks should be more prudent and productive by focusing attention on the relationship between the resources and the outputs. They can reduce employing of capital, while increasing employing deposit, operating expenses, and fixed assets in a discreet fashion to be more efficient and productive. 3. Related to credit risk, the management of the regional development banks should be continuing review of credit limit and formulating appropriate credit policies and procedures of the loan portfolio and the adequate amount provisions thereof. Moreover, they should continue to prudently manage current loans and improve the quality of their loan portfolio. 4. In connection with total operation expenses, the management should continue to focus on generating low cost fund, launching new products and services for various target markets, and continuing the training of their front line personnel and altogether improving delivery systems and using the IT to support the operation. 5. The ownership should not be monopolized by the province government. It should be distributed to the other parties so proportion of the ownership of other parties is greater than owned by province government.
Government/Regulators. 1. The election of the team of superintendent of regional development bank should be based on the policy and the procedure of the bank. The government/regulators need to have fairly accurate information about the likely effect of their decisions on the performance of the bank they regulate or supervise. 2. Central bank should improve the legal and regulatory framework of the banking system in Indonesia to encourage bank management to improve the efficiency
and productivity of the bank. 3. Finance ministries, central banks, and other government institutions need to recognize that the Indonesia‟s financial system stability relies heavily on the banking industry to restore the weakening of economic growth, they should strictly control to the implementation of the bank‟s policy and procedures. 4. To determine the efficiency and productivity of the regional development banks, the bank authority should consider other approaches, aside from the present used of CAMEL, such as DEA and SFA. In this case, Indonesia‟s bank authority should have a general measurement of banking performance compared with the current partial measurement they adopted. Some bank authorities in the United States, Europe, Japan, and Singapore, for example, have already accepted and adopted other approaches to measure banking performance. The models in this study could be a benchmark tools to be used by Indonesia‟s bank authorities.
Future Research. The performance of the bank institutions are interesting topics for banking researchers. There are three banks behavior known as intermediation where deposit as an input and the alternative is the production approach where banks are accepted as using labor and capital (inputs) to generate deposits and loans (outputs), and asset approach that defines outputs as the stock of loan and investment assets, because the primary role of financial institutions as creator of loans.
The common nonparametric approaches include the Data Envelopment Analysis and Free Disposal Hull (FDH). Data Envelopment Analysis approach relies on a very restrictive structure of the production set, such as convexity. Weaker assumptions have been proposed by Deprins, Simar and Tulkens (1984). They postulate that the frontier of the production set is simply the boundary of the free disposal hull (FDH) of the data set. In this approach, there has not the parametric assumption for the frontier. On the other hand, the common parametric approaches comprised of the Stochastic Frontier Approach, the Thick Frontier Approach (TFA) and the distribution free approach assumes that the efficiency of each firm is stable over time, whereas random errors tends to average out to zero over time.
The result of this study can be used as a starting point for further studies on the productivity and efficiency measurement for other Indonesian industries and institutions likewise in the other countries using CAMEL, DEA and SFA approaches.
segment of each business unit. Furthermore, the potential future researchers in evaluating the performance of regional development banks in Indonesia can assume bank as a production (aside from intermediation used in
this study) and use different input and output variables by using either the same models used currently or different
models and statistical tests.
REFERENCES
Athanassopoulos, Antreas D. (1998). Nonparametric Frontier Models for Assessing the Market and Cost Efficiency of large-scale bank branch networks. Journal of Money, Credit, and Banking 30 (2), 172-192.
Banker, R. D. and Morey, R. C. (1986). Efficiency Analysis for Exogenously Fixed Inputs and Outputs. Operations Research 34(4), 513-521.
Banker, R. D., A. Charries and W. W. Cooper (1984). "Some Models for Estimating Technical and Scale Inefficiencies in Data Envelopment Analysis." Management Science 30(9), 1078-1092, September.
Banker, R.D., Charnes, A. and Cooper, W.W. (1984), “Some Models for Estimating Technical and Scale Inefficiencies in Data Envelopment Analysis." Management Science 30 (9), 1078-92
Barr, Ricard S. and Siems, T. F. 1994. Predicting bank failure using DEA to quantify management quality. Federal Reserve Bank of Dallas Financial Industry Studies 26, 1-31, January
Baruch, Lev (1974). Financial Statement Analysis: A New Approach (Englewood Cliffs, NJ: Prentice-Hall, Inc.). Bauer, P. W., Burger Allen. N., Ferrier, Garry. D. And Humprey, David. B. (1997). Consistency conditions for
regulatory analysis of financial institutions: A comparison of frontier efficiency methods. Working paper 02 (97), Federal Reserve Financial Service.
Barr, Ricard S. and Siems, T. F. 1994. Predicting bank failure using DEA to quantify management quality. Federal Reserve Bank of Dallas Financial Industry Studies 26, 1-31, January.
Bauer, P.W., A.N. Berger, G.D. Ferrier and and B.D. Humphrey, (1998). "Consistency conditions for regulatory analysis of financial institutions: A comparison of frontier efficiency methods." Journal of Economics and Business 50 (2), 85-114.
Casserley, Dominic, Gibb, Greg, and the Financial Institution Teams, (1999). Banking in Asia: The end of entitlement. JohnWley & Sons (Asia) Pte Ltd.
Charnes, A., Cooper, W. W. and Rhodes, E. (1978). Measuring the efficiency of decision making units. European Journal of Operational Research 2 (6), 429-444.
Chavas, J.P. and Cox, T.L. (1990). “A Non-Parametric Analysis of Productuvity: The Case of U.S. and Japanese Manufacturing. “American Economic Review 80(3), 450-464.
Chen, Tser Yieth and Yeh, Tsai Lien (1998). A Study of efficiency evaluation in Taiwan‟s banks. International Journal of Service Industry Management 9 (5), 1-8.
Chien-Ta Ho and Dauw-Song Zhu (2004). Performance measurement of Taiwan's commercial banks. International Journal of Productivity and Performance Management 53 (5/6), 425.
Ceolli, T. (1996). “A guide to FRONTIER Version 4.1: Computer Program for Stochastic Frontier Production and Cost Function Estimation. “Center for Efficiency and Productivity Analysis, University of New England.
Ceolli, T. J. A Guidde to DEAP Version 2.1: A Data Envelopment Analysis (Computer Program), Working Paper No. 8/96, Armidale, Autralia: Centre for Effeciency and Productivity Analysis, University of New England, 1996. Ceolli, Tim J. (1996). A Guidde to DEAP Version 2.1: A Data Envelopment Analysis (Computer Program), Working
Paper No. (8) 96, Armidale, Autralia: Centre for Effeciency and Productivity Analysis.
Coelli, Tim, Rao, Prasada D.S. and Battese, George E. (1998), An Introduction to Efficiency and Productivity Analysis.
Kluwer Academic Publishers, Dordrecht.
Cole, R. A. and Gunther, J. W. 1995. Separinting the likelihood and timing of bank failure. Journal of Banking & Finance 19 (9), 1073-1089.
Colwell, R. J. and Davids, E. P. (1992). “Output and Productivity in Banking”. Scandinavian Journal of Economics 94, 111-29.
Coyle, Brian (2000). Measuring Credit Risk. United Kongdom, CIB Publishing, 5-20.
Daly, Mary, Kraine, John and Lopez, Jose A. (2003). “Does regional economic performance affect bank health? New analysis of an old question,” Working Papers in Applied Economic Teory 2004-01, Federal Reserve Bank of San Francisco.
Deprins D, Simar L and Tulkens H (1984). Measuring labor-efficiency in post offices. In: Marchand M, Pestieau P and Tulkens H (eds). The Performance of Public Enterprises. Elsevier, Amsterdam, 243-267
Deuster, Paul (2002). „Survey of Recent Developments‟, Bulletin of Indonesian Economic Studies 38 (1), 2–37. Ferrier, G.D. and Valdamanis, V. G. (2004). The Journal of the Operational Research Socienty
55(10), 1071.
Ferrier, Garry D. and Lovell, C. A. Konox (1990). Measuring Cost Efficiency in Banking: Econometric and Linear Programming Evidence. Journal of Econometrics 46, 229-45.
Fried, H. O., Schmidt S. S. and Yaisawarng S. (1999). ''Incorporating the Operating Environment into a Nonparametric Measure of Technical Efficiency.'' Journal of Productivity Analysis 12, 249-267.
Fried. H.O., Lovel C. A. Knox, and Smith S.S. (1993). The Measurement of Productive Efficiency: Techniques and Applications Oxford University Press, New York.
Marthen Sengkey –Evaluasi Kinerja Bank Pembangunan
Golany, B, Storbeck, J E. (1999). A data invloment analysis of the operational – efficiency of bank branches Linthicum: Interfaces 29 (3), 14-27, June
Gong, B. H. And Sickles, R. C. (1992). A Comparison Between Stochastic frontier and data envelopment analysis using panel data. Journal of Economic 51, 259-284.
Gonzalez-Hermosillo, B.; Pazarbasioglu, C.; and Billings, R. (1997). Determinants of banking system fragility: A case study of Mexico.
Greene, William H. (1990). “A Gamma –Distributed Stochastic Frontier Model.” Journal of Economics 46, 141-163 Greene, William H. And Dan Segal, (2004). “Profitability and Efficiencyin the U. S. Life Insurance Industry.” Journal
of Productivity Analysis 21, 229-247.
Greenwald, B. And Stiglitz, J. (1989), “Financial Market Imperfections and Productivity Growth”, National Bureau of Economic Research Working Paper, 2945.
Grosskopf, S. and Valdamanis, V. (1987). “Measuaring hospital performance: a non parametric,” Journal of health Economics 6 (2), 89-107.
Hamilton-Hart, Natasha (2003). Asian States, Asian Bankers. Central Banking in Southeast Asia, 12-27; 29-35.
Hattori, Toru (2000). Relative Performance of U.S. and Japanese Electricity Distribution – An Application of Stochastic Frontier Analysis. Journal of Productivity Analysis 18, 269-284.
Hattori, Toru, Jamasb, Tooraj, and Pollitt, Michael, (2005). The Energy Journal 26 (2), 23-25
Hempel George H., Simonson Donald G. and Coleman, Alan B. (1994). Bank Management Text and Cases. 4th Edition John Wiley & son Inc. New York
Hjalmarsson, L., Kumbhakar Subal C. and Heshmati, A. (1996). DEA, DFA and SFA:A Comparison. Journal of Productivity Analysis 7 (2/3), 303-328.
Hooks, L. M. (1995). Bank asset risk: Evidence from early-warning models. Contemporary Economic Policy 13 (10), 36-50.
Hwang, D. Y. and Lee, C. F. (1997). Forecasting bank failure and deposit insurance premium. International Review of
Economic & Finance 6,
317-334. IBRA. Monthly reports.www.bppn.go.id.
Indonesia‟s Law No. 84, 1998. About the Commercial bank Recapitalization programmed 1998. Jaccard, James. (1998).Interaction effects in factorial analysis of variance.
Jermic, Igor and Vuicic, Boris (2002). Efficiency of banks in Croatia: A DEA approach, Comparative Economic Studies. Flushing 44 (2/3), 169-94.
Judge, George W., Griffiths, W. E., Hill, Carter R., Lutkenpohl, Helmut and Tsoung-Chao Lee, The Theory and Practice of Econometrics, 2nd ed., New York: Wiley, 1985.
Jun-Yen Lee (2005). Studies, Stochastic Models, Data envelopment analysis, Efficiency. Forest Products Industry, 55(7/8), 51-57, August.
Koa, C. and Yang, Y. C. (1991). Measuring the efficiency of forest management. Forest Science 37(5), 1239-1252. Karr, John (2005). Pereformance Measurement in Banking: Beyond ROE Journal of performance management 18(2),
56-71
Katz, M., & Rosen, H. (1998). Microeconomics. Boston: McGraw-Hill.
Krishnasamy, Geeta, Ridzwa, Alfieya Hanuum and Perumal, Vignesen (2004). Malaysian Post Marger Banks‟ Productivity: Application of Malmquist Productivity. Managerial Finance 30(4), 63-75
Kruger, Jean J. (2003). The global trends of factor productivity: Evidence from the nonparametric Malmquist index approach55 (2), 265 April
Krugman, Paul (1990). “Uincreasing Return and Economic Geography,” NBER Working Papers 3275, National Bureau of Economic Research, Inc.
Kuang-Hua, Hsu (2005). Using Balanced Scorecard and Fuzzy Data Envelopment Analysis for Multinational R & D Project Performance Assessment.
Meric, G. And Meric, I. (2001). Risk and Return in the world‟s major stock markets. Journal of Investing 10 (1), 62-7. Master, Lerrota J. (1996a). A Study of bank effeciency taking into account risk-preferences. Journal of Banking and
Finance 20, 1025-45.
Master, Lerreta J. (1987). “A Multiproduct Cost Study of Savigs and Loans.” Journal of Finance 42, 423-445.
Miller, S. M.. and Noulas, A.G. (1996) “The technical efficiency of large bank production”, Journal of Banking and Finance 20 (3), 495-509.
Mishkin, Frederic S. (2003).The Economics of Money, Banking,and Financial Markets. Columbia University USA, Addison Wesley. 6th ed., 211-237. Newbury Park, CA: Sage.
Sengupta, J.K. (1998), “New efficiency Theory: extensions and new applications of data envelopment analysis”, International Journal of System Science 29 (3), 255-65.
Sexton, T R., Silkman, R H., and Hogan, A. (1986). Data Envolopment Analysis: Critique and extension. In R.H.Silkman (Ed.), Measuring Efficiency: An assessment of dataEnvelopment analysis. Publication no. 32 in the New Directions of Program Evaluation, Jossey Bass, San Francisco
Sheldon, G. (1999). Costs, Competitiveness and the changing structure of European banking. Working paper, Fondation Banque de France Pour la Recherche.
Tarim, S.A. and Karan, M.B. (2001). Investment fund performance measurement using weight-restricted data envelopment analysis. Russian and East European Finance and Trade. 37 (5), 64-84.
Toru Hattori. (2002). Relative Performance of U.S. and Japanese Electricity distribution – An Application of Stochastic Frontier Analysis. Journal of Productivity Analysis 18, 269-248.
Wai, Ho Leong, Dollery, Brian and Coelli, Tim (2003). Measuring the Technical Efficiency of Banks in Singapore for the Period 1993-99: An Application and Extension of the Bauer et al. (1997) Technique. ASEAN Economic Bulletin 20 (3), 195-111.
Webster, Allen (1992). Applied Statistics for Business and Economics. Boston, Irwin. 779-783.
Weill, Laurent (2004). Measuring Cost Efficiency in European Banking: A Comparison of Frontier Technques. Journal of Productivity Analysis 21 2, 133.
Wheelock, D. C. and Wilson, P. W. (1994). Can deposit insurance increase the risk of bank failure? Federal Reserve Bank of St. Louis Review 76. (5/6), 57-71, June.
Yew, Kee Ho, Tjahjapranata, Mira and Yap, Chee Meng (2006). Size, Leverage, Concentration, and R & D Investment in Generating Growth Opportunities. Journal of Business
79 (2)
Yuengeert, A. M., 1993, “The Measurement of Efficiency in Life Insurance: Estimates of a Mixed Normal-Gammarror odel,” Journal of Banking and Finance 17, 483-496.