Mobile App Analytics
Optimize Your Apps with User Experience Monitoring
Mobile App Analytics by Wolfgang Beer
Copyright © 2016 O’Reilly Media. All rights reserved. Printed in the United States of America.
Published by O’Reilly Media, Inc., 1005 Gravenstein Highway North, Sebastopol, CA 95472.
O’Reilly books may be purchased for educational, business, or sales promotional use. Online editions are also available for most titles (http://safaribooksonline.com). For more information, contact our corporate/institutional sales department: 800-998-9938 or
[email protected]. Editor: Brian Anderson
Production Editor: Colleen Cole
Copyeditor: Molly Ives Brower
Interior Designer: David Futato
Cover Designer: Karen Montgomery
Illustrator: Rebecca Demarest
Revision History for the First Edition 2016-09-15: First Release
See http://oreilly.com/catalog/errata.csp?isbn=9781491957097 for release details.
The O’Reilly logo is a registered trademark of O’Reilly Media, Inc. Mobile App Analytics, the cover image, and related trade dress are trademarks of O’Reilly Media, Inc.
While the publisher and the author have used good faith efforts to ensure that the information and instructions contained in this work are accurate, the publisher and the author disclaim all responsibility for errors or omissions, including without limitation responsibility for damages resulting from the use of or reliance on this work. Use of the information and instructions contained in this work is at your own risk. If any code samples or other technology this work contains or describes is subject to open source licenses or the
intellectual property rights of others, it is your responsibility to ensure that your use thereof complies with such licenses and/or rights.
Foreword
Mobile apps have evolved from an experimental to an integral part of the eCommerce business model. Increasingly, entire businesses are now being built around mobile application strategies.
This rapid adoption of mobile means that operations professionals must extend their monitoring strategies to include mobile app performance,
availability, and crashes. This proves to be a challenge as the management of mobile apps have different requirements than web-based applications. The combination of the diversity of devices, the large number of operating system versions, and the lack of control over the release and update process create new requirements towards monitoring and operational analytics.
Users have little patience for non-performing apps or apps with functional issues. If an app does not meet user expectations, it is deleted minutes after the download. Having a mobile monitoring and performance strategy in place is essential. This book provides clear guidelines on how to achieve this
quickly and efficiently.
Alois Reitbauer
Chapter 1. Introduction
One of the differences between publishing mobile apps and selling traditional products without a network connection is the possibility to instantly collect usage statistics and context information in real time about individual
customers worldwide. Collecting real-time data about all product users is daily business for marketing and sales experts, as well as for the engineers who develop and improve mobile apps.
Today’s competitive situation within global app marketplaces makes it hard for app developers to distinguish their app from thousands of similar mobile apps. Providing a reliable and highly responsive mobile app and showing a good level of attention to details helps you stay on top of your competitors. To know your typical app users and how they experience your mobile app is the first step toward good product reviews and a growing user base. Mobile-user experience monitoring helps publishers understand how customers are using an app and what features they prefer. Without this deep visibility, it is impossible to drive innovation and to improve the usability of your mobile offering.
Often, product innovation arises just by following your customers through their business process workflows and by tracking and measuring key performance indicators. User surveys and A/B tests with a target audience have a long tradition and can answer different hypotheses about your product and functions within different market segments and user groups.
For decades, marketing experts have analyzed and studied target audiences for traditional paper mailings, catalogs, or emails. Digital marketing experts take target audience analysis to the extreme by using global real-time
information to observe changes in global usage within minutes; for example, monitoring how users’ navigational behavior changed in real time after an email campaign announced a new feature within your mobile app.
Today, real-time collection and analysis of usage information is not limited to websites and mobile apps; it has been seamlessly adapted for smart TVs, watches, or even personal fitness-tracking devices. Actual usage information helps to better understand how a product is handled by the customers, which parts of the user interface are hot spots, and which parts are never used at all. Modern analytic frameworks offer a vast amount of different metrics and key perfomance indicators (KPIs)1, but the interpretation is still up to human
analysts and involves the definition and testing of hypotheses. The most
profound collection of user information is worth nothing without a reasonable formulated hypothesis. There isn’t a generic one-size-fits-all collection of metrics and KPIs; instead, the selection of a feasible set of metrics depends on the hypotheses to check. This report will give a short introduction to important categories of metrics and their application. To dive into the details of formulating detailed hypotheses and correctly interpreting the results would go beyond its scope.
The application domains and questions to answer by collecting usage
statistics are manifold, and range from marketing to product management to quality management and testing aspects. While questions around the
marketing aspects will most likely focus on ad targeting, conversion rates, and effectivity, quality management’s interests are directed toward stability, heterogeneity of target platforms, and maximizing the quality of products by focusing their testing budgets into specific parts of the product.
mobile apps and provides some detail insights about different instrumentation approaches. The goal of this report is to help readers to set up real user
monitoring for their own mobile apps and to drive product improvements by choosing the right metric for specific questions.
NOTE
This report focuses on general vendor- and tool-independent techniques for collecting and analyzing metrics for your mobile app business. All of the metrics mentioned within the report can be collected with any mobile monitoring framework available today. In order to present real-world examples, I’ve used screenshots from popular tools such as Google Analytics, Ruxit, Fabric, and Flurry Analytics.
9 Mobile App KPIs to Know, Lauren Drell, Sept 05 2013, http://mashable.com/2013/09/04/mobile-app-metrics
Chapter 2. Measure App
Success
Before you start to collect any data about your mobile apps, it’s important to understand the different categories of metrics and which key questions they help to address. Every department within your company, such as
development, ops, marketing, or sales, focuses on providing answers to different product-related aspects. While the development and ops
departments might be more interested in the overall performance and stability of your mobile apps, the marketing and sales people want install,
engagement, and stickiness metrics. The spectrum of necessary metrics to measure the overall performance, to collect crash reports, and to monitor the usage of your apps is quite broad.
The first part of this chapter focuses on metrics that help to answer questions such as how many people are using your app and how many of them were acquired recently. The second part of this chapter looks at metrics that can inform you of how much time a user spends with your app. It’s important to engage your app users regularly so that users get used to working with your product. Target audience analysis gives you detailed information about your active users. Marketing and sales experts use this information to better
understand the needs of your target group and to streamline marketing campaigns accordingly.
which are often used by a whole family.
Counting Installations
One of the first and simplest acquisition metrics is the category of installation metrics, which are measured by the app marketplaces. One of the first of these to be introduced in the mobile app business was simple installation counts. The launch of Apple’s global App Store in July 2008 completely changed the way third-party applications were published and distributed on a global scale. Installation metrics were the first numbers delivered by the marketplace itself to the publishers. Installation metrics grew beyond simple download counters as more and more marketplaces started to deliver detailed information about the installing customer’s real-world locations and their devices.
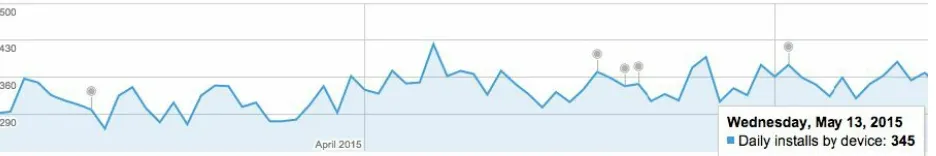
Figure 2-1 shows the daily app installation numbers over three months. This daily installation metric gives the app publisher a pretty good impression of how many users were willing to take the first step in the user acquisition process and install the app. Note that dates where new app versions were published are specifically tagged within the chart.
Figure 2-1. Google Play marketplace daily app installation metric
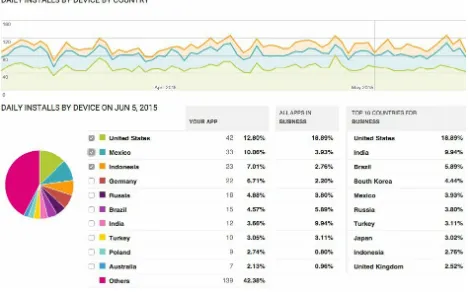
Figure 2-2 adds a detailed chart of real-world geographic location installations over the same period of time. It also shows the specific
Figure 2-2. Google Play marketplace daily installs by country
NOTE
Google quite helpfully shows you the baseline (All Apps In Business) of all apps installation distribution within the same app category (Business), and the top installation targets within the Business app category.
Most marketplaces are counting the daily install statistics; they are also
collecting the number of users updating or uninstalling your app. The ratio of users installing your app to users uninstalling your app is a good indicator of how well your user-acquisition process performs at the moment and how good your app’s visibility on the market is.
WARNING
stability. This is discussed in detail in Chapter 3.
Active and New Users
So what’s the difference between the installation metrics and the acquisition metrics that are measured at runtime? Well, anyone can download and install an app, but how many of those downloaded apps are really running per day? The active user and new user metrics collect these measures at runtime
directly through all running app instances worldwide. A typical metric here is monthly active users (MAU) or daily active users (DAU). Active users are defined as users who at least start your application once in a given time period. An active user is only counted once, even if that user starts several sessions within the given time period.
Measure User Engagement
User engagement measures how often your users are active within your
mobile app and how much time they spend working with your app’s features. In order to evaluate the success of individual parts within your app, it’s
important to understand how much time users are spending in each of your app’s screens — and where they bounce off the app.
User Sessions
One of the first engagement metrics to review is related to user sessions. A user session is defined as one use of your app by an individual user that
begins when the user starts the app and ends when the app is suspended to the background. While it’s quite easy to define the session start, it’s up to your tracking tool to define exactly when a session ends. Most app-monitoring frameworks stop a session when the app is suspended to the background for a specific amount of time (e.g., 30 seconds in Google Mobile Analytics).
The important aspect to note here is that in order to analyze your users’ session engagement, you have to determine exactly how your selected monitoring framework is defining a session.
WARNING
Mind that the session length and number of sessions per user very much depend on the type of app you are monitoring, as different kinds of app will show different session behavior characteristics. A music streaming app such as Spotify will be started once in an hour and may stay in the background for a long time, streaming music and audio ads to the user. A short messaging app is characterized by many very short sessions and a high number of user sessions per day. You have to keep in mind that the type of app is very much influencing the advertising and revenue-generation process.
The number of user sessions per day shows how often users are opening your app, while the median session length measures the length of sessions over time: half of your measured sessions are longer than the media session length. The median session length is less vulnerable to session-length outliers
Retention and Churn
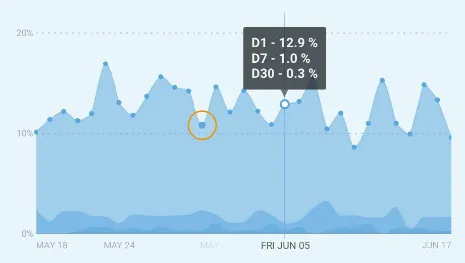
The retention rate calculates the chances that a user who installs your app on Day 0 is still around on 0+N days (e.g., after three months).
There are different ways to calculate the retention rate, but the most common are fixed retention for Day 1, Day 7, and Day 30 or rolling retention.
NOTE
It is critical to review an app’s retention rate, as three-quarters of your acquired active users do not return after three months.
The rolling retention rate is the proportion of users returning to your app on a day + N, or any day after that, divided by the number of users who installed your app on Day 0. Typical values for N are one day, three days, a week, a month, and three months.
So the formula for calculating the retention for Day N is as follows:
Day N Retention = Users retained on Day N / Active Users on Day 0
Figure 2-3. Fixed retention for days 1, 7, and 30 (Image courtesy of Fabric1)
Another very popular visualization for rolling retention rates is a heat map that shows the retention over several weeks. A heat map is a matrix of values in which each value has a specific color encoding that represents the values impact. Speaking of retention rate, each heat map value shows a percentage of users who opened your app after a given starting date. An example for a retention heat map is shown in Figure 2-4.
Other ways of calculating retention rates are:
Full Retention: Full retention is quite restrictive, as it only measures users who come back every single day until Day N.
Classic Retention: Classic, or fixed, retention measures all users who come back exactly on Day N.
Churn represents the opposite of retention rate. It’s the measure of users who stop to use your app in a defined period of time. Churn rate is expressed as a percentage of the overall count of users who could have left (which is also the size of the initial cohort).
Business Intelligence
Business intelligence (BI) is the process of analyzing large amounts of unstructured business-related data. BI tries to provide better statistical evidence for making business decisions and for defining strategic goals in general. By taking large amounts of unstructured data related to a business’s operation, decision-makers try to identify new sales opportunities or find interesting target groups for advertising products and services.
Within BI tools, the historic view of data is as important as the predictive views that should forecast how selected metrics are expected to develop in the future. Today, business intelligence is highly connected with
multidimensional data warehouses and online analytical processing tools (OLAP). The goal of any business tool is to analyze and visualize actionable information for a company to act on.
Cohort analysis is a subcategory within business analytics that focuses on extracting the average behavior of your typical users. Cohort analysis tries to build groups of customers by analyzing multiple dimensions of given data, such as a customer’s location, age, gender, purchase history, search keywords used, number of sessions per timeframe, language and culture, education, or friends. The hypothesis is that the behavior of a group of customers with similar interests is easier to predict than the behavior of single users.
Personas
Over the last few years, the classification of audience by using persona profiles instead of the traditional keyword-driven approach represented a significant change in digital marketing. The basic idea behind it is to create representative focus groups within your audience by mapping specific metric characteristics, such as purchase history, geographic locations, countries, age and gender information, and interests. The creation and classification of your visitors into digital personas will give you a deeper understanding about the demands and interests of your audience.
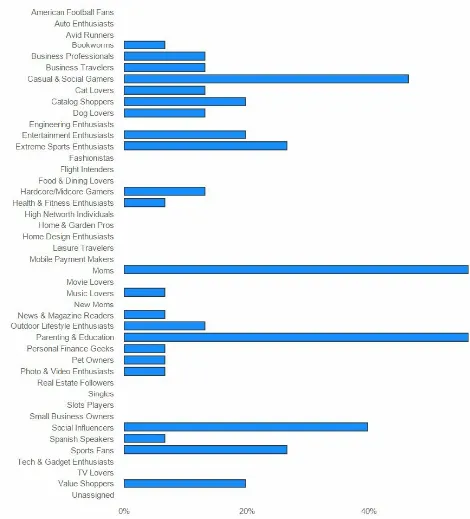
An example of a persona-related evaluation of app visitors for a specific kids’ painting app is shown in Figure 2-5. Despite a quite low number of overall active users, the persona classification already shows two major types of users: moms who are downloading the painting app for their kids, and users who are interested in parenting and education. In this example, the
Lifetime Value (LTV)
The lifetime value (LTV) is the driving metric for evaluating how much your users are worth in terms of financial revenue, loyalty, and evangelism (users who are actively sharing and recommending your app) while they are
engaged with your app. It therefore often represents the exact financial value of your individual customers, and it is a perfect starting point to analyze which cohort of users is the most valuable type of customer. The
identification of these “valuable” types of customers is the primary way to optimize your marketing campaigns and to spend your marketing budget exactly on the type of users that generate the most LTV. An example of a valuable customer who downloaded a sports and workout app could be one who is older than 25, has a high income, makes regular high-priced
purchases, and actively shares sporting experiences in social networks. Today most mobile and web analytics frameworks are able to track the individual revenue your customers generate by collecting all types of
engagements, such as purchases across multiple apps, valuable referrals, or number of advertisements that were clicked on.
The lifetime value metric often is split into average LTV per month or per customer in order to get some trends or to review the overall financial revenue generated by a marketing campaign.
https://get.fabric.io http://www.flurry.com
Chapter 3. Real User Experience
This chapter focuses on metrics that help you to understand the usability and stability of your app. Measuring the performance and response time of your mobile app helps to pinpoint slowly reacting user actions. Collecting and reviewing fatal program crashes is one of the fundamental activities for improving upcoming app versions. Reducing the overall number of app crashes also means decreasing the churn rate of your customers and improving the reliability of your native mobile apps.
One of the most important requirements for mobile apps is to guarantee a high degree of usability by fulfilling essential functionality for your users. Your mobile app has to offer enough stickiness so that the users continue to use it over a longer period of time. Each user evaluates many different apps in a very short time, but may only keep a few.
That said, it is obvious that your app’s usability and reliability play a major role, not only for increasing its Lifetime Value (LTV), but also for acquiring new users, as negative user reviews within the global marketplaces have an immediate effect.
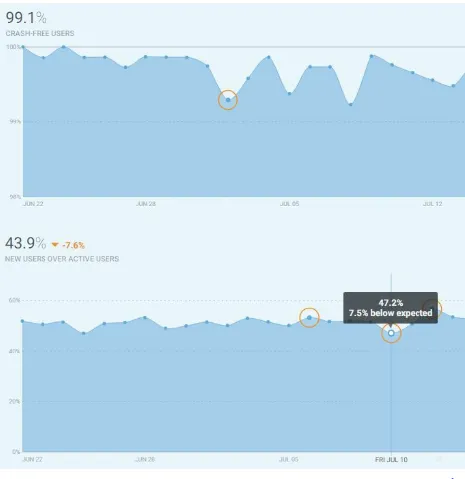
Most of the mobile analytics solutions are able to visualize the negative effect of increased app crashes on user acquisition numbers. Figure 3-1 shows that for that specific app there was a slight decrease of crash-free users around July 8th, which could be the reason for a slight decrease of daily new user acquisitions two days later, around July 10th. You can easily test this
Figure 3-1. Correlation of crash-free users and acquisition of new users (Image courtesy of Fabric1)
NOTE
User reviews and comments are merciless and have an immediate negative impact on your acquisition and stickiness metrics. So the overall effort should always be to avoid
Crashes
Usability and reliability within mobile app development mostly depend on effective crash reporting and analytics. Every serious app publisher largely depends on a good crash-reporting framework that collects all crashes
directly on the different user devices, symbolicates the crash stack traces, and aggregates similar crash types in real time. Your development team depends on these crash reports to find out which cohorts of devices are impacted by a crash type and how to fix the issue within the next release version of your app. The severity of a crash type is often measured by the number of unique users affected by a crash and the absolute number of crashes that appeared within a specified period of time. Especially after the release of a new app version, your dev team will monitor the crash metrics with great interest to see if the new release introduced some new fatal bugs, or on the more positive side, fix a lot of already-known issues in older versions.
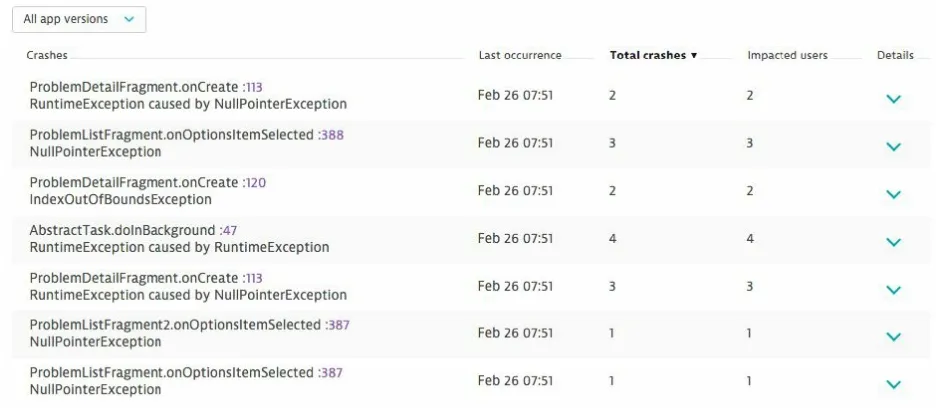
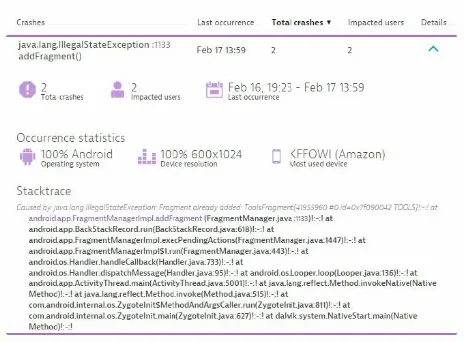
Figure 3-2 shows the collected list of crashes that were recorded within the lifetime of a specific app. The list shows seven major crash types and where within the code they occurred. This nearly empty crash list shows a one-to-one relationship between crashes that appeared and the number of unique users who were affected by a crash type, which is not a typical situation in real-world scenarios where the number of crashes is significantly higher than the number of impacted unique users. The reason for a higher crash count lies in the fact that typically a user tries and crashes several times until she stops testing out the app or this specific failing functionality.
Monitor App Performance
Slow application response is annoying for users. Mobile app design relies heavily on asynchronous tasks that should not directly block the interaction between users and an app. Good and efficient app design means reducing users’ waiting times to a bare minimum — or where waiting is inevitable, distracting the user while necessary pieces of information are loaded in the background. In a reactive mobile app, user actions should return a visual result with a minimum of waiting time; web-request actions that fetch data should be fast; and the amount of data pulled over the network should be as small as possible.
NOTE
It is generally considered that the network infrastructure, especially in emerging markets such as India or China, develops at a much slower pace than mobile hardware. This means that web-request performance and payload size play a major role in the architecture of highly reactive mobile apps.
In most cases, detailed monitoring of an existing mobile app already shows where performance bottlenecks are hidden and which user actions should be reconsidered to speed up reaction times for users.
Mobile apps as well as Web applications rely on third-party network
resources such as social logins, social sharing, images or messages, real-time notifications, and many more. During the design and operation of your
mobile apps, keep in mind that your own first-party services and resources can slow down your app as much as the loading times of your third-party network resources can.
NOTE
In order to get an overview of how your mobile app performs while loading network resources, you must monitor every outgoing network request, its error rate, as well as its payload sizes and resulting response times.
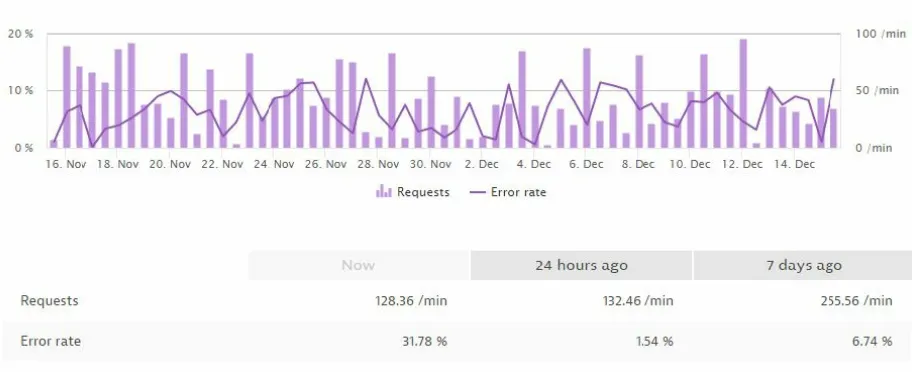
Figure 3-4 shows a chart visualizing the aggregated number of HTTP requests that a mobile app was calling within a given timeframe. The chart also shows the related error rate that was monitored for all these HTTP requests. Mind that this aggregated number of HTTP requests and error rate represents the overall number of all called HTTP requests of all app
installations worldwide. For high-traffic mobile apps these numbers can reach millions of HTTP calls per day, while the error rate should be as low as possible. A high HTTP error rate often perfectly correlates with an increased crash rate, as many mobile apps do not handle failing web requests in a
reliable way. There are various reasons why the HTTP error rate can increase during the operation of a published mobile app. An obvious reason could be a resource contention or even a process crash within a backend service that negatively influences the app.
NOTE
If several mobile app release versions are accessing different backend services, it could also mean that your infrastructure shut down a service that was still in use by one of your older app versions. In that case, splitting the metrics according to the different app versions could be of interest.
Another reason for failing HTTP requests after a new app version was
published is often related to a problematic implementation. The hours after a new app version was released are always the most interesting ones, as they show how the app will work out in a global context. As modern apps are shipped worldwide on thousands of different devices, even with high integration and real-device testing effort it is hard to predict if an app will provide the demanded quality and stability in a real-world scenario.
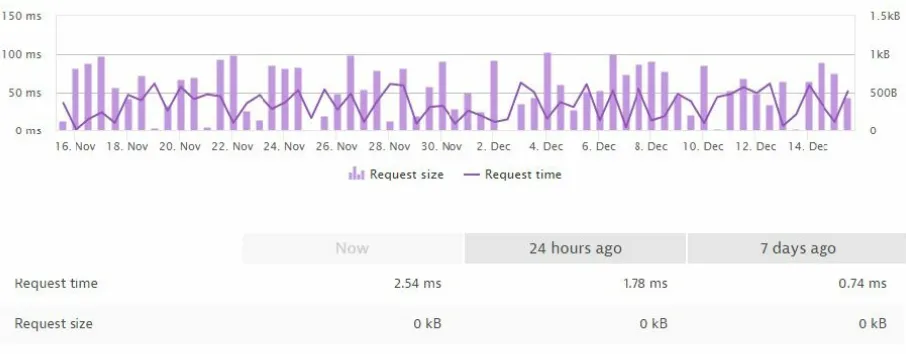
Today, app designers try to minimize the amount of data transferred to
Figure 3-5. Comparison of the HTTP request size with the request times
https://get.fabric.io
http://www.dynatrace.com/en/ruxit http://www.dynatrace.com/en/ruxit
Chapter 4. Topology
For DevOps controlling and monitoring mobile apps along a multitude of backend services and infrastructure, it is of tremendous interest to oversee the service and infrastructure dependencies of all published app versions in real time.
Modern monitoring solutions often just show one aspect of the entire picture, such as single metrics for server-side service performance or mobile app usage and install statistics. What these isolated monitoring technologies miss is a complete picture of mobile apps and how they are embedded within a global backend infrastructure. As today’s infrastructure is widely distributed across many different datacenters worldwide, it is necessary to span this big picture from datacenters and hosts up to processes and service levels.
NOTE
Within highly dynamic and virtualized infrastructure like the Docker environment, it is even more important to keep track of ongoing changes in the backend services at real time, as slight changes within the configuration could have fatal effects on your app’s crash rate.
In order to provide this big picture, it is necessary to monitor every single part within a complex environment, along with detailed mobile app
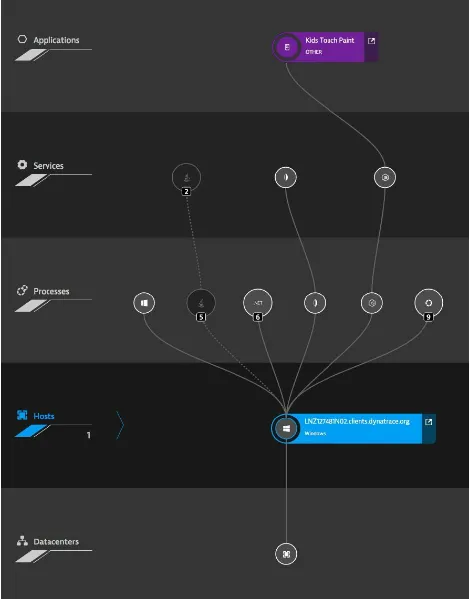
Dynatrace Ruxit1)
Figure 4-1 shows a simple native app that depends on a Node.js backend service that is running on a Windows host. This perfectly shows the
dependency from the datacenter level up to the application layer, where the mobile app is providing its functionality to real users. By detecting and
visualizing this topology information for DevOps in real time, the monitoring solution becomes one of the most important tools for overseeing your
business operation on a technical level. The real-time topology information, such as the smartscape2 view shown in Figure 4-1, helps you react
immediately if problems are detected and some of your apps show a negative impact on your real user’s experience.
http://www.dynatrace.com/en/ruxit
http://www.dynatrace.com/en/ruxit/capabilities/why-ruxit/smartscape-visualization
Chapter 5. Visual Session
Tracking
Visual session tracking introduces a completely new way of following your users’ individual actions while they are navigating through your mobile app. In terms of high-traffic mobile apps, this means somehow aggregating and visualizing this collected information for the app publisher.
Many monitoring frameworks visualize the aggregated interaction
information for a single app view by using heat maps, which show where most users are touching the screen. Even the seemingly simple task of
visualizing a heat map as a screen overlay hides a quite complex task for any analytics framework. As most analytics frameworks do not possess a
rendered screen image of the selected app screen for a specific platform, the rendered heat map represents a rough approximation for a specific screen resolution only. The combination of all available screen resolutions, screen rotations and densities with platform versions, and screen languages for one platform (such as Android) results in an exponentially large number of rendering possibilities. Even more important, the analytics framework does not know which content an individual user already created and how the app screen looks when this individual data is applied.
The exemplified rendering of app screens is just a rough estimation of how the screen would look on devices with the same resolution, but does not give any hint of how your app really looks on a specific hardware device, filled with a lot of user data.
Figure 5-1. Heatmap visualization of aggregated user touches within a single app view.
Another important step on the way to understanding how users interact with a specific app is to follow the users’ navigational path and discover what they experience on each app page. By following the users’ path we can also discover where they experience crashes or where most of them drop off. The navigation path is valuable information for app publishers if all the app’s features are reached by their customers. App publishers review aggregated navigation paths to discover potential improvements in the interaction of their apps. The aggregated information about the users’ navigation paths is
visualized as a classic flow diagram that starts at the entry page of the app. Each step of the flow diagram shows the next page the users visited, along with the percentage of users who ended their session after visiting that page.
Figure 5-2. Interaction flow visualizes the users’ navigation between a set of application pages
All the examples above work with aggregated information about users’ behavior instead of focusing on one individual user session. Aggregated information has many advantages compared to individual session
information, as it shows the behavior of an entire group of people (also called a cohort of users). In terms of high-traffic apps, the individual session
calls in and complains about a crash.
The so called “customer complained resolution” story demands on the one hand that all sessions are stored so that all customers’ sessions can be found, and on the other hand needs detailed information about this identified single session. Within analytics frameworks that use data sampling to reduce the amount of incoming data, it is possible that the demanded user session was dropped.
In recent years, mobile device capabilities (and to some extent, network bandwidth) increased a lot. Today it seems possible to record even a visual session of an individual user navigating through a mobile app. Considering the huge amount of storage and bandwidth that would be necessary to
visually capture, transmit, and store all user sessions, it is still only possible to grab a subset of session samples. An interesting use case could be to record only the first session of a device or resolution in order to get a visual
impression how an app is rendered on this new hardware. Another use case could be to specifically select a customer in order to record his session during a customer complained resolution process.
WARNING
A critical concern for the visual recording of app usage is the fact that it is nearly impossible to blur out critical user information that is shown on users’ app screens.
Chapter 6. Instrumentation of a
Mobile App
To collect the metrics that were discussed in previous chapters, it is necessary to instrument your mobile apps before they are published. The purpose of this chapter is to give some details about the steps that are necessary to instrument your own mobile app on the technical side, and to distinguish between
automated and manual instrumentation. Global marketplaces deliver native mobile apps to customers’ mobile devices, and the client-side operating systems execute them in a sandbox to prevent any potential harm to the customers’ smartphones. While server-side program instrumentation is often achieved by using profiling interfaces of standard virtual machines (VMs) and by hooking into the underlying operating systems, the monitoring of native mobile apps has to work in a different way to collect the demanded metrics without violating the client-side sandbox. Without the possibility of applying a profiling agent on millions of client smartphones and tablets, app publishers package and ship their native mobile apps together with the
monitoring agent, as shown in Figure 6-1.
In order to monitor the usage of native mobile apps directly on customers’ smartphones and tablets, an app publisher has to select a monitoring agent, instrument the app, and package it along with the agent library. The publisher has to sign the entire app package that also contains the monitoring agent in order to upload it to one of the global marketplaces. Shipping the agent library along with the regular native app also means that the publisher has to minimize the agent’s footprint in terms of performance overhead, bandwidth usage, and additional app size. The monitoring agent modifies the original app program to collect specific information, either about the mobile app or about the surrounding client system context. Figure 6-1 shows that the
Figure 6-1. App publishing with packaged agent library
Therefore, any downloaded app has to run within a secure sandbox, to
prevent to damaging a client smartphone. This sandbox is also responsible for granting specific rights, such as network or storage access. The client-side OS sandbox also restricts the access of system and device information for a
monitoring agent. One precondition for monitoring a mobile app from inside a sandbox is, of course, that the monitored app has network permissions; otherwise, the agent is not able to deliver its findings back to the collecting SaaS cluster. Android and iOS sandboxes allow the agent to collect typical device information. Some examples for device context information:
Firmware version, e.g., Android 4.0.3 or iOS 8.3.
Device model, e.g., Motorola XT1032 or Asus Google Nexus 7.
CPU type, e.g., ARMv7 rev 3 (v7l).
Memory, the total and free amount of system memory.
Display resolution and orientation information, e.g., 1280x720 running in landscape mode.
Battery level, e.g., a device is running at 80% battery level.
Network type, a device’s network type and carrier information, e.g., 3G Deutsche Telekom or WiFi.
In general, we distinguish among several different ways of instrumenting the original app program. One of the most critical aspects during the
instrumentation process is that the modifications do not break the original mobile app functionality, or in the worst case, crash the app on the customer side. Especially in scenarios where the app publishers are instrumenting their apps with more than one monitoring agent, the probability of unexpected side effects grows significantly.
Automated Instrumentation
Automated program code instrumentation frees the programmer as well as the app publishers of most of the cumbersome manual instrumentation tasks. Automated instrumentation traverses your program (byte) code and identifies interesting locations. Interesting locations are parts of the code where the app triggers user actions, such as page or view changes, or performs network requests that could take some time to return delivering the requested payloads.
Once the instrumentation algorithm identifies such places within your program, it automatically inserts monitoring instrumentation code. A
monitoring routine that comes with an agent library then collects all the user actions along a user session at runtime. Once a user session is finished or a specified caching period is exceeded, the monitoring routine sends its collected information to a central cluster for further analysis.
One way to instrument mobile applications is to add an additional task during the build process of an application that traverses the entire program structure and adds additional calls into the monitoring library at interesting program locations. In order to check if the users are entering a specific application activity within an Android app, we add one additional call that signals the entering and one call for the exiting of the activity. The following example shows how to insert monitoring instrumentation at the beginning and at the end of an Android activity. The example shows a smali1 disassembled dalvik
bytecode sequence of instrumented program code:
# virtual methods
.line 61
The next example shows how to automatically track the execution of HTTP requests and measure their timings. There is no standard way of executing HTTP requests within the Android SDK, so the automated instrumentation process has to cope with several different third-party libraries, where the Apache HTTP client library is the most frequently used one. The following example shows a typical Apache HTTP GET request that fetches the content of http://www.google.com. The automated instrumentation adds additional callbacks at two locations. After the HttpRequest object creation, the first callback reads basic information about the HTTP request and adds some tracking information. The second monitoring callback measures the execution time at the client side, while the server correlation uses the previously
attached session beacon to measure the server-side request performance.
const-string v7, "http://www.google.com" invoke-direct {v3, v7},
Lorg/apache/http/client/methods/HttpGet; -><init>(Ljava/lang/String;)V
invoke-static {v3},
Lcom/ruxit/apm/Callback;
->newInstance(Lorg/apache/…/HttpRequestBase;)V .line 29
Automated instrumentation has many advantages over manual source code instrumentation, including:
Massive reduction of effort for development, as the original source code does not need to be modified.
that are new and need additional monitoring instructions.
Ease of switching between different monitoring frameworks, as there is no monitoring-framework-dependent instrumentation code to change.
Beside the numerous advantages of an automated instrumentation, there are some drawbacks, including:
Automated instrumentation has to identify and support many different third-party UIs as well as communication framework, in order to work as expected.
Manual Instrumentation
Manual program code instrumentation completely relies on programmers to add monitoring probes to their own code. Instead of automatically adding monitoring instrumentation, the programmers have to insert specific
instructions. Examples here are to measure the entry and exit of important methods or UI views as well as to measure execution times. Most analytics frameworks also offer custom events to send notifications about important events such as purchases, logins, or shopping cart checkouts. Within business intelligence, these custom events often mark the reach of a specific funnel step.
The following example shows how to add a manual source code instruction to track a custom event. This specific event tracks a purchase triggered by a customer.
.logPurchase(new PurchaseEvent()
.putItemPrice(BigDecimal.valueOf(13.50)) .putCurrency(Currency.getInstance("USD")) .putItemName("Answers Shirt")
.putItemType("Apparel") .putItemId("sku-350") .putSuccess(true));
Capture App Crashes
Stable and reliable mobile apps should handle unexpected situations, such as connection timeouts, missing data, or malicious user input, gracefully. In cases where the mobile app error and exception handling is not correctly implemented, a mobile app crashes and users are annoyed. The underlying operating system of your smartphone catches all app crashes that are not correctly handled by the app program code and creates a crash report. A crash report contains all necessary information for the developers to find and fix a given issue. A typical crash report summarizes and stores
information about the crash context, the device state, and the app program state at the time the crash happened. The crash context represents an
individual device state, such as number of running apps, free memory, or the device’s battery level. The app program state on the other side gives some feedback about the running threads and thread states at the time of the crash as well as the complete stack trace of the crashed thread.
Crash reports on different platforms, such as on iOS or Android, look
fundamentally different. The following example below shows a symbolicated crash report that was stored on an Android device. It shows the Java stack trace of a NullPointerException that was not handled gracefully by the app’s exception and error-handling routines. The crash report also shows that the exception occurred within a class called StartActivity in the source code at line 26.
FATAL EXCEPTION: main
Process: easytravel.ruxit.com.easytravelapp, PID: 10853
java.lang.NullPointerException
at easytravel.ruxit.com.easytravelapp.
StartActivity$1.onClick(StartActivity.java:26)
at android.view.View.performClick(View.java:4811)
at android.view.View.performClick.run(View.java:20136) at android.os.Handler.handleCallback(Handler.java:815) at android.os.Handler.dispatchMessage(Handler.java:104) at android.os.Looper.loop(Looper.java:194)
at com.android.internal.os.ZygoteInit$MethodAndArgsCaller
.run(ZygoteInit.java:964)
at com.android.internal.os.ZygoteInit.main(ZygoteInit.java:759)
If the publisher decided to obfuscate the application package, in order to prevent simple decompilation, the same crash report would look like
following example. In obfuscated crash reports all the symbols, such as class names and source file names as well as source code locations, are removed.
FATAL EXCEPTION: main
Process: easytravel.ruxit.com.easytravelapp, PID: 10853
java.lang.NullPointerException
at easytravel.ruxit.com.easytravelapp.a.onClick(Unknown Source)
at android.view.View.performClick(View.java:4811)
at android.view.View.performClick.run(View.java:20136) at android.os.Handler.handleCallback(Handler.java:815) at android.os.Handler.dispatchMessage(Handler.java:104) at android.os.Looper.loop(Looper.java:194)
at android.app.ActivityThread.main(ActivityThread.java:5549) <2 internal calls>
at com.android.internal.os.ZygoteInit$MethodAndArgsCaller
.run(ZygoteInit.java:964)
at com.android.internal.os.ZygoteInit.main(ZygoteInit.java:759)
The following example shows how a typical crash report on iOS devices will look. The iOS crash report starts with a general header containing
information about the crashed process, the hardware device, and crash time, followed by a detailed list of stack traces of the crashed process. App-specific parts of the stack trace are highlighted.
Incident Identifier: 049B202B-50F9-4389-9CE8-E7D25576D9DA CrashReporter Key: 4d06e5a5fdacc81578fbeabcaff821bd06d721a7 Hardware Model: iPad5,3
Identifier: com.dynatrace.demoapps.easyTravel Version: 6.3.16.0211 (6.3)
Code Type: ARM-64 (Native) Parent Process: launchd [1]
Launch Time: 2016-02-25 14:20:34.34 +0100 OS Version: iOS 9.2.1 (13D15)
Report Version: 105
Exception Type: EXC_CRASH (SIGABRT)
Exception Codes: 0x0000000000000000, 0x0000000000000000
0 CoreFoundation 0x180d41900 __exceptionPreprocess + 124 1 libobjc.A.dylib 0x1803aff80 objc_exception_throw + 56 2 CoreFoundation 0x180cbd478
-[__NSArray0 objectAtIndex:] + 112 processAction:sender:forEvent:]
(CPWRInternalActionManager.m:1425) 5 easyTravel 0x1000ca49c
-[CPWRInternalActionManager processActionTouchDown:forEvent:]
(CPWRInternalActionManager.m:1107) 14 CoreFoundation 0x180cf8efc
15 CoreFoundation 0x180cf8990 __CFRunLoopDoSources0 + 540 16 CoreFoundation 0x180cf6690 __CFRunLoopRun + 724
17 CoreFoundation 0x180c25680 CFRunLoopRunSpecific + 384 18 GraphicsServices 0x182134088 GSEventRunModal + 180
19 UIKit 0x185a9cd90 UIApplicationMain + 204 20 easyTravel 0x1000a6848 main (main.m:16)
21 libdyld.dylib 0x1807c68b8 start + 4
OBFUSCATION AND SYMBOLICATION
App developers obfuscate their binary application package to strip out any human readable information, such as class, variable and source code file names, as well as line numbers. The goal of obfuscation is to hide implementation details and to make the decompilation of an application as hard as possible. Tools like ProGuard2 are used to obfuscate application packages; in addition to all the other benefits of obfuscation, it also makes sire that crash reports are obfuscated.
Build Tool Support
Nowadays, agile software development is much driven by continuous integration that introduced a high degree of build automation, tool support, and quick release cycles. App releases are published in weekly iterations, and user-experience monitoring had to follow that continuous integration
approach. Modern mobile monitoring frameworks offer a seamless integration into build tool chains such as Gradle3 on the Android side or
CocoaPods4 for Objective-C programming language apps.
In most cases it is only necessary to add a few lines of configuration within a Gradle config file or within a CocoaPods specification file in order to enable automatic user-experience monitoring of your own app. The configuration is responsible for executing the following tasks within your own build process: 1. Load the latest version of an instrumentation plug-in from a central
repository.
2. Automatically download and link your app project with the latest monitoring libraries.
3. Automatically instrument your application code during the build process.
4. Upload the symbolication mapping file after each release in order to automatically translate your crash reports back to human-readable form.
The following example shows how to enable user-experience monitoring by adding some configuration lines within a typical Gradle file. All monitoring related configuration parts are shown in bold text:
buildscript {
repositories { jcenter() }
classpath 'com.android.tools.build:gradle:1.5.0'
classpath 'com.dynatrace.ruxit.tools:android:+'
}
applicationId '2a68662d-3c5b-4f9d-a15c-c40431035e54'
environmentId 'fdi96078'
buildToolsVersion "21.1.2"
defaultConfig {
applicationId "com.ruxit.easytravel"
minSdkVersion 9 compile files('libs/commons-lang3-3.1.jar')
}
smali/baksmali, assembler/disassembler for the dex format used by dalvik, Android’s Java VM implementation, https://github.com/JesusFreke/smali
ProGuard, free Java class file shrinker, optimizer, obfuscator, and preverifier,
http://proguard.sourceforge.net
Gradle, open source build automation system, http://gradle.org
CocoaPods, application level dependency manager for the Objective-C programming language,
https://cocoapods.org
1
2
Chapter 7. Conclusion
Monitoring of native mobile apps and how they perform alongside backend service infrastructure plays an important role with digital businesses today. Many disruptive business models, such as Uber or Airbnb, heavily rely on personalized mobile apps to increase user engagement. As the Uber app counts around 100 million downloaded apps within the Google Play
marketplace alone, the real-time monitoring of such a vast quantity of apps on individual smartphones poses a big challenge for modern monitoring and analytic frameworks as well as for the app publishers.
This book introduced some key metrics that are necessary to gain a deeper understanding how real users are experiencing a mobile app. App publishers are closely reviewing engagement metrics, user behavior, and crash reports in real time to guarantee that the mobile app experience is not lacking. Common experience shows that one error-prone app release can trigger a large number of negative marketplace reviews. Negative marketplace reviews immediately damage the public image of a business and are directly responsible for
reducing the financial revenues, in terms of conversion to paying users. Even the number of newly acquired users directly correlates with the number of negative reviews within the app marketplaces.
Glossary
Active user
A user who had at least one action or session within a given period of time.
New user
A user who installed an app for the first time. Every user is counted as new user just once at app installation time.
Recurring users
Measures all the active users who were already using the app some time before. To measure the recurring users metric, subtract all the new users from the overall number of active users.
Unique users
Measures the number of distinct users within a given period of time. The metric of unique users estimates how many real people were active
within a period of time, or were affected by a slowdown or an app crash; this metric does not count the same user twice.
Concurrent users
Often used to measure the number of unique users who are active during the same period of time. This metric represents the number of users that were operating an app during the same timeframe, such as one minute. As the definition of active is dependent on the definition of the session length and timeouts, this metric can vary a lot between different
monitoring systems. Daily active users (DAU)
The number of active users within a given month. Session
Defines one use of an app by a user. A session starts when the user launches the app, continues as long as the user takes any actions within the app, and ends either by the user suspending the app or, alternatively, by a defined timeout. The definition of a session depends on the
analytics framework you are using, as the session timeout could be from a minute to up to half an hour. Many analytics frameworks even store user’s session offline when no Internet connection could be acquired and send it after a connection has been reestablished.
Session length
The session length measures the time between the start and end of a single user session. Session length provides a good metric for measuring how much time users spend within your app. As the different analytics frameworks define a user session differently and session timeouts vary, this measure has to be used with care.
User acquisition
Acquisition of new users is measured by monitoring different
acquisition channels. As modern monitoring frameworks grow into traditional business intelligence domains, many of the existing analytic frameworks offer acquisition channel tracking for measuring the number of acquired users per active acquisition channel.
User path
The action path a given user performs during an app session. A user path specifies the temporal order of a session of monitored user actions. User paths are often shown in conjunction with crash reports to get some insights about possible root causes.
Crash
A crash unexpectedly ends a user’s running session. The crash action therefore represents the final and fatal last user action in a given user path. A crash could have many different root causes and is not
Crash dump
Detailed information that the operating system platform delivers after an app was unexpectedly crashing. The detailed crash dump is operating system and language dependent and contains detailed information about the location of the crash within the apps code.
Symbolication
Symbolication means to translate an obfuscated crash dump into
symbolic information so that the exact location of a crash can be found by a programmer. Without symbolication the crash dump only shows obfuscated addresses to hide the internal structure of an app from curious looks.
Crash rate
The percentage of users who experienced a crash during their app usage. The crash rate represents a good measure for rating the reliability and overall quality of apps. The crash rate could be calculated by either measuring the rate of crashed users or the rate of sessions ending with a crash.
Crash-free users
A popular measurement for the rate of users who were able to use an app without any crash experience. In an optimal situation this crash-free user rate should be near 100%.
User retention
User retention measures how many of your users are returning and working with your app after a specified period of time. There are many different ways of calculating the user retention depending on different periods of time and on different definitions of what returning actually means.
Rolling retention
after.
Version adoption
Version adoption measures or visualizes how fast the user base of a given app adopts a new version. A high and fast adoption rate is often an indicator of a very active user base and a sticky app, while a low
adoption rate could indicate a high possibility for churning users. Personas
A subcategory within behavioral analytics that tries to classify groups of users according to their common interests. A persona summarizes the typical behavior of a user in the group as well as common interests among users in the group into a prototypical user representing that
group. Personas are used to define requirements in software engineering as well as to define focused marketing strategies.
Funnel
A funnel is a pipe of predefined subgoals along a user’s action path that lead to the ultimate conversion goal of transforming a trial user in to a paid customer. A funnel definition is one of the most important tools for marketing analysts and growth hackers to measure their success in
acquiring valuable prospects who turn into paying customers with a high lifetime value (LTV).
Conversion
Measures the reach of a specified goal, typically at the end of a funnel definition. Originally a conversion measured the successful
transformation of a free user account to a paid customer account. Lifetime value (LTV)
Measures the monetary value of the time a user spent in an app during her lifetime. The lifetime typically is measured between the user
About the Author
Foreword 1. Introduction
2. Measure App Success Counting Installations Active and New Users Measure User Engagement
User Sessions
Retention and Churn Business Intelligence
Personas
Lifetime Value (LTV) 3. Real User Experience
Crashes
Monitor App Performance 4. Topology
5. Visual Session Tracking