THE JOURNAL OF FINANCE•VOL. LXX, NO. 1•FEBRUARY 2015
Do Acquisitions Relieve Target Firms’ Financial
Constraints?
ISIL EREL, YEEJIN JANG, and MICHAEL S. WEISBACH∗
ABSTRACT
Managers often claim that target firms are financially constrained prior to being acquired and that these constraints are eased following the acquisition. Using a large sample of European acquisitions, we document that the level of cash that target firms hold, the sensitivity of cash to cash flow, and the sensitivity of investment to cash flow all decline, while investment increases following the acquisition. These effects are stronger in deals that are more likely to be associated with financing improvements. Our findings suggest that acquisitions relieve financial frictions in target firms, especially when the target firm is relatively small.
IN A WORLD WITHimperfect capital markets, firms sometimes face financial
con-straints and have to forgo valuable investment opportunities. For firms in this situation, an acquisition can potentially mitigate such constraints if the ac-quirer’s access to capital enables the target to undertake an increased number of positive net present value investments. Being part of a larger organization subsequent to an acquisition can improve financing through better direct ac-cess to capital markets, and also by the possibility of a reallocation of capital across divisions (see, e.g., Stein (2003)). Accordingly, practitioners often justify acquisitions by claiming that acquirers can better expand the target’s oper-ations because of both their internally generated cash flow and their ability to raise capital externally.1 Yet despite the enormous literature on mergers
∗Isil Erel is with Ohio State University, Yeejin Jang is with Purdue University, and Michael S. Weisbach is with Ohio State University, NBER, and SIFR. Isil Erel and Michael Weisbach are Fellows of the National Center for the Middle Market at the Fisher College of Business, Ohio State University, and acknowledge the Center’s support for this research. We thank Heitor Almeida, Bo Becker, Murillo Campello, Panagiotis Dontis Charitos, Serdar Dinc, Mara Faccio, Joan Farre-Mensa, Antonio Galvao, Shan Ge, Cam Harvey, Jerry Hoberg, Byoung-Hyoun Hwang, Andrew Karolyi, Sandy Klasa, David McLean, Berk Sensoy, Ren´e Stulz, Tracy Wang, Jun Yang, two referees, an Associate Editor, as well as seminar participants at Amsterdam, Boston College, Brandeis, Cornell, Michigan, Minnesota, Nanyang Technical University, National University of Singapore, Northeastern, Ohio State, Singapore Management University, Purdue, European Win-ter Finance Summit 2013, UBC WinWin-ter Finance Conference, FIRS 2013 Conference, and the 2013 Multinational Finance Society Conference for helpful suggestions. We received excellent research assistance from Jongsik Park.
1For example, theFinancial Timesreported that AstraZeneca and Glaxo SmithKline were
looking to acquire smaller biotech companies during the financial crisis because they were better
DOI: 10.1111/jofi.12155
290 The Journal of FinanceR
and acquisitions, the extent to which acquisitions lower financial constraints is unknown.
One potential reason financial constraints in target firms have not been evaluated empirically is that the implications of financial constraints concern the financial policies of the target firm and the way in which they change following the acquisition. Evaluating these predictions requires financial data on target firms before and after the acquisition. In the United States, such data are not publicly available. However, most European countries require disclosure of financial data for subsidiaries, so it is possible to observe the financial statements of targets both before and after they are acquired, as long as the target remains an independent subsidiary following the acquisition.
Because of this disclosure requirement, we are able to construct a sample of 5,187 European acquisitions occurring from 2001 to 2008, each of which became a wholly owned subsidiary subsequent to the acquisition. This sample contains both domestic (63%) and cross-border (37%) deals, and acquisitions by both public (36%) and private (64%) firms. Most of the targets (97.4%) are private firms; 71.6% are independent firms, while the remaining targets are subsidiaries of other firms prior to the acquisition. We measure the target firms’ cash and investment policies before and after the acquisition, and evaluate the extent to which the acquisition led to improved access to capital.
To assess whether financial constraints are mitigated by acquisitions re-quires that one can measure constraints in a particular target firm both before and after being acquired. While there are many ways to measure financial con-straints, particularly useful ones come from observing managers’ own actions regarding their financial position. When access to capital markets is imperfect, value maximization will lead managers to adopt financial policies that ensure that the most important investments continue to be financed. One such policy is to hold more cash on the balance sheet, so cash holdings should be higher when managers believe they face greater financial constraints.2 In addition,
the literature argues that, when faced with financial constraints, the effect of a firm’s incremental cash flow on both investment and cash holdings should be higher (see Fazzari, Hubbard, and Petersen (1988) and Almeida, Campello, and Weisbach (2004)).3 Therefore, a decline in the target’s cash holdings,
investment–cash flow sensitivity, and cash–cash flow sensitivity following an acquisition would suggest that the target’s financial constraints are reduced when a target is acquired.
able to fund those companies’ investments than potential targets could do on their own. (Financial Times, September 25, 2009)
2This argument dates to Keynes (1936) and has been developed and confirmed empirically in a
recent literature beginning with Opler et al. (1999). For a practitioner’s take on this argument, see Passov (2003), who argues that precautionary considerations are relevant even for large companies like Pfizer, which at the time this article was written had a AAA bond rating.
3The issue of measuring financial constraints is controversial and each measure has limitations,
Do Acquisitions Relieve Target Firms’ Financial Constraints? 291
Using the above measures, we evaluate the extent to which target firms are financially constrained prior to being acquired, and the extent to which these constraints are reduced subsequent to the acquisition. The results suggest that target firms are indeed constrained prior to the acquisition, and that the constraints are lessened after the firms are acquired. In particular, we find that cash holdings, normalized by assets, decline by approximately 1.5% for an average target firm after being acquired. The sensitivity of cash to cash flow declines significantly from 10.4% to close to zero, which implies that the target firm goes from being constrained to unconstrained (see Almeida, Campello, and Weisbach (2004)). Finally, there is a statistically significant decline in the sensitivity of investment to cash flow, with the magnitude of the postacquisition sensitivity being less than half of that before the acquisition. All of these results are consistent with the view that acquisitions mitigate financial constraints, potentially providing a source of value by enabling target firms to improve their investment policy.
An implication of the financing view of acquisitions is that investment should rise following the acquisition. The results suggest that investment does in-crease for target firms in our sample. Controlling for other factors, investment as a fraction of total assets increases by 1.56% to 2% following the acquisition, which is a substantial effect given that the mean (median) investment ratio is 6.4% (3.4%) for targets before the acquisition.
If the estimated declines in cash holdings and the sensitivities of investment and cash to cash flow reflect the easing of financial constraints because of the acquisition, then these declines should be larger following acquisitions that are more likely to increase the ability of firms to finance investment. For exam-ple, the decline in cash holdings and sensitivities should be larger following acquisitions of independent firms than following acquisitions of subsidiaries of other firms. Consistent with this prediction, we find that, for independent targets, their cash-to-asset ratio decreases by 1.8%, the cash flow sensitivity of cash decreases by 8.2%, and the cash flow sensitivity of investment decreases by 5.2%. Each of these declines is statistically significantly different from zero. We do not find significant changes in the cash-to-asset ratio or either sensitivity when the target firm is a subsidiary of another firm. Overall, these findings are consistent with independent targets being more financially constrained than subsidiary targets prior to being acquired.
292 The Journal of FinanceR
Overall, the results suggest that managers of acquired firms change their financial policies in a manner consistent with their becoming less financially constrained following the acquisition. Target firms hold less cash, they save less cash out of incremental cash flows, their investment tends to be less correlated with cash flows, and they increase the quantity of their investments after they are acquired. These effects are larger when the target is most likely to be constrained prior to the acquisition. Presumably, the parent’s cash flows and access to capital markets allow the target firm to manage its financial position more efficiently.
This paper contributes to a long line of research on the motives for mergers and acquisitions. Early work in this area documents value increases associ-ated with mergers, taking the form of stock price increases as well as improved earnings for the combined firm relative to pre-merger levels.4Subsequent work
focuses on the sources of their gains. For a long time, the presumed source was efficiency gains. But the existence of efficiency gains was not empirically verified until plant-level data on production efficiency were available.5In
addi-tion, the literature has documented relatively small transfers to shareholders from other stakeholders such as employees, the government, and consumers.6
In terms of sources of gains arising from inefficiencies, the dramatic stock price increases of the 1990s prompted much work on price inefficiency as a motive.7
Yet there has been surprisingly little work on the role of improvements in financing efficiencies as a source of merger gains.8
Our paper is also related to the literature on the way firms transfer resources within firms through internal capital markets. Stein (1997) argues that, even if access to capital markets does not improve by combining divisions into firms, investment efficiency can be improved by reallocating investment across di-visions. Since there are likely to be improvements in direct capital access when firms are combined, the overall effect of combining firms on investment
4See Jensen and Ruback (1983) for a survey of the early merger event studies, and Healy, Palepu,
and Ruback (1992), who document that accounting performance increases following mergers of large public firms.
5See especially Schoar (2002) and Maksimovic, Phillips, and Prabhala (2011) for evidence on
post-merger plant-level efficiency improvements. Hoberg and Phillips (2010) also document evi-dence of product market synergies through a text-based analysis of product market language in 10-K filings.
6See Shleifer and Summers (1988) and Pontiff, Shleifer, and Weisbach (1990) for discussion and
evidence of transfers from employees through wage cuts and pension reversions, and Auerbach and Reishus (1988) and Hayn (1989) for transfers from the government through the tax system.
7See Shleifer and Vishny (2003) and Rhodes-Kropf, Robinson, and Viswanathan (2005). 8Three exceptions are Mantecon (2008), Almeida, Campello, and Hackbarth (2011), and Liao
Do Acquisitions Relieve Target Firms’ Financial Constraints? 293
efficiency is potentially substantial.9 The empirical literature has paid much
attention to comparing the values of diversified and single-segment firms, as well as the nature of cross-subsidization inside diversified firms. However, this literature has been criticized because divisions do not combine randomly into firms, and the empirical results could potentially be a consequence of nonran-dom selection rather than of internal capital markets.10Our results, while also
coming from nonrandom combinations of companies, are potentially cleaner than those in the internal capital markets literature since we can observe firms’ financial management policies both as separate entities and as part of new parents.
In a sense, the results in this paper are the mirror image of several papers that consider investment policies before and after divisions are spun off or di-vested from larger firms (see Gertner, Powers, and Scharfstein (2002), Dittmar and Shivdasani (2003), and Ahn and Denis (2004)). Similar to these papers, we find increasing investment, even though these papers study separations of firms while we evaluate combinations of different firms. Most likely, the prin-ciple that organizations tend to evolve toward efficiency holds here, and the inefficiencies from internal capital markets dominate in the samples of those papers, while the efficiencies due to being a subsidiary of a larger firm are most important in the sample of acquisitions considered here.
The remainder of the paper proceeds as follows. Section I describes the construction of our sample, presents statistics on this sample, and discusses conceptual and practical issues involved in measuring financial constraints. Section II presents tests of how cash levels, cash and investment sensitivi-ties with cash flow, and investment levels change when a firm is acquired. SectionIIIexamines the extent to which financial constraints are reduced in different kinds of acquisitions. Section IV analyzes possible explanations for the decline in targets’ financial constraints following acquisitions. Section V presents robustness checks that address alternative interpretations of our re-sults. SectionVIconcludes.
I. Measuring Financial Constraints in Acquired Firms
A. Data Availability
To evaluate the way in which financial constraints are affected by acqui-sitions, it is important to have access to a sample of acquisitions for which one can measure both the existence of constraints prior to a potential acqui-sition and how these constraints change following the acquiacqui-sition. A number
9But not necessarily. Scharfstein and Stein (2000) present a model in which combining firms
can create inefficient rent-seeking, and Ozbas and Scharfstein (2010) provide empirical support for this argument.
10See Berger and Ofek (1995) and Lang and Stulz (1994) for evidence on valuation differences,
294 The Journal of FinanceR
of approaches have been proposed to evaluate the magnitude of financial con-straints, most of which depend on access to financial data on the firm. Mea-suring thechange in this magnitude requires financial data for target firms both before and after the acquisition. Constructing a sample of acquisitions containing such data is not straightforward for a number of reasons.
Before being acquired, targets are either independent firms or subsidiaries of other companies. If the target is free standing and also publicly traded, dis-closure requirements in all countries ensure that financial data on the firm are publicly available. However, the vast majority of targets are private and/or sub-sidiaries of other corporations (see Ellis et al. (2012), Erel, Liao, and Weisbach (2012) and Netter, Stegemoller, and Wintoki (2011)). Given that it is impos-sible to obtain financial data for privately held firms or subsidiaries of public firms in the United States, estimating the extent to which acquisitions mitigate financial constraints would be difficult using U.S. data.11
Gathering financial data on the targets subsequent to the acquisition is even more problematic. In the United States, acquirers often integrate targets with their existing assets. Indeed, if operational synergies are the driving force behind the acquisition, then it is plausible that optimal use of these synergies will lead to integration of the two firms’ assets. Even if the assets are not inte-grated operationally, in the United States their financial data are sometimes consolidated with those of the rest of the acquiring firm. If financial statements are consolidated at the parent firm level, it is impossible to identify financial data from only the former target’s assets, since such data will be combined with the financial data from the new parent’s other assets.
B. European Financial Data
In contrast to the United States, most European countries require firms to report financial data publicly on anunconsolidated basis, even if they are privately held.12Thus, for most targets, it is possible to acquire financial data
prior to the acquisition, even if the firm is a subsidiary of another firm prior to being acquired. These data are accessible through the Amadeus database. Using this database, we construct a sample of acquisitions of European firms where target firms are operated as subsidiaries of their new parents following the acquisitions.13
11There are recently available databases assembled through accounting firms on privately held
U.S. firms such as Sageworks. However, in these databases, firms are generally anonymous, which would preclude matching targets to acquirers. See Asker, Farre-Mensa, and Ljungqvist (2011) and Farre-Mensa (2011) for more information on these data and examples of their use.
12There are some exceptions such as Switzerland, where not all private firms (except for banks
and insurance companies) are required to file. Also, filing requirements are not uniform across countries. For example, in the United Kingdom, firms are not required to report sales data. Fur-thermore, in some countries, subsidiaries in the smallest size category are not obligated to report their financials so we drop all subsidiaries in this size category from our sample.
13European firms can be targets of non-European acquirers. In such an acquisition, we
Do Acquisitions Relieve Target Firms’ Financial Constraints? 295
A potential concern is whether we can correctly track the target firm’s assets after the firm is acquired. One possibility is that the parent combines some of its other assets with those of the target firm and keeps them together organiza-tionally in a subsidiary that appears to consist of only the target firm’s assets. Therefore, we include in our sample only targets whose number of employees or size as measured by total assets (if data on number of employees are missing) does not change more than 100%.14
C. Sample Construction
We start with a sample of European acquisitions taken from the Zephyr database. We rely on Zephyr rather than the more commonly used SDC, because both Zephyr and Amadeus are provided by a common data vendor, Bureau Van Dyck, and therefore share firm identifiers. Because of the common firm identification, it is possible to match acquisitions from Zephyr to financial data from Amadeus more accurately than if one were to match SDC to Amadeus. In addition, Zephyr’s coverage of private-firm acquisitions is better than SDC’s.
Amadeus is structured so that each firm has a maximum of 10 observations, generally occurring between 2000 and 2009 in our sample.15To allow an
acqui-sition to have financial information for at least one year before and after the deal, we restrict the sample to those acquisitions occurring between 2001 and 2008, leaving one to eight years before and after an acquisition. We also require target firms to be from countries with at least 10 acquisition targets in this time period, eliminating 74 deals with targets from Cyprus, Iceland, Luxembourg, Macedonia, Lithuania, Malta, Moldova, Serbia, and Slovenia. We exclude deals in which the target is a financial firm, as well as restructurings, privatizations, LBOs, and exits from private equity deals. We also drop firms with less than 10 employees, with asset size less than $1 million, and without data on fixed assets for at least one year before and after the acquisition. We end up with a sample consisting of 5,187 deals with acquirers from 64 countries from all over the world and targets from 25 European countries.
D. Sample Characteristics
Amadeus provides a variety of financial data on our sample firms. How-ever, it does not contain data on capital expenditures, which is important for
acquirer’s financial information is needed, we restrict our sample to acquisitions with European firms as both acquirers and targets.
14This change is measured by comparing the average of the first two years available prior to the
acquisition to the average of the first two years available following it. We find qualitatively similar results when we only use firms whose number of employees or size changes by less than 10%. We present these results in the Internet Appendix, available in the online version of the article on the
Journal of Financewebsite.
15When we accessed the data set utilized in this paper, the last year fully covered was 2009.
296 The Journal of FinanceR
Table I
Statistics on the Acquisition Sample over Time
This table displays statistics on European targets from 2001 to 2008. The sample includes acqui-sitions of European targets, reported by the Zephyr database, with at least one year of financial data available (in Amadeus) before and after the acquisition. Financial firms, firms with less than 10 employees, and firms with total assets less than 1 million USD are excluded. The table presents the characteristics of acquisitions tabulated by deal completion year. The total assets of target firms are the averages of the last two years before the merger. Statistics in the last four columns are as of the last fiscal year-end before the deal is completed. Variable definitions are provided in the Appendix.
2001 228 76.850 7.233 62.95 72.81 95.18 46.05
2002 393 125.500 7.665 59.07 69.72 96.69 44.27
2003 429 57.448 7.528 61.20 62.47 97.20 29.37
2004 603 78.870 7.952 62.35 69.98 97.18 38.47
2005 768 94.849 8.628 63.53 67.97 97.40 36.72
2006 999 49.298 7.210 60.20 68.77 97.70 35.34
2007 1,270 38.377 7.270 65.51 77.48 97.72 34.96
2008 497 83.230 7.453 67.58 78.47 97.59 31.59
Total 5,187 67.716 7.578 63.05 71.58 97.36 36.11
understanding financial constraints. We therefore follow Becker and Sivadasan (2010) and Chung (2011) and estimate capital expenditures as the change in fixed assets plus depreciation, all of which are normalized by total assets. To reduce the effect of outliers in our data set, we trim accounting variables other than leverage at the top and bottom 1% of the distribution.16Leverage
(nor-malized by assets) is trimmed between zero and one.
TableIpresents statistics on the acquisition sample. Most deals are small, with a median target asset size of roughly $7.6 million. However, the size distribution is skewed, with a mean asset size of about $67.7 million, more than eight times the median. Almost two-thirds (63.1%) of the deals are domestic and almost three-fourths (71.6%) have independent targets (not subsidiaries of another firm). The vast majority (97.4%) of the acquisitions involve private targets and 36.1% of the deals are by publicly traded acquirers. The number of deals increases over time until 2007, and then declines with the financial crisis in 2008. The average deal size is larger in the earlier years of the sample, with a mean of $125.5 million in 2002 compared to $38.3 million in 2007. Combined with the lower number of deals in the early part of the sample, this pattern suggests that the sampling process becomes less restrictive over time, so that more (smaller) deals are included.
Do Acquisitions Relieve Target Firms’ Financial Constraints? 297
This table highlights that the target firms in our sample are quite small, and are likely to be firms for which an acquisition is a relatively attractive source of relieving financial constraints. As a comparison, between 2001 to 2008, the SDC database contained 1,872 European IPOs. The mean ($358 million) and median ($20 million) value of assets of these IPOs were more than twice our sample mean and median. The small size of our firms relative to those that go public suggests that the vast majority of our sample could not have gone public, and were also likely to be too small to access the public debt markets.
The Internet Appendix contains the distribution of the countries of the target firms in the sample. Almost 30% of the deals (1,527) involve U.K. targets. France has the second largest number of targets, with 748, and eight countries have between 200 and 350 targets. The United Kingdom also has targets of the largest average size, with a mean asset value of $114.2 million. However, there are also a lot of very small U.K. targets as illustrated by the median asset size of U.K. targets being only $6.8 million.
TableIIpresents summary statistics for the accounting variables of the tar-gets and acquirers in our sample, each computed as the average of the two years prior to the acquisition.17To calculate these statistics, we use data from
unconsolidated statements for the targets and from consolidated statements for the acquirers. Not surprisingly, targets are substantially smaller than ac-quirers, with a mean (median) target asset size of $67.7 million ($7.6 million), compared to a mean (median) acquirer asset size of $2,438.8 million ($172.9 million). Targets also hold more cash as a fraction of their assets, with a mean of 12.2%, compared to the mean of 9.8% for the acquirers. Targets have a lower investment-to-asset ratio (mean of 6.4%) than acquirers (mean of 12%).
For target firms, cash holdings decline following the acquisitions, as both the mean and the median cash holdings are higher in the two years before the acquisition compared with the holdings after the acquisition. In addition, the median gross investment-to-asset ratio declines after the acquisition. How-ever, it is difficult to draw inferences from this table. Secular trends as well as the changing composition of firms in the sample are likely to mask the incre-mental effect the acquisition has on these variables. To evaluate the effect of acquisitions on firms’ financial policies, it is important to hold firm composition constant over time and to control for other factors statistically.
E. Measuring Financial Constraints
Financial constraints occur when financial frictions cause firms to deviate from their first-best investments. When firms are constrained, the availabil-ity and pricing of financing in addition to a potential investment’s value will determine the projects a firm chooses to undertake.18
17Since some acquirers are not from Europe and hence not contained in the Amadeus data set,
and some others do not report consolidated statements, the number of acquirers for which we have accounting data is substantially smaller than the corresponding number of targets.
18Tirole (2006) provides a number of models in which constraints occur because of contracting
298
The
Journal
of
Finance
R
Table II
Summary Statistics on the Financial Variables of the Targets and Acquirers
This table presents summary statistics for the accounting variables of the targets as averages of the first two available years before and after the acquisition. All firm-level data are from Amadeus. Statistics are based on unconsolidated financial statements for the targets and consolidated financial statements for the acquirers. Variable definitions are provided in the Appendix.Total Assetsare in USD million. We assess the differences in means using the mean difference test and medians using the Wilcoxon-Mann-Whitney test. The symbols ***, **, and * denote statistical significance at the 1%, 5%, and 10% levels, respectively.
Target
Before After
Obs. Mean SD Median Obs. Mean SD Median
Total Assets 5,187 67.716 622.835 7.578 5,187 88.993 945.946 9.717***
Number of Employees 4,121 282.901 1,741.023 76.500 4,363 256.792 1,919.958 69.000***
Cash/Total Assets 5,002 0.122 0.145 0.064 4,936 0.103*** 0.127 0.054***
Gross Investment/Total Assets 4,148 0.064 0.107 0.034 4,484 0.062 0.118 0.027***
Cash Flows/Total Assets 4,305 0.077 0.139 0.082 4,413 0.068** 0.151 0.073***
ROA 4,126 0.110 0.154 0.109 4,270 0.093*** 0.168 0.094***
Sales Growth 2,464 0.133 0.344 0.068 2,663 0.131 0.433 0.058***
Leverage 4,541 0.577 0.229 0.594 4,341 0.552*** 0.241 0.564***
Acquirer
Before After
Obs. Mean SD Median Obs. Mean SD Median
Total Assets 1,429 2,438.834 11,215.136 172.891 1,504 3,394.176* 14,144.267 281.863***
Number of Employees 1,318 7,837.190 23,942.573 885.000 1,404 9,114.769 29,737.385 1,057.250***
Cash/Total Assets 1,406 0.098 0.100 0.063 1,492 0.077*** 0.077 0.050***
Gross Investment/Total Assets 1,144 0.120 0.146 0.081 1,029 0.099** 0.152 0.059***
Cash Flows/Total Assets 1,262 0.079 0.072 0.078 1,344 0.067*** 0.071 0.069***
ROA 1,352 0.096 0.075 0.089 1,423 0.083*** 0.071 0.078***
Sales Growth 807 0.201 0.425 0.108 725 0.133** 0.387 0.080***
Do Acquisitions Relieve Target Firms’ Financial Constraints? 299
Discussion of financial constraints goes back at least to Keynes (1936), who argues that, because of financial market frictions, firms hold cash as a precau-tion against potential future financial constraints. Firms’ optimal cash holdings will be determined by equating the incremental holding cost of cash with the ex-pected benefit in terms of improved investment coming from avoiding potential financing constraints. Consequently, firms’ cash holdings should be positively related to the degree to which firms expect to face financial constraints in the future. A large empirical literature beginning with Opler et al. (1999) confirms that, consistent with Keynes’s prediction, cash holdings are largely explained by a firm’s ability to access capital markets.
A particularly controversial measure of financial constraints was introduced by Fazzari, Hubbard, and Petersen (1988), and involves estimating the sensi-tivity of a firm’s investment to its cash flow. The idea is that, with frictionless capital markets, investments should be a function of the value of the firm’s in-vestment opportunities and independent of the firm’s financial position. How-ever, if there are financial constraints, then a firm will choose among projects. The firm is able to undertake more projects when financing is more available, in particular, when there is an increase in the firm’s cash flows. Empirically, Fazzari, Hubbard, and Petersen (1988) and many others document a robust relation between a firm’s cash flows and its investments. These authors inter-pret their findings as consistent with financing constraints being an important factor in determining corporate investments.19
An alternative approach to measuring financing constraints suggested by Almeida, Campello, and Weisbach (2004) involves estimating a firm’s propen-sity to save cash from incremental cash flows. In the Almeida, Campello, and Weisbach model, unconstrained firms invest at the first-best level, so incremen-tal cash flows do not have any real effects on the firm’s investments. However, a firm facing financial constraints will choose to allocate additional cash flows to increase its investments both today and in the future, so cash holdings to finance future incremental investment should increase with the firm’s cash flows. Consequently, the fraction of cash retained by a firm from incremental cash flows reflects management’s view as to whether the firm is likely to face fi-nancial constraints in the future. While the cash flow sensitivity of investment measures the effect of constraints on today’sinvestment, the cash flow sensi-tivity of cash reflects management’s assessment offutureconstraints. Almeida, Campello, and Weisbach find empirical evidence suggesting that the cash flow
19Fazzari, Hubbard, and Petersen (1988) have spawned a huge literature, both debating their
300 The Journal of FinanceR
sensitivity of cash is strongly related to other measures of financial constraints in a sample of large publicly traded U.S. firms.20
Several papers estimate loadings of financial variables on other measures of constraints to easily construct indices of constraints that can be used more broadly. In particular, Lamont, Polk, and Saa-Requejo (2001) estimate the factors that predict the firms that Kaplan and Zingales (1997) classify as constrained, leading to the “KZ index.” Whited and Wu (2006) use an Euler equation approach from a structural model of investment to create the “WW index.” Both indices are estimated using data on publicly traded U.S. firms from Compustat.
However, even for publicly traded U.S. firms, Hadlock and Pierce (2010) find that both the KZ and the WW indices are dominated by a simple index of firm age and size. Therefore, according to the Hadlock-Pierce index, all target firms would by definition become less constrained after being acquired. We later explore the effect of size on the significance of our results through subsample analysis based on targets’ size. Other measures of constraints that have been discussed in the literature, such as the existence of a bond rating and membership in a Keiretsu (Hoshi, Kashyap, and Scharfstein (1991)), are obviously not relevant for small private European companies. Unfortunately, Amadeus does not contain data on dividends, so we cannot use a measure of constraints based on dividend payouts.
Consequently, given that firms in our sample are substantially smaller than Compustat firms and are mostly privately held, we do not use measures of financial constraints that can be calculated for relatively larger and/or public firms only. The measures we use, namely, the level of cash (normalized by a firm’s assets), the sensitivity of investment to cash flow, and the sensitivity of cash to cash flow, are each motivated by theory that is equally valid in all coun-tries and for both public and private firms. Our goal is not to take a stand on which measure of financial constraints is the most accurate. Rather, our hope is that, by using three different measures, we can estimate whether acquisitions appear to reduce financial constraints in target firms, as well as the extent to which the effect is robust across alternative measures.
II. Estimates of Acquisitions’ Impact on Targets’ Financial Constraints
A. The Cash Holdings of Target Firms
We estimate multivariate models predicting aspects of firms’ financial poli-cies that are likely to be associated with financial constraints. We evaluate whether these policies change when the firm is acquired, controlling for other potentially relevant factors. The first such policy we consider is the level of
20Other authors have also used the cash flow sensitivity of cash and found that it is related to
Do Acquisitions Relieve Target Firms’ Financial Constraints? 301
cash holdings. If the precautionary demand for holding cash decreases when financial constraints are eased by an acquisition, then we should observe that, holding other factors constant, firms’ cash holdings decline after they are ac-quired. To test this hypothesis, we estimate equations predicting the quantity of cash, normalized by the firm’s total assets.
In particular, we estimate the following specification:
Cash/Assets=a+b AFTER+c Controls+e, (1)
where AFTER is a binary variable that takes a value of one after the ac-quisition. In all equations, we exclude the firm-year observations in the deal completion year. We include fixed effects for the target firm to control for time-invariant firm characteristics omitted in regressions. All specifications also include year dummies to control for changing macroeconomic conditions. In addition, we add three target country-level variables, namely, total private credit to GDP (gross domestic product), stock market capitalization to GDP, and nominal GDP growth in local currencies, to control for variation in ex-ternal financing availability. Finally, we also include firm-level controls that vary across specifications. We estimate this equation on the entire panel of firm-years for which we have data both before and after the acquisition.
We present estimates of this equation in the first four columns of TableIII. In column (1), we include only total assets and total assets squared as firm-level variables, since some firm-level variables are missing for some countries be-cause of differences in reporting requirements. In column (2), we add the firm’s cash flow to total assets as a control, dropping Dutch firms from the analysis since firms from the Netherlands do not have cash flow data in Amadeus.21
Column (3) includes ROA but not cash flow since these variables are highly correlated, which, because of data availability, allows us to include Dutch but not Russian firms. In column (4), we add the number of employees, leverage, and sales growth, which potentially could be related to the firm’s growth oppor-tunities. In this final specification, the number of firms declines substantially because data on some items are missing for firms from Denmark, Ireland, the Netherlands, Russia, and the United Kingdom. In all estimations, standard errors are corrected for clustering of observations at the firm level.
The estimates in the cash equations in the first panel of Table IIIare con-sistent with the view that target firms reduce their cash holdings after being acquired. The coefficient on the dummy variable indicating that a firm-year is after the acquisition is between−0.0135 and−0.0173, implying a drop of be-tween 1.35% and 1.73% in the cash-to-asset ratio following the acquisitions. In all specifications, this decline is statistically significantly different from zero. Cash-to-asset has a mean of 12.2% and a median of 6.4% before the acquisition. Relative to the sample mean, the regression coefficients imply that, following
21Depreciation, which is one of the components of cash flow, is missing for all Russian firms in
302
The
Journal
of
Finance
R
Table III
The Effect of Acquisitions on Cash Holdings of Target and Acquirer Firms
This table presents estimates of equations predicting cash holdings normalized by total assets, for target firms in columns (1) through (4) and acquirer firms in columns (5) through (8).AFTERis a dummy variable that equals one (zero) for the years after (before) an acquisition. The estimates are based on unconsolidated data for the targets and consolidated data for the acquirers. Definitions and sources of the other variables are provided in the Appendix. Firm and year fixed effects are included in all equations. Standard errors are corrected for clustering of observations at the target-firm level and associated standard errors are in parentheses. The symbols ***, **, and * denote statistical significance at the 1%, 5%, and 10% levels, respectively.
(1) (2) (3) (4) (5) (6) (7) (8)
Panel A: Target Panel B: Acquirer
AFTER −0.0173*** −0.0139*** −0.0135*** −0.0145*** −0.0164*** −0.0136*** −0.0140*** −0.0077
(0.003) (0.003) (0.003) (0.005) (0.004) (0.004) (0.004) (0.006)
Ln(Total Assets) 0.0304 0.0160 0.0151 0.0514 −0.0155 −0.0270 −0.0318 0.0495
(0.022) (0.023) (0.027) (0.039) (0.023) (0.025) (0.024) (0.044)
Ln(Total Assets)2 −0.0012* −0.0008 −0.0008 −0.0016 −0.0000 0.0002 0.0004 −0.0012
(0.001) (0.001) (0.001) (0.001) (0.001) (0.001) (0.001) (0.001)
Cash Flow/Total Assets 0.0931*** 0.0637*** 0.0924*** 0.1120***
(0.008) (0.015) (0.026) (0.040)
ROA 0.0945*** 0.0490*
(0.008) (0.030)
Ln(Number of Employees) −0.0140*** −0.0113
(0.005) (0.008)
Sales Growth −0.0004 −0.0078
(0.003) (0.006)
Leverage −0.0892*** −0.1050***
(0.011) (0.032)
Private Credit/GDP −0.0239*** −0.0183** −0.0162* −0.0202* −0.0284** −0.0284** −0.0271** −0.0358*
(0.008) (0.009) (0.009) (0.012) (0.011) (0.013) (0.012) (0.019)
Do
Acquisitions
Relieve
T
arget
Firms’
Financial
Constraints?
303
Table III—Continued
(1) (2) (3) (4) (5) (6) (7) (8)
Panel A: Target Panel B: Acquirer
Market Cap/GDP 0.0007 0.0015 −0.0040 −0.0039 0.0161** 0.0163* 0.0148* 0.0159
(0.005) (0.005) (0.006) (0.009) (0.008) (0.009) (0.008) (0.017)
GDP Growth −0.0028 −0.0042 0.0317 0.1171 −0.0393 −0.0886 −0.0739 −0.1978
(0.015) (0.015) (0.041) (0.071) (0.075) (0.064) (0.060) (0.174)
Constant −0.0600 0.0411 0.0616 −0.1830 0.4757** 0.5435** 0.5876** −0.2503
(0.178) (0.189) (0.221) (0.329) (0.225) (0.242) (0.240) (0.454)
Observations 34,378 29,018 27,793 11,941 9,662 8,252 8,895 3,128
304 The Journal of FinanceR
an acquisition, there is about an 11% drop in cash holdings by target firms. These multivariate results confirm the pattern suggested by the univariate comparisons in Table II, that is, that cash holdings decline after a target is purchased.
One explanation for the drop in cash holdings in target firms after being acquired is that financial constraints are relieved in the target firms following the acquisition. However, an alternative explanation for this finding is that companies centralize their treasury functions, so that they effectively hold the target firm’s cash in the new parent firm. To evaluate this possibility, we reestimate the equations from panel A of TableIII using the acquirer’s cash holdings as a dependent variable, and report them in panel B of TableIII. We calculate these acquirer holdings using the 1,215 acquirers for which we have consolidated financial data, so that they reflect the cash in the entire acquiring firm.22Inconsistent with the view that cash is moved from the target to the new
parent following the acquisition, we find that cash holdings at the acquiring firm decline after the acquisition.
The reduction in the acquirer’s cash could occur because, by adding the target firm’s assets to the assets of the acquirer, the acquirer has a lower precautionary demand for holding cash. In other words, in some states of the world, the acquirer will be able to rely on the cash flows generated by the former target’s assets. Alternatively, it is possible that the acquirer’s cash could decline because some of it is used to pay for the acquisition rather than because of a change in financial policy.
To evaluate this alternative explanation, we calculate an “adjusted” measure of cash, which equals the reported cash for the acquiring firm plus the price that the acquirer paid for the target firm, for the subsample of acquisitions whose deal value is available in Zephyr. We then reestimate the equations in panel B of Table III, adjusting acquirer unconsolidated cash holdings for the acquisition itself by “adding back” the cash paid for the target firm. This approach overstates the effect of acquisitions on the acquirer’s cash, since not all deals are paid for entirely by cash. Nonetheless, the estimates, presented in the Internet Appendix, indicate that the decline in the acquirer’s cash is of a similar magnitude to that documented in panel B of Table III. The decline in the acquirer’s cash following the acquisition does not appear to be driven by the amount paid for the acquisition itself. Instead, the decline likely occurs because the target’s assets help insure the acquirer against bad states of the world. The fact that cash goes down in both targets and acquirers suggests that the decline in the quantity of cash kept by the target is not merely a transfer to the new parent.
22In a previous draft, we presented estimates of these equations using unconsolidated financial
Do Acquisitions Relieve Target Firms’ Financial Constraints? 305
B. The Cash Flow Sensitivity of Cash
Almeida, Campello, and Weisbach (2004) suggest that one could measure financial constraints through the way firms save cash from incremental cash flow. In the Almeida, Campello, and Weisbach model, constrained firms save a positive fraction of incremental cash flows as cash to finance future invest-ments; however, there is no reason for unconstrained firms to adjust their savings behavior, since their investments are already at the first-best levels. Almeida, Campello, and Weisbach (2004), as well as a number of other papers, document that estimates of the sensitivity of cash holdings to incremental cash flows are highly correlated with other measures of financial constraints. Therefore, the changein the cash flow sensitivity of cash around the time of the acquisition should reflect changes in financial constraints occurring at that time.
To estimate the change in the cash flow sensitivity of cash at the time of the acquisition, we use a specification similar to the equations presented in Table III, with two changes. First, the dependent variable is the change in cash holdings over total assets. Second, in addition to cash flow divided by assets, we include this variable interacted with a dummy indicating whether the firm-year is after the acquisition. In this specification, the coefficient on cash flow divided by assets represents the cash flow sensitivity of assets before the acquisition, and the sum of this coefficient and the coefficient on cash flow interacted with the “AFTER” dummy variable represents the sensitivity after the acquisition.
We present estimates of this equation in columns (1) and (2) of TableIV. To evaluate whether the target firms were constrained before being acquired, we focus on the coefficients on cash flow. These coefficients are all positive and statistically significantly different from zero. In column (1), where we include country-level controls, firm-level size controls, as well as firm and year fixed effects, the coefficient on the uninteracted cash flow term (representing the preacquisition sensitivities) is 0.074. This coefficient equals 0.104 when we in-clude other controls but lose firms from Denmark, Ireland, the Netherlands, Russia, and United Kingdom from the sample in column (2). As a rough com-parison, Almeida, Campello, and Weisbach (2004) estimate similar equations on a sample of large publicly traded U.S. firms, and find statistically significant coefficients of 0.05 or 0.06 for their constrained subsamples and estimates close to zero for the unconstrained subsamples. Even though the studies use vastly different samples, our estimates for the preacquisition target firms are remark-ably close to those for constrained firms reported by Almeida, Campello, and Weisbach. The fact that the coefficients are close between the two papers sug-gests that the tests are picking up a common phenomenon, likely the existence of financial constraints.
306 The Journal of FinanceR
Table IV
The Effect of Acquisitions on the Cash–Cash Flow and Investment–Cash Flow Sensitivities of Target Firms
This table presents estimates of equations in which the dependent variables are changes in the ratio of cash holdings to total assets in columns (1) through (2), and gross investment normalized by total assets in column (3) and (4).AFTERis a dummy variable that equals one (zero) for the years after (before) an acquisition. We also include its interaction with cash flows to examine changes in the sensitivities subsequent to the acquisitions. Definitions and sources of the other variables are provided in the Appendix. Target-firm and year fixed effects are included in all regressions. Standard errors are corrected for clustering of observations at the target-firm level and associated standard errors are in parentheses. The symbols ***, **, and * denote statistical significance at the 1%, 5%, and 10% levels, respectively.
(1) (2) (3) (4)
Dependent Variable ࢞(Cash/Total Assets) Gross Investment/Total Assets
AFTER −0.0138*** −0.0104** 0.0218*** 0.0247***
(0.003) (0.004) (0.004) (0.006)
Cash Flow/Total Assets 0.0741*** 0.1036*** 0.0818*** 0.0713**
(0.013) (0.025) (0.016) (0.028)
AFTER×Cash Flow −0.0590*** −0.0929*** −0.0436** −0.0563*
(0.017) (0.029) (0.018) (0.033)
Ln(Total Assets) −0.0277 −0.0251 0.0134 −0.0058
(0.019) (0.031) (0.037) (0.057)
Ln(Total Assets)2 0.0010* 0.0009 0.0007 0.0019
(0.001) (0.001) (0.001) (0.002)
Ln(Number of Employees) −0.0020 −0.0196***
(0.004) (0.007)
Sales Growth −0.0030 0.0310***
(0.004) (0.005)
Leverage −0.0098 0.0224*
(0.009) (0.013)
Private Credit/GDP −0.0036 0.0025 −0.0163 −0.0222
(0.007) (0.008) (0.010) (0.015)
Market Cap/GDP −0.0048 −0.0107 −0.0117 −0.0064
(0.006) (0.009) (0.008) (0.012)
GDP Growth −0.0192 0.0421 0.1330*** 0.1183
(0.021) (0.063) (0.042) (0.138)
Constant 0.2055 0.1906 −0.2733 −0.2925
(0.161) (0.269) (0.302) (0.466)
Observations 23,668 11,632 25,591 12,138
R2 0.159 0.195 0.320 0.368
before the acquisition. The sum of the coefficients on cash flow and on cash flow interacted with AFTERmeasures the existence of constraints following the acquisition. In these equations, these sums are very close to, and not sta-tistically different from, zero. These results on the cash flow sensitivity of cash suggest that target firms appear to be financially constrained prior to being acquired but essentially unconstrained after being acquired.23
23The estimates are similar if we exclude firm fixed effects or include industry and/or country
Do Acquisitions Relieve Target Firms’ Financial Constraints? 307
C. The Cash Flow Sensitivity of Investment
Starting with Fazzari, Hubbard, and Petersen (1988), a large literature es-timates the sensitivity of investment to cash flow, and uses this estimated sensitivity as a measure of financial constraints. The idea is that, if a firm is unconstrained, then a firm should undertake all value-increasing investments regardless of the firm’s financial condition. However, if the firm faces con-straints, then the projects it will undertake will be rationed, and an increase in cash flow will allow it to undertake more projects. Therefore, we should observe a relation between a firm’s investment and its cash flow if the firm is financially constrained.
To estimate the cash flow sensitivity of investment, we use the same spec-ification as for the cash flow sensitivity of cash with investment, normalized by assets, as the dependent variable. We report estimates of this equation in columns (3) and (4) of Table IV. In each specification, the coefficient on cash flow is positive and statistically significant, suggesting that, before the acquisi-tion, the targets were indeed financially constrained. However, the coefficients on cash flow interacted with the after-acquisition dummy are negative and statistically significantly different from zero, which implies that the cash flow sensitivity of investment is lower following the acquisition.24
The usual interpretation of this result, following Fazzari, Hubbard, and Petersen (1988), is that financial constraints are eased at the time of the acquisition. This interpretation is subject to the standard critique of the in-vestment/cash flow literature, namely, that cash flow is likely to be correlated with investment opportunities. Such a correlation would imply that the pos-itive sensitivity of investment to cash flow reflects investment opportunities rather than financial constraints.25Nonetheless, given that the results are in
line with those for cash levels and cash/cash flow sensitivities, we view them as additional evidence consistent with the view that acquisitions relax financing constraints.
D. The Quantity of the Target Firm’s Investments
Financial constraints effectively lead firms to apply a higher cost of capital than they would in frictionless markets. Therefore, if acquisitions ease finan-cial constraints, being acquired will lead target firms to evaluate investment opportunities using a lower cost of capital, and consequently undertake more of them. This logic that acquirers can more easily finance investments for the target than the target could independently, which is formalized in models such
24Most estimates of investment–cash flow sensitivity control for lagged values of the investment,
since investment tends to be autocorrelated. We do not include lagged investment because of the way we measure investment as the change in fixed assets plus depreciation. Therefore, including lagged investment into the equation would lead measurement error in lagged investment to be mechanically related to current investment.
25This idea was originally suggested by Poterba (1988) in his published discussion of Fazzari,
308 The Journal of FinanceR
Table V
The Effect of Acquisitions on Investments of Target Firms This table presents estimates of equations in which the dependent variables are gross invest-ment normalized by total assets. AFTERis a dummy variable that equals one (zero) for the years after (before) an acquisition. Definitions and sources of the other variables are provided in the Appendix. Target-firm and year fixed effects are included in all regressions. Standard errors are corrected for clustering of observations at the target-firm level and associated standard errors are in parentheses. The symbols ***, **, and * denote statistical significance at the 1%, 5%, and 10% levels, respectively.
(1) (2) (3) (4)
Dependent Variable Gross Investment/Total Assets
AFTER 0.0161*** 0.0184*** 0.0156*** 0.0201***
(0.004) (0.004) (0.004) (0.005)
Ln(Total Assets) 0.0187 0.0087 0.0006 −0.0140
(0.036) (0.037) (0.040) (0.056)
Ln(Total Assets)2 0.0006 0.0009 0.0012 0.0021
(0.001) (0.001) (0.001) (0.002)
Cash Flow/Total Assets 0.0587*** 0.0411**
(0.011) (0.019)
ROA 0.0218**
(0.010)
Ln(Number of Employees) −0.0203***
(0.007)
Sales Growth 0.0308***
(0.005)
Leverage 0.0232*
(0.012)
Private Credit/GDP −0.0159 −0.0166 −0.0144 −0.0214
(0.010) (0.010) (0.010) (0.015)
Market Cap/GDP −0.0092 −0.0108 −0.0032 −0.0057
(0.007) (0.008) (0.008) (0.012)
GDP Growth 0.1222*** 0.1299*** 0.2229*** 0.1141
(0.042) (0.042) (0.072) (0.139)
Constant −0.3169 −0.2272 −0.2712 −0.2155
(0.292) (0.302) (0.327) (0.463)
Observations 27,322 25,591 24,434 12,138
R2 0.315 0.319 0.330 0.367
as in Almeida, Campello, and Weisbach (2004), is often used by managers to justify acquisitions.
Do Acquisitions Relieve Target Firms’ Financial Constraints? 309
during the year before the acquisition, these estimates suggest that the acqui-sition increases the mean firm’s investment by 23% to 31% and the median firm’s by 44% to 59%.
The increase in the target’s investment following the acquisition is consistent with lower financial constraints leading to a lower cost of capital being applied to investment projects. However, it is also consistent with operational synergies improving investment opportunities. It is likely that both effects combine to explain the observed increase in investment following acquisitions.
If the increase in investment reflects reductions in constraints, as well as synergies, then the combined value of the acquirer and target should increase. The vast majority of our targets are private, so it is impossible to measure value changes for these firms. However, 36% of the acquirers are publicly traded, so we can measure the acquirer’s stock price reaction to these acquirers. For this subsample of deals with public acquirers the average abnormal stock price reaction is 1.5% for 3 days and 2.3% for 21 days around the merger announcement date, both of which are statistically significantly different from zero at the 1% level. This finding is consistent with the notion that value is created in these deals. It is also consistent with the view that acquirers can make acquisitions at a discount because of the private targets’ illiquidity or uncertainty about their valuation. (See Koeplin, Sarin, and Shapiro (2000) or Ellis et al. (2012) for more discussion of acquisitions of private companies.)
III. Within-Sample Comparisons
The estimates presented thus far suggest that acquisitions are associated with declines in cash holdings, the sensitivity of cash holdings to cash flow, and the sensitivity of investment to cash flow, as well as an increase in the quantity of investment for the acquired firms in our sample. These findings suggest that the acquisitions in our sample led to a reduction in financial constraints in the target firms. If an increase in the availability and a reduction in the cost of finance were indeed the reason for these results, we would expect that they would be strongest for acquisitions for which the reduction in financial constraints is likely to be highest. We evaluate this prediction in this section.
A. Independent Firms versus Subsidiaries of Other Firms
An important distinction concerns whether, prior to the acquisition, the tar-get firms are independent firms (71.6% of the sample) or subsidiaries of other firms (28.4%). If being acquired and becoming part of a larger organization helps to relieve financial constraints, then going from being independent to be-coming a subsidiary should relieve such constraints more than if a firm changes from being a subsidiary of one firm to a subsidiary of another.
310
The
Journal
of
Finance
R
Table VI
Subsamples of Target Firms
This table presents estimates of equations from TablesIII–Vfor subsamples based on target-firm characteristics. Panel A examines subsamples of independent targets and targets as subsidiaries of other firms. Panel B divides the sample of acquisitions into terciles based on the size of the target firm (calculated as the average assets for the last available two years). The dependent variables are cash holdings normalized by total assets in columns (1) and (5), changes in cash holdings in columns (2) and (6), and gross investment normalized by total assets in columns (3), (4), (7), and (8). The regression specifications follow column (2) in TableIII, columns (1) and (3) in TableIV, and column (2) in TableV. The coefficients on the size variables and two country-level variables are not reported to save space.AFTERis a dummy variable that equals one (zero) for the years after (before) an acquisition. We also include the interaction ofAFTERwith cash flows to examine the changes in the sensitivities following the acquisitions. Definitions and sources of the other variables are provided in the Appendix. Target-firm and year fixed effects are included in all regressions. Standard errors are corrected for clustering of observations at the target-firm level and associated standard errors are in parentheses. The symbols ***, **, and * denote statistical significance at the 1%, 5%, and 10% levels, respectively.
Panel A: Independent vs. Subsidiary
(1) (2) (3) (4) (5) (6) (7) (8)
Independent Subsidiary
Dependent Variable Cash/Asset ࢞(Cash/Asset) Inv/Asset Inv/Asset Cash/Asset ࢞(Cash/Asset) Inv/Asset Inv/Asset
AFTER −0.0183*** −0.0135*** 0.0215*** 0.0170*** −0.0030 −0.0129** 0.0227*** 0.0212***
(0.004) (0.004) (0.005) (0.004) (0.006) (0.005) (0.007) (0.007)
Cash Flow/Total Assets 0.0995*** 0.0903*** 0.0899*** 0.0609*** 0.0761*** 0.0417** 0.0609** 0.0488**
(0.010) (0.018) (0.019) (0.013) (0.013) (0.016) (0.029) (0.021)
AFTER×Cash Flow −0.0822*** −0.0520** −0.0092 −0.0251
(0.021) (0.022) (0.028) (0.034)
Constant −0.0587 0.2649 −0.0361 0.0244 0.1505 −0.1216 −1.3396*** −1.3195***
(0.208) (0.198) (0.383) (0.382) (0.413) (0.308) (0.500) (0.500)
Observations 20,569 16,777 18,129 18,129 8,449 6,891 7,462 7,462
R2 0.634 0.167 0.331 0.330 0.608 0.143 0.299 0.299
Do
Acquisitions
Relieve
T
arget
Firms’
Financial
Constraints?
311
Table VI—Continued
Panel B: Target Size
(1) (2) (3) (4) (5) (6) (7) (8)
Small (Bottom 1/3) Large (Top 1/3)
Dependent Variable Cash/Asset ࢞(Cash/Asset) Inv/Asset Inv/Asset Cash/Asset ࢞(Cash/Asset) Inv/Asset Inv/Asset
AFTER −0.0242*** −0.0207*** 0.0274*** 0.0204*** −0.0032 −0.0080** 0.0151** 0.0145**
(0.007) (0.007) (0.008) (0.007) (0.005) (0.004) (0.007) (0.006)
Cash Flow/Total Assets 0.1199*** 0.1177*** 0.0905*** 0.0462** 0.0555*** 0.0245 0.0816*** 0.0767***
(0.015) (0.028) (0.027) (0.019) (0.012) (0.016) (0.031) (0.022)
AFTER×Cash Flow −0.0729** −0.0777** −0.0340 −0.0098
(0.032) (0.031) (0.025) (0.034)
Constant −0.5883 0.7212 −2.1973** −2.0904** 0.5494** −0.0537 0.1910 0.1915
(1.077) (0.960) (1.076) (1.065) (0.276) (0.230) (0.580) (0.581)
Observations 8,059 6,422 7,156 7,156 10,813 8,921 9,450 9,450
312 The Journal of FinanceR
cash, the cash flow sensitivity of investment, and the quantity of investments. The specifications follow column (2) in TableIII, columns (1) and (3) in TableIV, and column (2) in TableV, not reporting the coefficients on the size variables and two country-level controls to save space.
The results indicate that, for independent targets, there is a statistically significant 1.8% decline in the quantity of cash, an 8.2% decline in the cash flow sensitivity of cash, and a 5.2% decline in the cash flow sensitivity of investment following the acquisition. However, the corresponding estimated changes are not statistically significant for targets that are subsidiaries. We can reject the cross-equation restriction that the declines are equal for acquisitions of independent firms and subsidiaries in cash holdings and cash flow sensitivity of cash, but not in the cash flow sensitivity of investment. These estimates suggest that the declines in the measures of constraints are largest in acquisitions of independent firms, consistent with the view that they reflect reductions in financing constraints, not some other factor.26
The one variable for which the effect of an acquisition is similar regardless of the target firm’s status is the quantity of investments. The estimates in TableVI indicate that the quantity of investments increases by about the same amount for both types of targets (1.7% for independent targets, 2.1% for subsidiary targets). These positive effects likely occur because the increase in investments following an acquisition contains some operational synergies that are present, regardless of whether the target was independent or a subsidiary prior to being acquired. In general, it is difficult to ascribe the cause of investment increases to a particular reason, and it is likely that the investment increases we observe for all types of targets could come from multiple sources.
B. Target Firm Size
Hadlock and Pierce (2010) present evidence suggesting that, to a first approx-imation, a firm’s size is a reasonable proxy for the likelihood it faces financial constraints. Assuming that small firms are more likely to be constrained in our sample as well, we expect to observe more reductions in constraints for smaller targets. To test this hypothesis, we reestimate our main equations from earlier tables on subsamples based on the size of the target, as measured by the average total assets in U.S. dollars over the two years immediately prior to the acquisition.
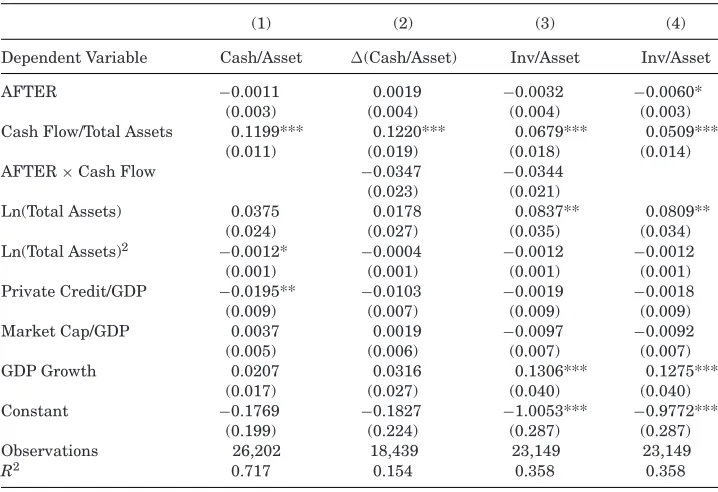
In panel B of TableVI, we divide the sample acquisitions into terciles based on the size of the target firm and reestimate our equations for the bottom and top terciles. We report one equation for cash holdings, the cash flow sensitivity of cash, the cash flow sensitivity of investment, and the quantity of investment using the same specifications as in panel A. The results suggest that the reduc-tion in cash holdings is statistically significant only for the subsample of the
26One puzzling finding in TableVI is that the sensitivities of cash and investment to cash
Do Acquisitions Relieve Target Firms’ Financial Constraints? 313
smaller targets, with an estimated reduction in cash-to-asset ratio of 0.242%. In addition, the cash flow sensitivities of both investment and cash are larger in magnitude and statistically significantly different from zero for the smaller target subsample but not the larger target one. We test the cross-equation re-striction that the declines in cash levels and both sensitivities are larger for the smaller targets. The results indicate that the declines in cash holdings are significantly larger for the smallest tercile than for the largest one. However, the tests reject the hypotheses that the declines in sensitivities are statistically significantly different between these subsamples. Finally, the investment-to-asset ratio increases significantly both for the smaller and the larger targets following the acquisitions, suggesting that acquisitions of both sets of targets are associated with synergies.
These results emphasize that the reduction in financial constraints is more likely to be mitigated for smaller targets when they are acquired. The smallest tercile of our sample, for which the reduction in constraints is most prevalent, has a median asset value of only $2.6 million. Reductions in financial con-straints upon acquisition appear to occur mostly in very small private targets rather than in the more commonly studied larger public targets.
IV. Acquirer Constraints and Cross-Subsidization
We have documented that financial constraints in target firms, measured using these firms’ own financial management policies, appear to decline after they are acquired. Financial constraints could decline for two reasons. First, being part of a larger organization could improve the ability of target firms to raise capital, either because it lowers the underlying friction causing the constraints or because the acquirers’ other assets combined with those of the targets lower the risk to a potential lender. Second, there could be transfers within combined firms that effectively lower the constraints faced by target firms after the acquisition. In this section, we study this second explanation.
If there are transfers, there are two possibilities. First, postacquisition firms could be unconstrained, meaning that, because of the existence of internal cap-ital markets, they can invest at the first-best level. Second, the postacquisition firms could be constrained and there could be transfers of funds across units that are value increasing (or possibly decreasing) as characterized in Stein (1997) (or Scharfstein and Stein (2000)).
314 The Journal of FinanceR
provides an explanation for the reduction in constraints we observe in our tar-get firms, we test two of the model’s implications: first, whether the combined firm is in fact constrained, and second, whether there are transfers across units within the firm.
A. Measuring Acquiring Firm Constraints
To measure the extent to which acquirers face financial constraints, we esti-mate cash-cash flow and investment-cash flow sensitivities for the acquirers in our sample, both before and after the acquisition. We estimate these equations using a subsample of 1,647 deals by 1,241 acquirers for which consolidated financial data are available, covering all subsidiaries including the target firm following the acquisition.27Results in this section should be interpreted with
the caveat that about 70% of the acquisitions in our main sample are not in-cluded in these tests due to the limited data availability for the acquirers. We report estimates of the cash-cash flow and investment-cash flow sensitivities for these acquirers in TableVII.
The coefficients for the cash-cash flow and investment-cash flow sensitivities in TableVIIare all positive, which suggests that the acquirers are financially constrained prior to the acquisitions. However, when we control for the number of employees, sales growth, and leverage in columns (2) and (4), the coefficients become statistically insignificantly different from zero. After acquisitions, the estimates in column (1) indicate that there is a decline in the cash-cash flow sensitivity by about half, which is difficult to interpret because neither the decline nor the postacquisition sensitivity (0.0864 – 0.0482=0.0382) is signif-icantly different from zero. The investment-cash flow sensitivity increases by a small amount following acquisitions (column (3)) but this increase is not sta-tistically significant. The postacquisition sensitivity of investment to cash flow is positive and statistically significant in the specification presented in column (3). However, neither sensitivity is statistically significantly different from zero when we control for the number of employees, sales growth, and leverage in columns (2) and (4). Overall, these results provide fairly weak evidence sug-gesting that acquirers are constrained before acquisitions, and it is difficult to draw inferences about whether acquirers are constrained following them.
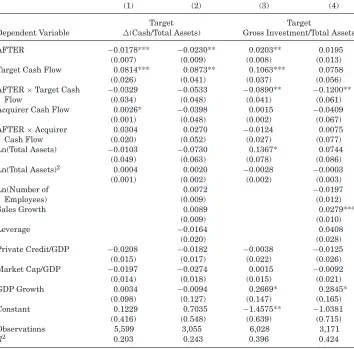
B. Postacquisition Cross-Subsidization
To test the hypothesis that transfers across subsidiaries of the new parent are the source of the reduction in financial constraints, we estimate equations similar to those reported in Shin and Stulz (1998). The idea is that, if there is cross-subsidization, the cash flows of one part of the firm are, to some extent, transferred to fund investments in other parts of the firm. Empirically, this argument suggests that cash flows in the rest of the combined firm should
27The results are similar if we use unconsolidated financial data on acquirers that do not reflect
Do Acquisitions Relieve Target Firms’ Financial Constraints? 315
Table VII
The Effect of Acquisitions on the Cash-Cash Flow and Investment-Cash Flow Sensitivities of Acquirer Firms
This table presents estimates of panel equations in which the dependent variables are changes in the ratio of the acquirer’s cash holdings to total assets in columns (1) and (2) and the acquirer’s gross investment normalized by total assets in columns (3) and (4).AFTERis a dummy variable that equals one (zero) for the years after (before) an acquisition. Definitions and sources of the other variables are provided in the Appendix. Acquirer-firm and year fixed effects are included in all regressions. Standard errors are corrected for clustering of observations at the acquirer-firm level and associated standard errors are in parentheses. The symbols ***, **, and * denote statistical significance at the 1%, 5%, and 10% levels, respectively.
(1) (2) (3) (4)
Dependent Variable ࢞(Cash/Total Assets) Gross Investment/Total Assets
AFTER 0.0041 0.0013 −0.0287** −0.0339**
(0.006) (0.007) (0.013) (0.016)
Cash Flow/Total Assets 0.0864** 0.0845 0.1232* 0.0734
(0.035) (0.056) (0.065) (0.102)
AFTER×Cash Flow −0.0482 −0.0676 0.0252 0.0312
(0.046) (0.056) (0.087) (0.111)
Ln(Total Assets) 0.0194 0.0224 0.0096 0.1550*
(0.024) (0.031) (0.087) (0.094)
Ln(Total Assets)2 −0.0006 −0.0005 0.0019 −0.0007
(0.001) (0.001) (0.002) (0.003)
Ln(Number of Employees) −0.0088* −0.0449**
(0.005) (0.017)
Sales Growth −0.0094 0.1098***
(0.007) (0.023)
Leverage 0.0033 0.0545
(0.022) (0.058)
Private Credit/GDP −0.0040 −0.0109 0.0052 0.0231
(0.012) (0.015) (0.029) (0.034)
Market Cap/GDP −0.0159 0.0000 −0.0293 −0.0521
(0.012) (0.012) (0.024) (0.032)
GDP Growth −0.1140 0.0801 0.2900 0.4159
(0.096) (0.185) (0.245) (0.505)
Constant −0.1619 −0.1746 −0.5516 −2.4146***
(0.245) (0.337) (0.848) (0.874)
Observations 5,531 3,113 5,610 3,110
R2 0.177 0.194 0.352 0.385
affect investment and changes in cash ratios in the former target. We test this idea focusing on the sensitivity to the cash flows from the target firm as well as the cash flows from the acquiring firm’s assets other than those coming from the target firm (calculated by subtracting the target’s cash flows from the acquiring firm’s postacquisition consolidated cash flows).