Uptake kinetics of
99Tc in common duckweed
Jasper Hattink *, Jeroen J.M. de Goeij, Hubert Th. Wolterbeek
Interfaculty Reactor Institute,Delft Uni6ersity of Technology,Mekelweg 15,2629 JB Delft, The Netherlands
Received 19 August 1999; received in revised form 21 December 1999; accepted 21 December 1999
Abstract
The uptake of the nuclear waste product technetium-99 was studied in common duckweed (Lemna minor). In
addition to measurements, a model involving two compartments in duckweed with different chemical forms of technetium was derived. The model was tested by chemical speciation, i.e. differentiating between reduced Tc-com-pounds and TcVIIO
4
−. The TcO
4
−concentrations measured were in good agreement with those predicted by the model.
Two processes determine technetium uptake: (1) transport of TcVIIO 4
−across the cell membrane, and (2) reduction of
TcVII. The TcO 4
− concentration in duckweed reaches a steady state within 2 h while reduced Tc-compounds are
stored, as a result of absence of release or re-oxidation processes. Bioaccumulation kinetic properties were derived by varying99Tc concentration, temperature, nutrient concentrations, and light intensity. The reduction of technetium in
duckweed was highly correlated with light intensity and temperature. At 25°C the maximum reduction rate was observed at light intensities above 200mmol m−2s−1while half of the maximum transformation rate was reached
at 41mmol m−2s−1. Transport of TcO 4
−over the cell membrane requires about 9.4 kJ mol−1, indicating an active
transport mechanism. However, this mechanism behaved as first-order kinetics instead of Michaelis – Menten kinetics between 1×10⁻¹⁴ and 2.5×10⁻⁵ mol l−1 TcO
4
−. Tc uptake could not be inhibited by 10−3 mol l−1 nitrate,
phosphate, sulphate or chloride. © 2000 Elsevier Science B.V. All rights reserved.
Keywords:Bioaccumulation;Lemna; Light-dependent uptake; Radionuclides; Technetium; Uptake kinetics
www.elsevier.com/locate/envexpbot
1. Introduction
Radionuclides are released into the environ-ment from nuclear activities (both civil and mili-tary) and natural processes of ore weathering and cosmic radionuclide production (Santschi and Honeyman, 1989; Lieser, 1995). Relevant to man-made global contamination are the long-lived
ra-dionuclides, such as 14C, 137Cs, 90Sr, 99Tc, 239,240Pu, 241,243Am, and 237Np, which are partly
released as low-level radioactive waste into sur-face waters (Aarkrog, 1986; Macaskie, 1991).99Tc
is considered as one of the most mobile among these radionuclides. Low-level waste contains ap-proximately 10% 99Tc, which makes it an
abun-dant long-lived radionuclide (half-life 2.13×10⁵
years) among the fission products (Lieser, 1993). In the last decade, the West European reprocess-ing plants released about 600 TBq into the surface water (Masson et al., 1995; Leonard et al., 1997)
* Corresponding author. Tel.:+31-15-2785052; fax: + 31-15-2783506.
while the world-wide diagnostic use of the metastable 99mTc results in unknown diffuse
sources (Baptista et al., 1982; Holm, 1993). In aerobic surface waters, technetium is present as the oxyanion pertechnetate, TcO4− (Lieser, 1993).
Radioecological research of Tc has mainly fo-cused on the terrestrial environment, considering accumulation in agricultural crops and soil ad-sorption (Yoshihara, 1996). However, little is known about the biogeochemical behaviour of Tc in surface waters, where most of the Tc is dis-charged (MAFF, 1997). Measured concentration factors for aquatic macrophytes range from 102to
103 l kg−1 on a fresh weight basis (Blaylock and
Frank, 1982; Blaylock et al., 1986; MAFF, 1997; Hattink and Wolterbeek, 1999) which is one order of magnitude higher than concentration factors measured in terrestrial vegetation (Hoffman Jr, 1981; Green and Wilkins, 1995). Since aquatic plants can reach high biomass, they might signifi-cantly influence the environmental distribution of Tc. Therefore, we studied some effects of the interaction of Tc with aquatic plants in more detail.
The uptake of Tc in terrestrial higher plants can be summarised by root uptake of TcO4
−
, possible reduction of Tc in the roots, xylem transport of TcO4
− to leaves, photoreduction of Tc in
chloro-plast, followed by complexation with proteins, cysteine and glutathione (Lembrechts and Desmet, 1989; Krijger et al., 1999a,b). These com-plexes are rather persistent and not redistributed over the biomass (Dehut et al., 1989;
Vandecas-teele et al., 1989; Krijger et al., 1999a). Accumula-tion of Tc is strongly reduced in fertilised soils (Baptista et al., 1982; Echevarria et al., 1998), which is assigned to the analogy of TcO4− with
nitrate (Van Loon, 1986; Krijger, 1999). TcO4− is
the only chemical form of Tc known to be taken up by higher plants (Van Loon, 1986; Sheppard and Evenden, 1991; Sekine et al., 1993).
Aquatic plants differ in nutrient uptake since they can use both foliar and root uptake (Denny, 1987). Both pathways may be used in the Tc accumulation pathway. In sediments, Tc precipi-tates as hydroxides, oxides, and sulfides, and com-plexes with humic acids as a result of the reducing circumstances (Lieser and Bauscher, 1987; Sekine et al., 1993; Aarkrog et al., 1997). Sheppard and Evenden (1991) showed that these complexes can-not be taken up by roots of aquatic macrophytes. Foliar absorption of TcO4
− should therefore be
considered as the only entrance for Tc in aquatic plants. Furthermore, TcO4
−
can directly diffuse to the chloroplast rather than via intermediate xylem transport. This might result in a faster uptake and reduction. In this study we focus on the accumu-lation processes and kinetics only. Effects of eu-trophication and salinity, redistribution and release of accumulated Tc-forms, and growth will be elaborated in forthcoming articles.
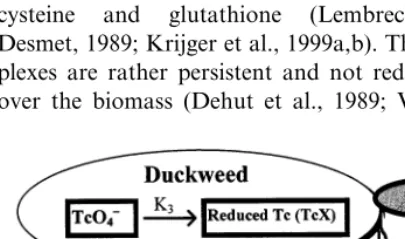
The hypothesis tested is that accumulation of Tc is dominated by two processes (1) transport across the cell membrane and (2) photo reduction of Tc in the chloroplast (Fig. 1). To describe the uptake a mathematical model was derived, which was validated by additional chemical separation of TcO4
− and reduced technetium. It was
antici-pated that the processes are regulated by enzyme kinetics, rather than passive diffusion and chemi-cal reduction. Therefore,99Tc concentration,
tem-perature, and light intensity are varied to derive kinetic properties of the underlying processes. Furthermore, uptake of Tc is studied in both presence and absence of major nutrients, to test the hypothesis of analogy with nutrients. Lem-naceae depend on their frond uptake only for nutrient requirements, and are therefore used as a model for the foliar absorption route of aquatic macrophytes. The roots of duckweed do not have a transport function as is the case for (terrestrial) plants (Landolt and Kandeler, 1987).
pdf text line Fig. 1. Schematic representation of the bioaccumulation
2. The bioaccumulation model
Fig. 1 shows the (chemical) two-compartment bioaccumulation model. Three main processes are accounted for: uptake of TcO4−, release of TcO4−,
and reduction of Tc. As a start we assume first-or-der rate processes, although this is not a priori correct, since many biological processes are regu-lated by Michaelis – Menten kinetics. By defining two phases in the uptake curve we are able to treat the uptake with (pseudo) first-order rate constants. Furthermore, dilution of the tech-netium concentration in duckweed as a result of increasing biomass (:6% growth) and decrease of the TcO4
− concentration in the medium (B
0.1%) for the duration of the experiment (5 h) are neglected. Another important point in the model is that it only accounts for chemical species; spa-tial distribution of the Tc-species (such as a distri-bution over the vacuole, cytoplasm, etc.) is not incorporated. This is discussed in more detail in Section 5. The overall rates of TcO4− transport
into duckweed and formation of reduced com-plexes respectively, are:
[TcO4−]duckweed the TcO4− concentration in
duck-weed (mol kg−1
fresh wt.), [TcX]duckweed the
con-centration of reduced Tc compounds in duckweed (mol kg−1
fresh wt), and [TcO4
−
]solution the TcO4
−
concentration in the nutrient solution (mol l−1).
More details on the derivation of these differential equations can be found in the article by Krijger et al. (1999a). Solving the Laplace transformations of Eqs. (1) and (2), and summing both equations, the total Tc concentration in duckweed [Tc]duckweed as a function of time is:
[Tc]duckweed(t)=
The first right-hand part denotes the balance between uptake and release of TcO4
−, the second
part the reduction of TcO4
− and accumulation.
The efflux and reduction (pseudo) first-order rate constants might be strongly influenced by possible Michaelis – Menten kinetics, since the TcO4
−
con-centration in duckweed rises from zero to a cer-tain steady state level. Comparing Michaelis – Menten kinetics with first-order rate processes:
) analogue of the (pseudo) first-or-der rate constants applied in Eqs. (1) – (3). This rate equation is roughly inversely proportional to the TcO4
If the TcO4− concentration is constant, the rate
equation can be treated as first-order rate con-stant, and in turn, the accumulation can be de-scribed in terms of (pseudo) first-order rate constants. Therefore, two phases in the accumula-tion curve (Eq. (3)) can be considered. The first phase represents the uptake rate at the beginning, where efflux and reduction are negligible, while the TcO4− concentration in the nutrient solution
remains practically constant:
6uptake=k1t[TcO4−]
solution (6)
The efflux and reduction might be treated as first-order, when the TcO4
−concentration in
d[TcO4−]duckweed
From here, the accumulation of [Tc]total in
duckweed follows a linear function of time:
[Tc]duckweed(t)=
Eqs. (6) and (8) were used to fit the accumula-tion curves (see Secaccumula-tion 3).
3. Material and methods
3.1. Reagents
All reagents were of p.a. quality and obtained from Sigma – Aldrich (Bornem, Belgium), Merck (Darmstadt, Germany), or Baker (Deventer, Hol-land). Demineralised or milli-Q water (Millipore, Milford, MA) was used throughout the experiments.
3.2. Duckweed culture
A strain of L. minor L. (common duckweed), which was a friendly gift of Jenner (Jenner and Janssen-Mommen, 1993) was grown in 150 ml modified Gorham solution in a climate room at 25°C and a light intensity of 120 mmol photons m−2 s−1 (Phillips PLL 83) during a 16-h light,
8-h dark period (Hughes et al., 1958; Jenner and Janssen-Mommen, 1993). Every 2 weeks, the cul-ture was replaced by fresh nutrient solution; typi-cal doubling time of duckweed under these conditions was 2.6 days.
3.3. Uptake experiments
Before starting the experiments, about 0.5 g duckweed (375 fronds) was placed on 150 ml fresh nutrient solution at the experimental settings for 4 – 6 h. After this period, the nutrient solution was spiked with 99mTc (about 21 MBq
Na99mTcO 4
−, corresponding to 4
×10−12 mol Tc;
final concentration 2.6×10⁻¹¹ mol l−1) and, if
needed, additional99Tc. For concentrations below
the 10−12 mol l−1 the Mo/Tc generator was
eluted twice a day, the last eluate contained a lower mass of 99Tc, which was calculated using
the decay formula for 99Mo and 99mTc. Uptake
experiments were carried out by sampling 0.05 – 0.15 g fresh wt duckweed from a population (40 – 65% surface covering) at subsequent time points during 5 h. Two beakers were used for one uptake curve. For an accurate determination of the influx constant k1 3 – 4 samples were taken
between 10 and 30 min. For the determination of the reduction rate, Vred, 4 – 8 samples were taken
between 1.5 – 5 h. The reduction rate is defined as (see Eq. (2) and Eq. (7)):
Vred=
k1k3
k2+k3
, (9)
Samples were spin dried for 10 min, weighed and placed in counting vials for g ray measurements. Several accumulation curves were measured by varying [TcO4−]solution, temperature, and light
intensity.
3.4. Efflux
Samples were incubated and treated as de-scribed in Section 3.3. After incubation, samples were rinsed for at least 15 min in 150 ml Tc-free nutrient solution, followed by spin drying. It was assumed that only TcO4− was released and that
the remaining Tc contained mainly TcX. This was validated in additional efflux experiments in which the Tc species were monitored (data not shown). The data obtained provided information on the build up of TcX.
3.5. Chemical speciation
Chemical speciation experiments were carried out to validate the assumption of chemical com-partments, and to check some of the calculated model parameters. Duplicate samples were pre-pared by incubating about 0.5 g fresh duckweed at the desired experimental settings. After incuba-tion, duckweed was spin dried to remove adherent
water, weighed and homogenised. Chemical spe-cies were separated as described elsewhere by high performance liquid chromatography (HPLC) on an Alltech MF-Plus (Metal-Free) HEMA-SEC BIO 1000 size-exclusion column with95mTcO
4
− as
internal standard to correct for possible artefacts. A 8.3×10⁻³ mol l−1
N-(2-hydroxylethyl)-piperazine-N%-ethanesulfonic acid (Hepes) buffer (pH 7.0) at a flow rate of 1 ml min−1was used. In
this way, two species were detected: TcO4− and
reduced Tc-compounds. A further separation of the reduced Tc-compound as described in Krijger et al. (1999a) was not carried out. For more details and retention times of the different Tc-spe-cies, see Harms et al. (1996a,b, 1999).
3.6. Competition experiments
Both in excess (10−3mol l−1) of nitrate,
phos-phate, sulphos-phate, and chloride as well as in their absence, duckweed was incubated in a solution of 2.6×10⁻¹¹ mol l−1 Tc and of 8.3×10⁻³ mol
l−1 calcium acetate solution (pH 7.0) for 1 h.
Calcium acetate was chosen to maintain equal ionic strengths in all solutions. Nitrate was sup-plied in the form of Ca(NO3)2, KNO3, or
Mg(NO3)2; phosphate as KH2PO4 or NaH2PO4;
sulphate as K2SO4, MgSO4, or Na2SO4; and
chlo-ride as CaCl2, MgCl2, or NaCl. Samples were spin
dried for 10 min, weighed and placed in counting vials forg ray measurements.
3.7. Radionuclides and detection
99Tc (b-emitter, E
max=292 keV, half-life 2.1×
105 years) was obtained from Amersham
(Buck-inghamshire, UK) as KTcO4 in 1 M NH4OH; 95mTc (g-emitter of mainly 204 keV (66%) and 835
keV (28%) half-life: 60 days) was obtained from Los Alamos National Laboratory (Los Alamos, NM) as NH4TcO4in 1 M NH4OH;
99m
Tc (g -emit-ter of 141 keV, half-life 6.0 h) was obtained from a99Mo
/99mTc generator (Malinckrodt, Petten, The
Netherlands). 99mTc and 95mTc were measured
with a Wallac (Wallay Oy, Turku, Finland) 1480 automatic 3¦gcounter, using a well type Na(Tl)I scintillator. Energy windows (99mTc 104 – 162 keV, 95mTc 163 – 240 keV) were chosen for optimal
detection and possible dual label counting, data were corrected for spill over, background and Compton radiation automatically (WALLAC, 1995).99Tc in the nutrient solution was measured
with a Packard liquid scintillation counter (LSC) in Ultima Gold™ (Packard Instruments, Gronin-gen, The Netherlands), using appropriate correc-tion for quenching. Energy windows were set on 5 – 290 keV, and the counting efficiency under these conditions was 95%.
3.8. Data analysis
The decrease of Tc concentration in the medium as a result of Tc uptake was negligible (B0.1%). Linear regression was performed in Quattro Pro for Windows version 1.0 (Borland International) using the build in linear regression function, extended with an estimation of the S.E. for the intercept. The reduction rate was obtained directly from the fitted slope from Eq. (8) to the data sampled from 1 h on, the influx from Eq. (6), using the data sampled within the first 30 min. Flux constants were calculated using Eqs. (6) and (8), or Eqs. (7) and (8) if the TcO4− concentration
in duckweed was measured. The efflux rate Vefflux, was calculated by multiplying the efflux
rate constant by the calculated or measured equi-librium level of TcO4
−, (Eq.(7)):
S.E. were calculated using the Gaussian error propagation rules.
4. Results
4.1. Test of the model
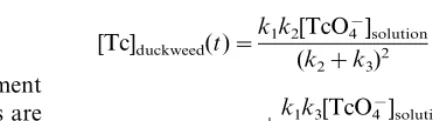
Fig. 2 shows the uptake of TcO4
−
by duckweed over 5 h; the solid curve presents the results of the two-compartmental model, which is fitted to the experimental data of accumulation of total Tc (solid squares). Clearly, two compartments can be distinguished: a fast compartment representing the TcO4−, and a ‘sink’ compartment representing
Fig. 2. Bioaccumulation of Tc at 2.6×10⁻¹¹mol l−1TcO 4
−
during a 5-h uptake period at a light intensity of 120mmol photons s−1 m−2. Solid squares () are measured total Tc concentration in duckweed (n=1), open circles () are the measured TcO4−concentration in duckweed (n=2 per point; A) or reduced Tc-compounds (B), open triangles () are the residual Tc after efflux (B), error bars represent S.D. Lines indicate fitted two-compartmental bioaccumulation model (Eq. (3)), withk1=0.18990.001 l kg−1 h−1, k2=1.8129 0.025 h−1, andk
3=0.60290.008 h−1.R2=0.964 for the fit on total Tc concentration factors.
mental values. Additional measurements of the TcO4
− concentration (open circles) and
concentra-tion of reduced Tc-forms concentraconcentra-tion in duck-weed are in good agreement with the model. These points were not used to fit the model.
4.2. Kinetics of TcO−4 accumulation
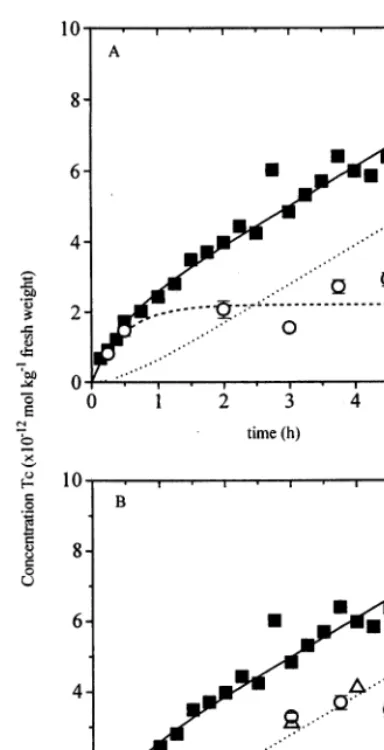
Fig. 3 shows Van’t Hoff plots for all fluxes at 10−14– 10−5mol l−1TcO
4
− concentrations in the
nutrient solution; additional measurements of influx only were carried out till 10−2.6
mol l−1
TcO4
−
. The slope of the influx graph is 1.0190.02, indicating a first-order process, with a rate constant (k1) of 0.15190.004 l kg
−1h−1. Calculated values
for the (pseudo) first-order efflux rate constant (k2)
and the reduction rate constant (k3) are 1.5890.09
and 0.6590.06 h−1, respectively. Data for efflux
and reduction above 10−5mol l−1TcO 4
−were not
collected.
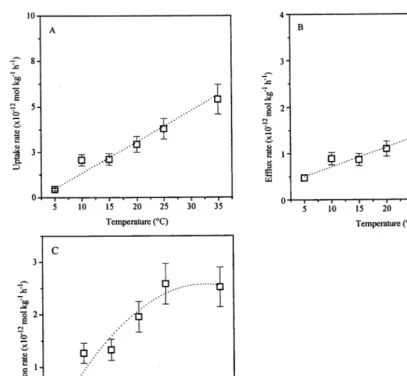
4.3. Temperature dependence
Fig. 4 shows the temperature dependency of the rate constants between 5 and 35°C. Both influx and efflux rate constants show a linear relationship with temperature and withQ10-values of about 1.5 and
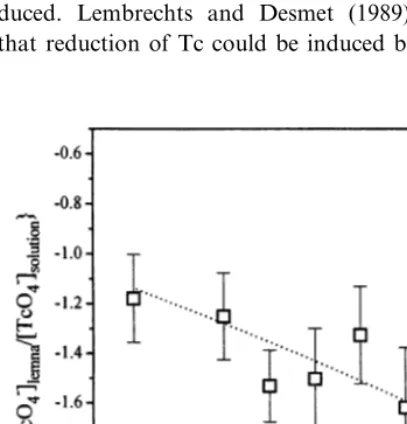
1.3, respectively (Fig. 4A,B). The reduction rate constant shows a typical parabolic dependency, characteristic for enzymatic processes. Fig. 5 gives the Arrhenius plot for the TcO4
−equilibrium
con-centration in duckweed.
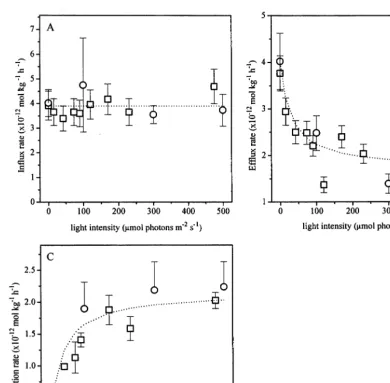
4.4. Light dependence
Fig. 6 shows the influence of light on the fluxes. Fig. 6A – C show influx, efflux and reduction rates, respectively. The influx is independent of light intensity. Both efflux and reduction rates show a correlation with light intensity. With low light intensities the efflux increases, while the reduction rate constant shows a strong positive dependency on light intensity. An empirical saturation model could be fitted to the reduction rates with a maximum transformation rate of (2.190.2)×
10−12mol kg−1fresh wt h−1, and ‘K
i’ of 40.794.3
mmol photons s−1 m−2(light intensity when half
of the maximum transformation rate is reached).
pdf text line in duckweed reaches a steady state as a result of
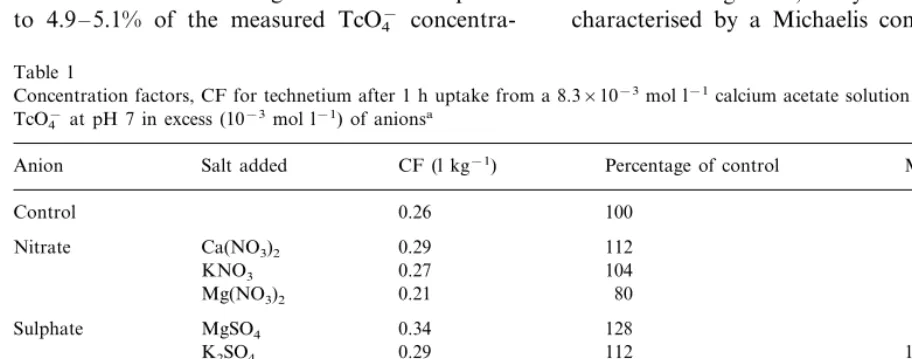
experi-4.5. Competition studies
Table 1 presents the results of the competition study. The accumulation of Tc was not inhibited
by 10−3 mol l−1 nitrate, chloride, phosphate, or
sulphate. Higher concentrations of nitrate or chlo-ride (up to 35×10−3 mol l−1) also could not
inhibit the Tc accumulation (data not shown).
Fig. 3. Van’t Hoff plots for all fluxes. Squares () are experiments carried out between 10−11and 10−5mol TcO 4
−l−1. Additional measurements of influx are carried out till 10−2.6mol TcO4−l−1(open circles []). Error bars represent propagated S.E. The TcO4−
concentration in duckweed was calculated on a fresh weight basis by
k1
k2+k3
×[TcO4−]nutrient solution
Fig. 4. Fluxes as a function of temperature at 2.6×10⁻¹¹mol l−1TcO 4
−and a light intensity of 120mmol photons s−1m−2. Data are expressed on a fresh weight basis. Error bars represent (propagated) S.E.
High calcium concentrations were applied to avoid electrostatic effects which might mask the competitive effect. Electrostatic effects were ob-served in studies without calcium acetate, and will be elaborated on in a forthcoming article.
5. Discussion
5.1. Bioaccumulation model
The degree of fit (R2=0.964) and the similarity
between the chemical speciation analysis and model indicate that the assumptions of negligible growth, (pseudo) first-order rate constants at 2.6×10⁻¹¹mol TcO
4
−l−1, and absence of
re-ox-idation or release of reduced Tc-species are valid under the given circumstances (Fig. 1). This indi-cates that accumulation models derived for terres-trial plants can be applied to aquatic plants (Van Loon et al., 1989), possibly with minor modifica-tions of exclusion of root uptake and subsequent xylem transport of TcO4− (Krijger et al., 1999a).
incorporate spatial distribution of Tc over the cell organelles. In the cell wall, positively charged groups might be present due to amino-groups. However, adsorption of TcO4
−, analogue to other
anions, at these groups is negligible.
Fig. 2 strongly supports our hypothesis that the accumulation is ruled by processes of uptake, efflux, and reduction. However, this chemical dis-tribution will not exclude a spatial disdis-tribution over the vacuole and other cell organelles. Efflux experiments with whole tomato plants by Krijger (1999) showed most TcO4
−
to be present in the vacuole. Krijger hypothesised that this TcO4−
fraction was not available for reduction. Conse-quently, the reduction rates calculated in this study may be underestimated compared to the actual reduction rates. Autoradiographic studies by Woodard-Blankenship et al. (1995) showed that Tc was accumulated in the grana of the chloroplast, probably the place where Tc is re-duced. Lembrechts and Desmet (1989) showed that reduction of Tc could be induced by light in
chloroplast suspensions. Most likely, the reduced Tc-forms are associated with the chloroplasts and thus might match the chemical distribution.
5.2. Uptake of TcO−4
The influx, which determines the magnitude of bioaccumulation, is here defined as the amount of TcO4−transported from the bulk solution into the
cytoplasm and possible cell organelles such as the vacuole. The influx thus comprises transport across the unstirred water layer, cell wall, plas-malemma, and possible cell organelle membranes, respectively. In the following discussion only the transport over the plasmalemma is considered, assuming this as the rate determine step without any correction for cell wall effects.
The minimum energy required to transport TcO4− across the cell membrane can be obtained
using the Nernst and Ussing-Teorell equations and the cell membrane potential (Nobel, 1983):
mTcO
4
−
i −m
TcO4−
o =zF(En−E
m) (11)
with mTcO
4
−
i and m
TcO4−
o the chemical potential of
TcO4− inside and outside the cell, respectively, z
the charge of TcO4−,Fthe Faraday constant, and
En and Em Nernst potential for TcO4
− and cell
membrane potential, respectively.Enis defined as:
En=RT
zF ln
[TcO4−]solution
[TcO4−]duckweed
(12)withTthe temperature andRthe gas constant. In calculations, the chemical activity is replaced by concentration, which is justified, since low concen-trations are used. It can be derived that the energy to transport TcO4− across the membrane requires
10 – 18 kJ mol−1. The associated conditions are a
cell membrane potential of between −180 and
−220 mV (characteristic for Lemnaceae; Landolt and Kandeler, 1987), a temperature of 25°C and a measured equilibrium ratio of TcO4−of the
nutri-ent solution and duckweed of 4 kg l−1
. This energy might also be derived from Fig. 5 by combining Eqs. (11) and (12) and rewriting as:
Fig. 5. Arrhenius plots for TcO4− equilibrium concentration factor in duckweed at 2.6×10⁻¹¹mol l−1TcO
4
−and a light
Fig. 6. Effect of light intensity on the transformation of TcO4−into reduced Tc-forms at a Tc nutrient solution concentration of 2.6×10⁻¹¹ mol l−1. Data are expressed on a fresh weight basis. Symbols: data (), using the influx to calculate the model parameters, () using the TcO4−equilibrium concentration to calculate the model parameters, dotted lines drawn by hand (A) or
fits using an empirical saturation model (B, C); error bars present (propagated) S.E. The reduction rate constant was light-depen-dent. Maximum reduction rate constant was calculated as 0.6790.09 h−1, half of the maximum reduction rate constant was reached at a light intensity of 71923mmol photons s−1m−2.
ln
[TcO4−]
duckweed
[TcO4−]solution
= −(mi−mo)+zFE m
R ×
1 T
(13)
The slope is estimated as 13059203 K from which an energy of 6.5 – 10.4 kJ mol−1 can be
calculated for the transport of TcO4− across the
cell membrane.
Both calculations result in energies indicating an active uptake mechanism responsible for TcO4
−
uptake, which confirms the observations that Tc uptake is inhibited if plants are treated with chem-ical inhibitors of the respiratory chain (Cataldo et al., 1983). However, the theoretical energies (10 – 18 kJ mol−1
experimentally determined ones of 6.5 – 10.4 kJ mol−1 (from Fig. 5). This difference might be
explained by a lower in situ Nernst energy (En)
than is expected from the measured equilibrium concentration of TcO4− in duckweed (compare
Eq. (1) and the slope of Eq. (13)). A lower Nernst energy can be established by inorganic complexa-tion of TcO4
− or storage of TcO
4
− in the vacuole.
Inorganic complexation of TcO4− is most likely
established by potassium, since a relatively high complexation constant (log K=0.91) is reported (Shvedov and Kotegov, 1963). In the nutrient solution (potassium concentration: 0.001 mol l−1), almost all Tc is in the TcO
4
−form. Based on
the cell membrane potential, cytosolic potassium concentrations range from 1.1 to 5.3 mol l−1.
Such high cytosolic potassium concentrations are not very likely, although these concentrations are high enough to decrease the free TcO4−
concentra-tion to such an extent as to reduce the transport energy to 0.25 and 12 kJ mol−1
, comparable with energies of 6.5 – 10.4 kJ mol−1 derived from the
Van’t Hoff plot.
From Eqs. (12) and (13), and the experimental energies from Fig. 5 TcO4
−
tion, and the remaining fraction might be stored in the vacuole. These values are comparable to pool size ratios of cytosol for TcO4− of 7 – 12%
reported by Krijger (1999) for tomato roots. These calculations suggest that pertechnetate is accumulated in the vacuole. The energy needed for TcO4
− transport across the cell membrane is
probably derived from exchanges with OH− or
co-transport with H+, and not derived from
pho-tosynthesis, since the influx rate does not change by placing duckweed in the dark (Fig. 6A) (No-bel, 1983).
In literature it is stated that the uptake of TcO4− involves a common transport process as
nitrate (Van Loon, 1986; Krijger, 1999). However, inhibition of the TcO4−uptake could not be
estab-lished by a 109
-fold excess of nitrate concentra-tion. Other anions (sulphate, phosphate, or chloride; see Table 1) also could not inhibit the Tc uptake. It is possible that Tc uptake in L. minor follows another route than competing anions or uses low-affinity carriers, characterised by high saturation values, as suggested by Krijger (1999). Some evidence may be extracted from the Van’t Hoff plot (Fig. 3A). The slope of the line equals 1, and even at 10−2.6 mol TcO
4
− l−1no deviation is
observed. In general, enzymatic reactions are characterised by a Michaelis constant of 10−2
–
Table 1
Concentration factors, CF for technetium after 1 h uptake from a 8.3×10⁻³mol l−1calcium acetate solution with 10−12mol l−1 TcO4−at pH 7 in excess (10−3mol l−1) of anionsa
Salt added CF (l kg−1)
Anion Percentage of control Mean (9S.D.)
Control 0.26 100 100
Nitrate Ca(NO3)2 0.29 112
104 Phosphate KH2PO4
NaH2PO4 0.23 89
10−5 mol l−1 (Mohr and Schopfer, 1994). Using
Michaelis constants of 10−2– 10−3 mol l−1,
Michaelis – Menten kinetics can be described theo-retically by first-order kinetics within the concen-tration range used.
5.3. Efflux of TcO−4
Fig. 3B shows that the efflux is proportional with the TcO4− concentration in duckweed over a
wide range of TcO4− concentrations (between
10−14
and 10−5
mol kg−1
). This might imply a (pseudo) first-order mechanism responsible for the efflux of TcO4
−
. The low Q10-value of 1.3 and the
linear relationship between efflux and temperature for the process till 25°C (Fig. 4B) indicates a physico-chemical rather than an enzymatic pro-cess is involved.
Fig. 6B suggests a light-dependent efflux. To understand this behaviour the definition of the efflux should be considered in more detail. The efflux is given by (see also Eq (10))
6efflux=k2[TcO4−]
duckweed (14)
Both the efflux rate constant,k2, and the TcO4−
concentration in duckweed, [TcO4−]duckweed, could
be a function of light intensity. Direct determina-tion of the TcO4
− concentration in duckweed
shows that the steady state TcO4
−concentration in
duckweed decreases with increasing light intensity (data not shown). The steady state TcO4
−
concen-tration in duckweed is a function of the influx, efflux and reduction rate constant; defined by (recalling Eq. (7)):
[TcO4−]duckweed=
k1
k2+k3
[TcO4−]solution (15)
Fig. 6A clearly shows that the influx is indepen-dent of the light intensity. To obtain decreasing TcO4−concentrations in duckweed with increasing
light intensities, the denominator, i.e. k2+k3,
should be an increasing function of the light intensity. The study of Lembrechts and Desmet (1989) suggests that the reduction process is ini-tiated by light. The reduction rate, which is the product of the reduction rate constantk3and the
TcO4− concentration in duckweed, increases with
increasing light intensities (Fig. 6C). Taking the
decreasing TcO4
− concentration in duckweed into
account, the reduction rate constant should be an increasing function of the light intensity, fphoton.
Calculated reduction rate constants show that this function can be approached by a general satura-tion model:
k3(fphoton)=
k3,maxfphoton
KL+fphoton
(16)
characterised by a maximum reduction rate con-stant k3,max of 0.6790.09 h−
1
and a KL, the light
intensity where half of the k3,max is reached, of
71923mmol photons m−2
s−1
. A more detailed discussion of the reduction is given in the follow-ing paragraph. Eqs. (13) and (14) were used to describe the efflux (dotted line, Fig. 6B). An efflux rate constant, k2, of 0.5090.03 was fitted to the
efflux data. This value is not significantly different from the average of the calculated k2-values of
0.8290.50.
5.4. Reduction of Tc
Reduction of Tc(VII) might occur in the chloroplast following reduction routes used by nitrate and sulfate suggested by Lembrechts and Desmet (1989) or at the cell membrane level sug-gested by Bonotto et al. (1984), following the transmembrane reductase routes used by redox sensitive metals such as Fe and Cu (Marschner, 1995). Fig. 2B shows that the accumulation of reduced Tc compounds increases following an S-shaped curve. This indicates that the TcO4− in
the cell controls the reduction. If the reduction should occur at the cell membrane, accumulation of reduced compounds should follow a linear curvature from the beginning of the experiment.
Fig. 6C and Fig. 4C show that reduction of Tc depends on light intensity and temperature, re-spectively. The saturation of the reduction rate is comparable to the saturation of the photosystem of Lemna, between 300 and 600 mmol m−2 s−1
shape of Fig. 4C may be explained by the correla-tion between photon flux and produccorrela-tion rate of reducing agents, such as ferrodoxine (FD) or nicotinamide adenide dinucleotide phosphate (NADHP), and associated enzymatic processes. These experiments confirm the accumulation mechanism as proposed for terrestrial higher plants, i.e. an uptake of TcO4− followed by
reduction.
Acknowledgements
This work was supported by a grant from Delft University of Technology under project no. 94-IRI-A-6. The authors wish to thank Dr A.V. Harms for his assistance and advice in the specia-tion analysis, Professor Dr W.H.O. Ernst for providing constructive comments, and the De-partment of Nuclear Medicine of the Delft Hospi-tal SSDZ for kindly providing the Mo/Tc-generator. Part of the work was already presented at the Technetium-99 symposium in Southampton (UK) in April 1998.
References
Aarkrog, A., 1986. Long-lived radionuclides important in marine waste disposal. In: IAEA (Ed.), Behaviour of long lived radionuclides associated with deep sea disposal of radioactive wastes. Report of a co-ordinated research pro-gramme organised by the International Atomic Energy Agency, 1982 – 1984. International Atomic Energy Agency, Vienna, pp. 149 – 154.
Aarkrog, A., Chen, Q., Dahlgaard, H., Nielsen, S.P., Trapeznikov, A., Pozolotina, V., 1997. Evidence of99Tc in Ural river sediments. J. Environ. Radioact. 37, 201 – 213. Baptista, I, Burgess, J., Keller, C., 1982. Gmelin Handbook of
Inorganic Chemistry. Tc — Technetium. Springer, Berlin. Blaylock, B.G., Frank, M.L., 1982. Bioaccumulation and dis-tribution of95mTc in an experimental freshwater pond. In: IAEA (Ed.), Environmental Migration of Long-Lived Ra-dionuclides. IAEA, Vienna, pp. 451 – 464.
Blaylock, B.G., Frank, M.L., Hoffman, F.O., DeAngelis, D.L., 1986. Behaviour of technetium in freshwater environ-ments. In: Desmet, G., Myttenaere, C. (Eds.), Technetium in the Environment. Elsevier Applied Science, Barking, UK, pp. 79 – 89.
Bonotto, S., Gerber, G.B., Garten, C.T.J., Vandecasteele, C.M., Myttenaere, C., Van Baelen, J., Cogneau, M., Van der Ben, D., 1984. Uptake and distribution of technetium
in several marine algae. In: Cigna, A., Myttenaere, C. (Eds.), International Symposium on the Behaviour of Long-Lived Radionuclides in the Marine Environment, La Spezia (Italy), 28 – 30 Sept. 1983. European Atomic Energy Community, Luxemburg, pp. 381 – 397.
Cataldo, D.A., Wildung, R.E., Garland, T.R., 1983. Root absorption and transport behavior of technetium in soy-bean. Plant Physiol. 73, 849 – 852.
Dehut, J.P., Fonsny, K., Myttenaere, C., Deprins, D., Vande-casteele, C.M., 1989. Bioavailability of Tc incorporated in plant material. Health Phys. 57, 263 – 268.
Denny, P., 1987. Mineral cycling by wetland plants — a review. In: Pokorny, J., Lhotsky, O., Denny, P., Turner, E.G. (Eds.), Advances in Limnology. E. Scheizerbart’sche, Stuttgart, pp. 1 – 25.
Echevarria, G., Vong, P.C., Morel, J.L., 1998. Effect of NO3+ on the fate of (TcO4−) – Tc-99 system in the soil – plant system. J. Environ. Radioact. 38, 163 – 171.
Green, N., Wilkins, B.T., 1995. Transfer of radionuclides to vegetable and other crops grown on land reclaimed from the sea. Sci. Total Environ. 173/174, 385 – 392.
Harms, A.V., Van Elteren, J.T., Claessens, H.A., 1996a. Tech-netium speciation: non-size effects in size-exclusion chro-matography. J. Chromatogr. A 755, 219 – 225.
Harms, A.V., Wolterbeek, H.T., Woroniecka, U.D., 1996b. A caveat on the use of 2-mercaptoethanol in plant tech-netium speciation procedures. Appl. Radiat. Isot. 47, 605 – 610.
Harms, A.V., Van Elteren, J.T., Wolterbeek, H.T., de Goeij, J.J.M., 1999. A dual tracer speciation technique with em-phasis on probing on artefacts: a case study for technetium and spinach (Spinacia oleraceaL.). Anal. Chim. Acta 394, 271 – 279.
Hattink, J., Wolterbeek, H.T., 1999. Determination of99Tc in natural water: bio-sensoring versus direct analysis. In: Newton, G.W.A. (Ed.), Environmental Radiochemical Analysis. Royal Society of Chemistry, Cambridge, UK, pp. 214 – 224.
Hoffman Jr, F.O., 1981. Environmental behavior of tech-netium in soil and vegetation: implications for radiological impact assessment. Ph.D. Thesis. University of Tennessee, Knoxville.
Holm, E., 1993. Radioanalytical studies of Tc in the environ-ment: progress and problems. Radiochim. Acta 63, 57 – 62. Hughes, E.O., Gorham, P.R., Zehnder, A., 1958. Toxicity of a unialgal culture ofMicrocystis aeruginosa. Can. J. Micro-biol. 4, 225 – 236.
Jenner, H.A., Janssen-Mommen, J.P.M., 1993. Duckweed
Lemna minoras a tool for testing toxicity of coal residues and polluted sediments. Arch. Environ. Contam. Toxicol. 25 (1), 3 – 11.
Krijger, G.C., 1999. Technetium in tomato plants: approaches, accumulation and metabolism. Doctorate Thesis. Delft University of Technology, Delft, The Netherlands. Krijger, G.C., Harms, A.V., Leen, R., Verburg, T.G.,
Krijger, G.C., Verburg, T.G., Den Hollander, W., Hermans, P.M.J.A., De Goeij, J.J.M., Wolterbeek, H., 1999b. Ap-proaches for nondestructive spatial distribution measure-ments in whole plants using radionuclides. J. Plant Physiol. 155, 165 – 172.
Landolt, E., Kandeler, R., 1987. Biosystematic Investigations in the Family of Duckweeds (Lemnaceae). ETH, Zurich. Lembrechts, J.F., Desmet, G., 1989. Reaction mechanisms
responsible for transformation of pertechnetate in pho-toautotrophic organisms. Health Phys. 57, 255 – 262. Leonard, K.S., McCubbin, D., Brown, J., Bonfield, R.,
Brooks, T., 1997. Distribution of technetium-99 in UK coastal waters. Mar. Pollut. Bull. 34, 628 – 636.
Lieser, K., 1993. Technetium in the nuclear fuel cycle, in medicine and in the environment. Radiochim. Acta 63, 5 – 8.
Lieser, K.H., 1995. Radionuclides in the geosphere: sources, mobility, reactions in natural waters and interaction with solids. Radiochim. Acta 70/71, 355 – 375.
Lieser, K.H., Bauscher, C., 1987. Technetium in the hydro-sphere and in the geohydro-sphere: I. Chemistry of technetium and iron in natural waters and influence of the redox potential on the sorption of technetium. Radiochim. Acta 42, 205 – 213.
Macaskie, L.E., 1991. The application of biotechnology to the treatment of wastes produced from the nuclear fuel cycle: Biodegradation and bioaccumulation as a mean of treating radionuclide-containing streams. Crit. Rev. Biotechnol. 11, 41 – 112.
MAFF, 1997. Radioactivity in food and the environment, 1996. Ministry of Agriculture, Fisheries and Food, Lon-don, UK.
Marschner, H., 1995. Mineral Nutrition of Higher Plants. Academic Press, San Diego, CA.
Masson, M., Van Weers, A.W., Groothuis, R.E.J., Dahlgaard, H., Ibbett, R.D., Leonard, K.S., 1995. Time series for sea water and seaweed of 99Tc and 125Sb originating from releases at La Hague. J. Mar. Syst. 6, 397 – 413.
Mohr, H., Schopfer, P., 1994. Plant Physiology. Springer, Berlin.
Nobel, P.S., 1983. Biophysical Plant Physiology and Ecology. W.H. Freeman, San Francisco, CA.
Santschi, P.H., Honeyman, B.D., 1989. Radionuclides in aquatic environments. Radiat. Phys. Chem. 34, 213 – 240. Sekine, T., Watanabe, A., Yoshihara, K., Kim, J.I., 1993.
Complexation of technetium with humic acid. Radiochim. Acta 63, 87 – 90.
Sheppard, S.C., Evenden, W.G., 1991. Can aquatic macrophytes mobilize technetium by oxidizing their rhizo-sphere? J. Environ. Qual. 20, 738 – 744.
Shvedov, V.P., Kotegov, K.V., 1963. Electromigration method for the determination of the physicochemical constants of compounds at extreme dilutions: II. Determination of some physicochemical constants of Tc and Re compounds. Radiokhimiya 5, 374 – 382.
Vandecasteele, C.M., Dehut, J.P., Van Laer, S., Deprins, D., Myttenaere, C., 1989. Long-term availability of Tc de-posited on soil after accidental releases. Health Phys. 57, 237.
Van Loon, L., 1986. Kinetic aspects of the soil-to-plant trans-fer of technetium. Doctorate Thesis. Catholic University Louvain, Louvain, Belgium
Van Loon, L.R., Desmet, G.M., Cremers, A., 1989. The uptake of TcO4− by plants: A mathematical description. Health Phys. 57, 309 – 314.
WALLAC, 1995. Instrument manual Wallac 1480 WIZARD 3 gamma counter, For instruments with software version 1.0 and higher; Ch. 7. Wallac Oy, Turku.
Woodard-Blankenship, W., Neel, J.W., Papin, P.J., 1995. Lo-calization and morphological effects of technetium-99 on higher plant cells. Water Air Soil Pollut. 81, 411 – 428. Yoshihara, K., 1996. Technetium in the environment. In:
Yoshihara, K., Omori, T. (Eds.), Topics in Current Chem-istry; Technetium and Rhenium. Springer, Berlin, pp. 17 – 36.