Estimation of Trees Outside Forests using IRS High Resolution data by Object Based
Image Analysis
G. S. Pujar a, *, P. M. Reddyc, C. S. Reddya, C. S. Jha a and V.K.Dadhwalb a
Forestry and Ecology Group, National Remote Sensing Centre, Hyderabad- 500 037 (pujargs, drsudhakarreddy, chandra.s.jha)@gmail.com,
b
National Remote Sensing Centre, Hyderabad- 500 037 – [email protected] c
Department of Botany, Osmania University, Hyderabad-500 009, Telangana, India – [email protected]
Commission VIII, WG VIII/7
KEY WORDS: Segmentation, Semi-automation, Forestry, Extraction, IRS, High Resolution,
ABSTRACT:
Assessment of Trees outside forests (TOF) is widely being recognized as a pivotal theme, in sustainable natural resource management, due to their role in offering variety of goods, such as timber, fruits and fodder as well as services like water, carbon, biodiversity. Forest Conservation efforts involving reduction of deforestation and degradation may have to increasingly rely on alternatives provided by TOF in catering to economic demands in forest edges. Spatial information systems involving imaging, analysis and monitoring to achieve objectives under protocols like REDD+, require incorporation of information content from areas under forest as well as trees outside forests, to aid holistic decisions. In this perspective, automation in retrieving information on area under trees, growing outside forests, using high resolution imaging is essential so that measuring and verification of extant carbon pools, are strengthened. Retrieval of this tree cover is demonstrated herewith, using object based image analysis in a forest edge of dry deciduous forests of Eastern Ghats, in Khammam district of Telangana state of India. IRS high resolution panchromatic 2.5 m data (Cartosat-1 Orthorectified) used in tandem with 5.8 m multispectral LISS IV data, discerns tree crowns and clusters at a detailed scale and hence semi-automated approach is attempted to classify TOF from a pair of image from relatively crop and cloud free season. Object based image analysis(OBIA) approach as implemented in commercial suite of e-Cognition (Ver 8.9) consists of segmentation at user defined scale followed by application of wide range of spectral, textural and object geometry based parameters for classification. Software offers innovative blend of raster and vector features that can be juxtaposed flexibly, across scales horizontally or vertically. Segmentation was carried out at multiple scales to discern first the major land covers, such as forest, water, agriculture followed by that at a finer scale, within cultivated landscape. Latter scale aimed to segregate TOF in configurations such as individual or scattered crowns, linear formations and patch TOF. As per the adopted norms in India for defining tree cover, units up to 1 ha area were considered as candidate TOF. Classification of fine scale (at 10) segments was accomplished using size, shape and texture. A customised parameter involving ratio of area of segment to its main skeleton length discerned linear formations consistently. Texture of Cartosat-1 2.5 m data was also used segregate tree cover from smoother crop patches in patch TOF category. In view of the specificity of the landscape character, continuum of cultivated area (b) and pockets of cultivation within forest (c) as well as the entire study area (a) were considered as three envelopes for evaluating the accuracy of the method. Accuracies not less than 75.1 per cent were reported in all the envelopes with a kappa accuracy of not less than 0.58. Overall accuracy of entire study area was 75.9 per cent with Kappa of 0.59 followed by 75.1 per cent ( Kappa : 0.58 ) of agricultural landscape (b). In pockets of cultivation context(c) accuracy was higher at 79.2 per cent ( Kappa : 0.64 )possibly due to smaller population. Assessment showed that 1,791 ha of 24,140 ha studied (7.42%) was under tree cover as per the definitions adopted. Strength of accuracy demonstrated obviously points to the potential of IRS high resolution data combination in setting up procedures to monitor the TOF in Indian context using OBIA approach so as to cater to the evolving demands of resource assessment and monitoring.
1. INTRODUCTION
Trees outside forests (TOF) are widely recognized to be pivotal resources, for sustainable natural resource management, due to their role in offering variety of goods, such as timber, fruits, and fodder(Arnold, 1996, Auclair et al., 2000, Boffa 2000b, Kumar and Sastry, 1999) as well as services like water, carbon(Castaneda et al, 2011) and biodiversity. Forest Conservation efforts involving reduction of deforestation and degradation may have to increasingly rely on alternatives provided by TOF (Saxena,1997, Namwata, et al, 2012) in catering to economic demands in forest edges. Spatial information systems involving imaging, analysis and monitoring to achieve objectives under protocols like REDD+, require incorporating content from areas under forest as well as trees outside forests, to aid holistic decisions. In this perspective, automation in retrieving information on area under trees, growing outside forests, using high resolution imaging is essential so that measuring and verification of extant carbon pools, are strengthened. Due to characteristic nature of high resolution images, where in conventional pixel based approaches cease to provide meaningful classification results, object based image analysis (OBIA) approach alone enables content extraction with varying degrees of automation.
OBIA as implemented in commercial suite of e-Cognition (Ver 8.9) consists of different types of segmentations at user defined scale, to derive objects that possibly match expected in situ elements. Scale refers coarsely to the level of aggregation of pixels. Segmentation is followed by potential to apply wide range of spectral, textural and object geometry based parameters for classification. Software offers innovative blend of raster and vector features that can be juxtaposed flexibly, across scales horizontally or vertically. Study was carried out with an objective of retrieving image content consisting of trees outside forests using OBIA uponhigh resolution panchromatic and multispectral sensor onboard IRS satellites. Study features as one among the earliest efforts in this category of approach.
Comparative assessment of different segmentation algorithms in high resolution multispectral datasets in terms of over-segmentation and under-over-segmentation was carried out involving
12 segmentation softwares (Marpu, 2010). Definiens report least over or under-segmentation, which is also the scale used for differentiating land covers in case of current study.
2. METHODOLOGY 2.1 Study site
Study employed an approach involving IRS high resolution panchromatic 2.5 m data (Cartosat-1 Orthorectified, acquired on 16 March 2008) used in tandem with 5.8 m multispectral LISS IV data (08 April 2008). Study was conducted in a forest edge region of dry deciduous forests of Eastern Ghats, in Khammam district of Telangana state of India. It harbours tree elements from moist and dry deciduous forests such as Madhuca indica (Mahua), Hardwickia binata, Tectona grandis, Terminaliaalata, T.chebula along with planted tree species such Tamarindus indica(Tamarind), Borassus flabellifer (Palmyra), Azadirachta indica(Neem), Terminalia arjuna, Eucalyptus. Study area was chosen in view of the prevalence of large number of trees of
various crown sizes and arrangements with sufficient contrast on high resolution images. Stock in TOF is in majority result of retention of trees from erstwhile open or degraded forest for usufructs such as fruits, beverage, fibre, fodder, medicinal value and small timber. Classification of TOF aimed to segregate trees in individual/scattered category (dominated mostly by Tamarind, Mahua), linear formations (dominantly Borassus) and patch formations (mixed species). Tree clusters covering up to 1 ha were only considered for assessment in line with currently adopted norms by Forest Survey of India in estimating tree cover (SFR,2013).
2.2 Method
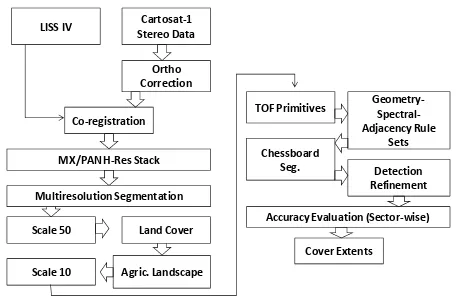
Panchromatic data was ortho-rectified using digital surface model derived from stereo pair of Cartosat-1 PAN data with relative control points. Multispectral data was rectified with reference to the panchromatic data with less than pixel error using ERDAS Imagine 9.1 suite using first order polynomial. Image analysis was carried out using Object based image processing (OBIA), where in concept of pixel is relegated at early stage of processing and group of pixels constituting a homogeneity is considered as segment (Fig 1). Whereas former procedure adopts pixel as the basic input to any rule setting, OBIA adopts segments in handling the image processing
followed by application of topological principles for defining object parameters. Key segmentation adopted in this study was multi-resolution segmentation, which may be considered as resultant algorithm of sizeable research in dealing image element fuzziness. It defines the limit for a visually perceived object at a particular scale. Scale is a very important attribute in segmentation , without which same set of pixels can form part of different segments. However, any segmentation up the scale preserves “inheritance” character completely.
2.2 Data Analysis and accuracy assessment
Different segmentation approaches are available of which selected algorithms were used. In the current study, multi-resolution segmentation at two levels were adopted, to address first segregation of land cover, followed by segregation of tree crowns in target landscapes. Both datasets were subjected to segmentation in e-Cognition 8.9 environment first at scale 50 followed by scale of 10. Segmentations used parameters of shape and compactness at 0.1 and 0.5. Parameters of shape and compactness help to regulate nature of the segments derived and act synergistically to control nature of resultant objects, hence are provided as user controlled units. Higher shape index produces very narrow and linear looking formations while lesser compactness results in to very roundish shapes.
Fig 1. Approach for delineation of TOF using OBIA
LISS IV Cartosat-1
The International Archives of the Photogrammetry, Remote Sensing and Spatial Information Sciences, Volume XL-8, 2014 ISPRS Technical Commission VIII Symposium, 09 – 12 December 2014, Hyderabad, India
This contribution has been peer-reviewed.
Coarse scale contents were generalized at first using spectral difference segmentation (with three pixel value distance in each spectral band) and then classified using shape and spectral features to delineate agriculture and non-agriculture cover categories. Classification of major land covers depended upon the overall landscape elements where in the land use trend is influenced in majority by presence of forest and related processes. Classes adopted essentially centred around forests viz., forest, burnt area, forest scrub, open scrub, and water based approach involving segment parameters using spectral properties (normalised difference vegetation index, brightness of panchromatic band) as well as geometric properties (size, rectangular fit, length-width ratio, customised ratio of length of skeleton of mainline to width) apart from grey level co-occurrence matrix for homogeneity of panchromatic data. Customised ratio in fact, is quite convenient part of this suite, wherein parameters from quite differing domains can be combined to derive best possible parameterisation. Refinement of the delineated categories was done to remove commissions from overlapping materials or geometric shapes.
Accuracy assessment was carried out for different levels of aggregation landscape units due to the specific nature of landscape in forest edge as well as special nature of image analysis adopted here, wherein objects are detected rather than the surfaces produced as in conventional per pixel methods thematic accuracy using confusion matrix and calculation of kappa coefficient. Since object based extraction aimed at delineating specific objects, overlap of desired material with very limited land covers was possible.
3. RESULTS AND DISCUSSIONS 3.1 Delineation of TOF and salient aspects
Object based Image Analysis (OBIA) of high resolution images resulted in a accuracy of 77.2 per cent in delineating trees outside forests as a cover,in relation to all other land covers studied in the area. It clearly indicated the strength of approach while using combined set of high resolution satellite imaging. TOF, being a specific and special trait not detectable in earlier resolution multispectral images (LISS III), was demonstrated for its amenability to this newer approach.
Accuracy assessment of the detection of trees outside forests using OBIA approach was carried out based on the Cartosat high resolution data as well as limited field check as the reference. Categorisation of landscape unit was adopted to understand the behaviour of the approach in cultivated areas adjacent to forest as well as the agriculture clearings prevalent within dominantly forested tract, which can have higher degree
of confusion with forest landscape in terms of image elements. The sporadic nature of individual and clustered crowns certainly tend to coalesce with forest edge in many cases and with much stronger intensity in medium resolution like LISS III data (23.5 m)
In assessing commission and omission, as entire study area envelope, delineation showed an accuracy of 75.9 percent with a Kappa coefficient of 0.59. This corresponds to its detectability amongst vegetated area of the landscape alone. Overall accuracy of TOF assessment for the agricultural
Table 1. Accuracy estimates of Different TOF categories using OBIA Approach in Bhadrachalam, AndhraPradesh/Telngana accuracy for cultivated pockets inside forests showed overall accuracy of 79.2 percent, which might be possible due to smaller quantity of detections available. Overall highest producer’s accuracy was noted for point TOF (individual trees) at 84.7 followed by that of 75 per cent for patch TOF in agricultural landscape alone context. Small samples sizes in linear and patch categories in inside forest section resulted in very high accuracies hence are excluded from illustration.
Detection of TOF configurations apparently has picked up expected geometries quite satisfactorily (Fig 1 a-f left and right columns). Across all the cases delineation of linear structure is segregated consistently. Windows chosen refer to increasing prevalence of different tree cover situations from instance a to f. While (a) has mostly individual trees, (c) is dominated by linear and (f) by patches.However, there seemed to be quite a degree of commission at some instances, due to possible under segmentation and hence dilated individual trees or lines consuming adjacent pixels as intended material. Individual trees detected met the requirement of best detection of all the contrasting entities in the brighter background (a and d). Individual trees detected might have coalesced at places to grade in to a linear formation (as in north eastern sector of (d)).
Linear tree formations seemed better represented at window (c) as well as (e). It is noteworthy to observe stream bank vegetation (in e) and bund vegetation (in c) selected as linear TOF quite clearly. Patch configurations have also been delineated consistently, but at places with some commission
error (e), possibly influenced by normalised difference vegetation index of LISS IV in an otherwise treeless situation. Influence may happen since LISS IV pixels are coarser than
Carto PAN. However, detection of relatively quite inconspicuous linear formation, in the centre of image (e) depicts the strength of OBIA, which confers to the fact that contrasting linear structures have better detectability in remote sensing imaging. Omissions also could be observed as in case of (f) tile showing undetected line formation in north east corner.
3.2 Object detection in relation to image features
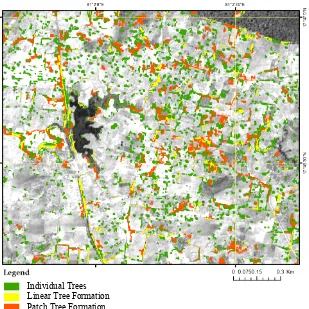
Delineation the total study area is depicted in Fig 2 which shows quite exhaustive detection of the material of trees for a landscape portion with high contrast. It may be observed that OBIA method has yielded more number of individual trees as compared to other formations in this window. Commission of linear formations as individual tree could also be observed, which may be due to issue of consideration of the size of the patch and due to hard ranges chosen for the class. Commission in to patch or linear formations can also be observed near water body as well as on some farmbunds. Patch formations show distinct detection in this window, which shows the shape based detectability on the upper side of size distribution of segments. As number of pixels within segments increases, size related classification tends to improve. As a matter of fact, for few pixel segments, detecting round segment is almost akin to high rectangular fit behaviour. Product illustrates the capability of the process for automatic detection of the TOF material from high resolution imaging.
Many geometric and spectral parameters available in the suite were of immense use in delineating TOF from segment population. In a per pixel method this is not possible unless a GIS based decision is brought in. Ease with which single crowns could be detected illustrates the first level of strength of OBIA. Ability to exclude many of the forest related cover categories, was possible in most innovative way using hierarchical decisions with greater perfection, though iterations are initially essential to set the exclusion limits. Detection of linear formation was characteristically enhanced due to application of customised ratio using main skeleton length of segment and its width. Only narrow segments, though they branched could be picked up in this manner. Refinement of the
Fig 2. Study area depicting delineated TOF material in cultivated and forest dominated pockets
Fig 1. Selected TOF delineation results using IRS H-Res Images
Instances of TOF content delineation for typical sections of the Agricultural Landscape studied using OBIA
Individual Trees Linear Tree Formation Patch Tree Formation
The International Archives of the Photogrammetry, Remote Sensing and Spatial Information Sciences, Volume XL-8, 2014 ISPRS Technical Commission VIII Symposium, 09 – 12 December 2014, Hyderabad, India
This contribution has been peer-reviewed.
segregated categories was done using chessboard segmentation Integrated consideration of the delineation (Table 2) showed that, while all detections were analysed for confirmation to TOF class, 278 entities out of 360 detected entities i.e.,77.2 were found to be accurate. Out of 151 detections of point TOF (individual tree) category, 124 were true positives. In case of linear TOF category 26 out of 31 were found to be true positives. Out of entire set of detections 64 were corresponding to Non Vegetated categories which may be due to objects having similar shape and sizes as that of trees/tree clusters , but belonging to any other contrasting elements like soil or dark rocks, not amenable for separation by NIR and red ratios at that resolution.
Table 2. Contingency matrix of the TOF classification using OBIA approach over entire study area
Contingent analysis of OBIA approach in partitioned matrices (Table 3) showed that detections corresponding to agricultural landscape and detections in exclosure pockets were 225 and 53 out of total 360. Overlap with forest category entities was found in 18 cases. In agricultural landscape 51 detections were corresponding to non vegetated material. It can also be observed that within exclosures line and patch patterns were not found and patches overlapped with points. Segregation with respect to non vegetation fraction was comparable in both sectors (51:225, 13:53) indicating that algorithms handled resolutions satisfactorily in an uniform fashion. This is a requisite advantage over per pixel classification, since in small pockets material may show large overlap in classification (trees with forest and scrub).
In view of the detections, detailed observation of contingency matrix showed that, highest producer’s accuracy was noted for point TOF (individual trees) at 84.7 followed by that of 75 per cent for patch TOF (Table 1). Linear formations showed only 48.8 per cent accuracy. Completely accurate levels noted in linear and patch TOF must have been due to very low sampling observed in those categories, hence they are of indicative significance only. Producer’s accuracy for point TOF in inside forest category was found to be 68.6 per cent. User’s accuracies for point, line and patch TOF were observed to be 78.7 , 80.8 and 66.7 per cent. User accuracy for point TOF for the category of entire study area was 50.4 per cent.
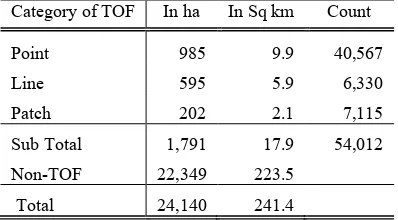
TOF detected was also analysed as tree cover since other than individual crowns, trees exist as cover only. Individual crowns were considered with minimum crown diameter. Analysis of tree cover revealed that out of the total mapped area of 241.40 sq km, TOF occupies an area of 17.91 sq km (7.42%)(Table 4). As per the analysis of TOF spread estimated, using OBIA approach, level of 7.4 per cent of entire geographic area, could be comparable with about three per cent cover in Central American landscapes of Costa Rica and Honduras (Fernandez, 2003). Individual trees constituted 9.9 sq km cover followed by
Table 4 . Category-wise Distribution of TOF in Study Area based on OBIA Approach where as patch TOF constituted 6,330 units (Table 4).
Category of
Table 3.Contingency matrix of the TOF classification using OBIA approach for different sections of landscape
Category
The International Archives of the Photogrammetry, Remote Sensing and Spatial Information Sciences, Volume XL-8, 2014 ISPRS Technical Commission VIII Symposium, 09 – 12 December 2014, Hyderabad, India
This contribution has been peer-reviewed.
Crown sizes and clustering seem to have influenced the delineation process considerably, rather than species per se, since it was observed that large Madhuca and Tamarind trees were detected as individual units followed by linear clusters of Palmyra palms. Palms occur as regular linear tree clusters on farm bunds in this area. Since most of the landscape had a history of conversion of forests in to cultivated areas, preferred trees could form distinct image elements, in the contrasting background. Preferred trees were not subject to much lopping so that fruit or flower harvests could be enhanced, hence tend to form large, clear, crowns in otherwise cultivated tract. It was also quite noticeable that not many orchards could be observed in this area, possibly due to the fact that it is a hinterland in terms of commercial agriculture. Though adjacent southern sector was a quite rich area in terms of eucalyptus plantations, this area showed very few blocks of plantations in these images.
Results of the experiment are in agreement with several findings using OBIA approach using high resolution images from satellite or aerial platform. Aerial platform especially with analog images, in principle offer, best case for applying OBIA, provided optimum illumination and angles are maintained. However abundant digital airborne images have provided insights in to how high resolution satellite imaging may respond to OBIA. Linear and individual tree formations mapped using OBIA multi-resolution segmentation approach on colored aerial images, in agricultural landscape of France over 31 sq km at 0.5 m resolution, showed 63.64 and 81.82 percent accuracies respectively (Sheeren, 2009). This fact compares strongly with results of current experiment. Current study with IRS data reported similar accuracies of 80.8 and 78.7 per cent for cultivated areas. Study also used spectral and texture based technique to derive an initial product to be used for OBIA method. In similarity to currently adopted approach, segmentation was done to generate segments corresponding to planted and non-planted classes followed by finer segmentation to achieve five classes (large wood (>4 ha), small wood (50 ares to 4 ha), copse (5-50 ares), linear (<25 m wide &>25 m length) and scattered (<5 ares clumps) (100 ares = 1 ha)). It was observed that segment based classification was highly efficient in delineating large and small wood patches since it used only area as parameter. Classification efficiency reduced while addressing linear hedge formations due to interconnectedness of entities in landscape causing complex shapes and to skew shape properties.
In another studyfor mapping and assessing riparian forests, object oriented image processing procedures were used in four different bioclimatic settings of Australia, whichinvolved terrain and vegetation traits in tandem based on different high resolution images. Various adjacency factors, local extrema and point probability contrast were involved. Vegetation fringes on a higher ground were delineated using re-segmentation and which demonstrated higher order image processing approach for fine scale natural resource assessment. However, when the size of the objects were changed due to different kind of landscapes, solutions were required to be fine-tuned for better image processing, especially when larger riparian system was being mapped (Johansen and Phinn,2009). Observations in current experiment also involved similar instance, where in rules developed for smaller window extents did not support the delineation in extended areas due to the altered radiometry causing differing contrasts as well as elimination of basic content from the image.
In a high resolution Compact Airborne Spectrographic Imager (CASI) based hyper-spectral based imaging, object based
approach was used to segregate individual forest crown clusters using spectral and spatial information using e-Cognition, with delineations matching field reality by 70%(Bunting and Lucas, 2006), which indicates potential of classifying objects given a better spectral depth.
Delineation of trees in a Pinyon-Juniper woodlands in Central Nevada was reported to be accurate at an overall level of 86% with a kappa of 0.65, using an object based image analysis approach involving multi-scale segmentation and classification scheme, based on attributes of brightness, shape, homogeneity, and texture on aerial photography images (Weisberg, 2007). Since study had focus of detecting change between two time periods (1966 and 1995) it aimed to detect only the tree and non tree categories rather than sub-categories. With a satellite derived image of 2.5 mts resolution, results obtained by the current study compare strongly with this aerial image based study of level one classification with a landscape of stronger contrasts.
Studies involving conifers, riparian zones in temperate forests, woodlands, hence compared well with this study involving dry deciduous remnant vegetation in the given forest edge landscape. Object features involved both spectral and textural traits apart from geometry feature, which were similarly employed in referred approaches as well. It was also interesting to note that results were in line with that of aerial imaging also as in case of analysis in landscape of France. Results clearly demonstrate the utility of high resolution imaging in delineating TOF towards their improved quantification.
4.CONCLUSION
In view of the comparative assessment with studies using different imaging sources involving OBIA, current results show encouraging aspects of employing IRS datasets. Current trends in greening urban and rural landscape require rapid approaches for speedy assessment. Strides made in high resolution satellite imaging as well as unmanned aerial platforms do require improved understanding of patterns of trees outside forests, for best geo-information extraction. Emphasis can be especially due to relatively less mechanised as well as sporadic planting initiatives seen in Indian context, since they generate much complex image elements.
Preference to object based method may evolve naturally in relation to per pixel approaches as demand for micro-level assessment of landscapes using high resolution images would be increasingly witnessed. Results involving a characteristic landscape chosen here, demonstrate that object based analysis can provide reliable products involving innovative and semi-automated methods in extracting information from highly detailed images of landscapes. Since manual efforts for such analysis, would at best be for validation or demonstration, semi-automation needs to be relied upon. Though OBIA seems to require highly specialised skills to arrive at operational product, characteristic bottlenecks inherent in high resolution imaging can be addressed in unprecedented manner. Advent of higher spectral and spatial resolution would increasingly require approaches such as these so that sustainable initiatives are properly planned, comprehensively implemented and monitored without bias for developing geo-information based solutions.
The International Archives of the Photogrammetry, Remote Sensing and Spatial Information Sciences, Volume XL-8, 2014 ISPRS Technical Commission VIII Symposium, 09 – 12 December 2014, Hyderabad, India
This contribution has been peer-reviewed.
REFERENCES
Arnold, J.E.M. (1996) Economic factors in farmer adoption of forest product activities.In :Leakley, R.R.B.; Melnyk, M. and Vantomme, P. (eds.) Domestication and commercialization of non-timber forest products in agroforestry systems. Proceedings of an international conference held in Nairobi, Kenya 19-23 Feb. 1996.Vol. 9, Non-Wood Forest Products FAO , Rome
Auclair, D., Prinsley, R., and Davis, S. (2000) Trees on farms in industrialised countries: silvicultural, environmental and economic issues. In: Proceedings of XXI IUFRO World Congress 7-12 August 2000, Kuala Lumpur, Malaysia, p. 776
Boffa, J-M.(2000b) Les parcsagro forestiers en Afriquesubsaharienne FAO Conservation Guide 34, FAO, Rome, 258 pp.
Bunting, P., & Lucas, R. (2006). The delineation of tree crowns in Australian mixed species forests using hyperspectral Compact Airborne Spectrographic Imager (CASI) data. Remote Sensing of Environment, 101(2), 230-248.
Castaneda,O, Chhin, S, Chomentowski, W, Jindal,R., Justice, C, Kasten, E., Loboda, T., MacFarlane, D., Samek, J., Skole, D., and Smalligan M., (2011) Guidelines for Measuring Carbon in Trees Outside Forests(Module 2) In: Carbon Benefits Project: Modelling, Measurement and Monitoring. Version 1.1 September 2011.UNEP/GEF.35 pp.
Definiens (2001) Counting trees from VHR hyperspectral data. Vol 2. No.1. e-Cognition Application notes. www.definiens-imaging.com on 2-apr-03
Foody, G. M. (2008): Harshness in image classification accuracy assessment, International Journal of Remote Sensing, 29:11, 3137-3158
Johansen, K., & Phinn, S. (2009). Mapping riparian zones over large regions from high spatial resolution satellite and airborne imagery: Specifications for operational mapping.In ISPRS Hannover Workshop 2009 on High-Resolution Earth Imaging for Geospatial Information (Vol. 38, No. 1-4-7/W5, pp. 1-6).ISPRS.
Kumar, A. and Sastry, C.B. (1999) Le réseau international de recherchesur le bambouet le rotin. . (The International Network for Bamboo and Rattan).Unasylva 0, 198: 48-53
Marpu, P. R. Neubert, M., HeroldH .& Niemeyer, I. (2010): Enhanced evaluation of image segmentation results, Journal of Spatial Science, 55:1, 55-68
Namwata, B.M.L., Masanyiwa Z.S., Mzirai O.B (2012) Productivity of the Agroforestry Systems and its Contribution to Household Income among Farmers in Lushoto District, Tanzania. International Journal of Physical and Social Sciences.2(7) ISSN: 2249-5894.
Saxena, N.C. (1997) TheWoodfuel Scenario and Policy Issues in India. RWEDP Field Document No.49.FAO. Bangkok
Sheeren, D, Bastin, N, Ouin, A, Ladet, S, Balent, G & Lacombe, J. P. (2009) Discriminating small wooded
elements in rural landscape from aerial photography: a hybrid pixel/ object-based analysis approach, International Journal of Remote Sensing, 30:19, 4979-4990
Weisberg, P.J, Lingua, E., and Pillai, R.B. (2007) Spatial Patterns of Pinyon–Juniper Woodland Expansion in Central Nevada, Rangeland Ecological Management 60:115–124.
ACKNOWLEDGEMENT
We would like acknowledge the support of National Carbon Programme ISRO-Geosphere Biosphere Programme for taking up this study. GSP also would like to profusely acknowledge support of Deputy Director, (RSA) NRSC, for all the encouragement and guidance received for this study.