Automated Burned Area Delineation Using IRS AWiFS satellite data
Jayant Singhala,T.R. Kiranchanda, G. Rajashekara and C.S.Jhaa a
Forestry and Ecology Group, National Remote Sensing Centre, Hyderabad- 500 037 (jayant_singhal, kiranchand_tr, rajashekar_g, jha_cs)@nrsc.gov.in
Commission VIII, WG VIII/7
KEY WORDS: Burnt Area, Forestry, Mapping, AWiFS, Active fire
ABSTRACT:
India is endowed with a rich forest cover. Over 21% of country’s area is covered by forest of varied composition and structure. Out of 67.5 million ha of Indian forests, about 55% of the forest cover is being subjected to fires each year, causing an economic loss of over 440 crores of rupees apart from other ecological effects. Studies carried out by Forest Survey of India reveals that on an average 53 % forest cover of the country is prone to fires and 6.17% of the forests are prone to severe fire damage. Forest Survey of India in a countrywide study in 1995 estimated that about 1.45 million hectares of forest are affected by fire annually. According to Forest Protection Division of the Ministry of Environment and Forest (GOI), 3.73 million ha of forests are affected by fire annually in India. Karnataka is one of the southern states of India extending in between latitude 110 30' and 180 25' and longitudes 740 10' and 780 35'. As per Forest Survey of India's State of Forest Report (SFR) 2009, of the total geographic area of 191791sq.km, the state harbors 38284 sq.km of recorded forest area. Major forest types occurring in the study area are tropical evergreen and semi-evergreen, tropical moist and dry deciduous forests along with tropical scrub and dry grasslands. Typical forest fire season in the study area is from February - May with a peak during March-April every year, though sporadic fire episodes occur in other parts of the year sq.km, the state harbors 38284 sq.km of recorded forest area. Major forest types occurring in the study area are tropical evergreen and semi-evergreen, tropical moist and dry deciduous forests along with tropical scrub and dry grasslands. Significant area of the deciduous forests, scrub and grasslands is prone to recurrent forest fires every year.
In this study we evaluate the feasibility of burned area mapping over a large area (Karnataka state, India) using a semi-automated detection algorithm applied to medium resolution multi spectral data from the IRS AWiFS sensor. The method is intended to be used by non-specialist users for diagnostic rapid burnt area mapping.
1. INTRODUCTION
1.1 Burnt Area Mapping
Fire is a widespread and ancient ecological factor, affecting terrestrial ecosystems. Globally, forest fires are considered to be a driver of climate change through their role in producing large amounts of trace gases and aerosol particles, which play a pivotal role in tropospheric chemistry and climate. In forests, fire is considered as one of the most important disasters because of its adverse ecological, economic and social effects. Fires strongly affect the distribution and abundance of plant species, habitats of animals and landscape properties. Fires are intentional, unintentional or natural in origin, and their intensity and spread are largely determined by the vegetation type, bioclimatic factors like temperature, rainfall and length of dry months, local topography and anthropogenic activities. Out of 67.5 million ha of Indian forests, about 55% of the forest cover is being subjected to fires each year, causing an economic loss of over 440 crores of rupees apart from other ecological effects (Gubbi, 2003). The major causes of forest fires in India are anthropogenic, which include shifting cultivation practices, controlled burning, fire wood burning and others.
Satellite remote sensing aided with Geographical Information Systems (GIS) plays a significant role in monitoring active fires, assessing burned area, predicting and integrating various spatial and non-spatial factors effecting forest fire and also in formulating effective fire mitigation measures. Long term datasets of burned area can help in the quantification of effects of global climate. Burned area maps are useful in mitigation efforts and policy making for forest managers.
We describe an IRS AWiFS satellite data based burned area assessment methodology using automated methods. Such an automated approach would find application in the rapid damage assessment of active fires or in the production of annual, national assessment of burned areas.
1.2 Aspects of Mapping of burnt areas of forests using satellite data
Burned areas are characterized by deposits of charcoal and ash, by the removal of vegetation cover and fuel, and by the exposure of underlying soil. This charcoal signature is readily evident in the optical wavelengths and has a long history of use for the assessment of burned areas. These post burn changes in reflectance vary spatially and also over time following the burn event. The spectral pattern of burned area is influenced by the type of vegetation that burns (or remains unburned), fire behaviour and completeness of burn, the post-fire regrowth of the vegetation, and the rate of charcoal and ash dissipation. In addition there are other influences.
In wide swath optical remote sensing data the reflectance values that we derive from satellite data for forested regions are known to vary with due to effects of BRDF which is a function of the illumination and viewing geometry. For MODIS data it becomes advisable not use data with a view zenith greater than 45° (Roy, 2002). Even for data till 45° techniques like BRDF inversion are needed to be applied because the change in reflectance values of forested region due to effects of BRDF can easily be more than the change between reflectance values of burnt pixels and forested pixels.
In case of deciduous forests the difference between reflectance values of forested region which have not yet shed their leaves (leaf on) and when they undergo senescence (leaf off) can be similar to that of burned areas. Forest senescence is one of the The International Archives of the Photogrammetry, Remote Sensing and Spatial Information Sciences, Volume XL-8, 2014
ISPRS Technical Commission VIII Symposium, 09 – 12 December 2014, Hyderabad, India
This contribution has been peer-reviewed.
major commission error associated with mapping of burnt areas of forests with higher resolution satellite imagery. Effects of shadows from steep terrains and clouds.
The time elapsed following the burn, influences the spectral signature of burned areas. It is most distinct immediately following the event but is known to become less distinct very rapidly. In the absence of rainfall, it can stay up to roughly four months, sometimes longer. Fire scars may be very short lived, particularly those that appear towards the end of the fire season as regeneration of vegetation following the onset of the wet season may totally eliminate the charcoal signature.
Burnt patches can have varying spatial distribution and size. Patches with sub pixel size usually go undetected. MODIS burnt area product has always been a more confident burnt area product because of the choice of spectral bands available, the temporal resolution that it provides and the corrections done to compensate for the effects of BRDF. But a lot of patches go undetected due to coarser resolution of the dataset. Also there is a need for more accurate delineation of burnt patches for a better estimate of degraded forest.
Refinement through or direct use of thermal band data can induce huge confidence and certainty in the final outcome of the delineation.
1.3
1.4 Methods adopted for burnt area mapping
A lot of techniques have been developed earlier for mapping of burnt regions of forests with higher resolution satellite data. Most of them are based on one or more than one of the following features:
1) Rule sets on spectral indices
2) Based on Machine learning techniques
3) Object based segmentation and then classification 4) MODIS assisted methods
5) Linear unmixing
Apart from LANDSAT Thematic Mapper(TM), LANDSAT Enhanced TM plus (ETM+), NOAA/ AVHRR, SPOT-VGT, DMSP-OLS, MODIS, SAR datasets have also been used for this purpose. Change from single image based techniques to Multi temporal techniques does increases the accuracy of the result a lot. Use of multi spectral data reduces commission errors due to water bodies, some shadows or permanently dark objects like roads. Although for greatest contrast comparison between green season and post fire imageries are advised, these methods are prone to commission errors due to forest Karnataka. It is one of the southern states of India. Spread over 191791 km2 area it has a forest cover of about 18.87 percent (State forest report 2009). The state is situated between latitude 11°30’ to 18°25’ N and longitude 74°’10 to 78°35’ E longitude. The state has a coastline of roughly 400km. The state has 19 different forest types in accordance to Champion and Seth’s
classification system (1968) belonging to 6 different type group viz. Tropical wet evergreen, Tropical Semi Evergreen, Tropical Moist deciduous, Tropical Dry deciduous and Tropical Thorn, Sub tropical Broadleaved Hill Forests. The annual rainfall varies from 200cm to 320cm in some regions in Western Ghats to 40cm to 50cm in some northern regions. While most of the regions of Karnataka receive most of its precipitation from advancing monsoon (June to September), some of the Southern regions of Karnataka are known to receive up to 30% of their total rainfall from retreating monsoon (October to December). The mean summer and winter temperature of the state varies from 26°C to 35°C and 14°C to 25°C respectively.
2.2 Datasets used
IRS AWiFS imagery was chosen for this study. The sensor is well suited for forest fire studies as it has the necessary spatial, spectral and temporal and analytical characteristics for mapping burned area. AWiFS is present on both ResourceSat-1(17/10/2003 to till date) and ResourceSat-2(20/04/2011 to till date) satellites. So a continuity of data is there. As the date of acquisition of the image should be close to the fire event, for better detection of burnt areas it always advisable to opt for satellite imagery which has a low revisit time. AWiFS has a revisit time of 5 days and one can get up to 3-4 revisited images of a burnt region before it fades away. It also increases the chances of getting a cloud free imagery of the area. AWiFS has a spatial resolution of 56m and works on four spectral bands. The four spectral bands are in green (0.52-0.59µm), red (0.62-0.68µm), near infra-red (0.77-0.86µm) and short wave infra-red (1.55-1.7µm) regions of the spectrum. Although indices like Normalised Burn Ratio (NBR) (Key and Benson, 1999) and Improved BAI (Martín, 2005) have been known to be used with Long SWIR (2.09-2.35µm, TM/ETM+ band7) region also (Bastarrika, 2011). Apart from that LULC maps were used to generate a forest mask.
2.3 Pre-processing and methodology
Pre-processing of the satellite data, including ortho-correction, reflectance and atmospheric corrections, fitting into an earth grid, cloud/ shadow and terrain shadow masking and water spread detection were achieved using an in-house generated suite of automated methods. For the sake of brevity a
Relatively cloud free AWiFS ortho-kit image pairs (green-season (November-December) and post fire (suitable date closest to fire event)) were selected. Orthorectification was done using LPS (Lieca Photogrametry Suite) using RPCs and 60m resolution quadrants were generated. Digital numbers were then converted to Top of the atmosphere reflectance values using an indigenously designed script. MODIS data is directly received at NRSC (Shadnagar campus) and active fire locations are generated in near real time as a part of Indian Forest Fire Response and Assessment System (INFFRAS) project.
The International Archives of the Photogrammetry, Remote Sensing and Spatial Information Sciences, Volume XL-8, 2014 ISPRS Technical Commission VIII Symposium, 09 – 12 December 2014, Hyderabad, India
This contribution has been peer-reviewed.
Figure 1. Two degree tiling scheme used for this study
A cloud and cloud shadow mask was generated for the green season and post fire images. LULC layers were used to develop a forest mask which eliminated most of the big water bodies and some other sources of commission. All the images, masks and active fire locations were then read in MATLAB. Active fire locations which were detected after the post fire image was taken were eliminated from the dataset. A 1km2 area around for each active fire location was extracted from the post fire image excluding the part that got detected in masks. Pixel with least SWIR reflectance was identified from each of these 1000m datasets. A histogram of SWIR and NIR values of these pixels were generated with bin size of 0.01 reflectance (as shown in Figure 2).
Figure 2. Histogram of least SWIR and NIR values in a 1km2 area around the active fire locations
The mode of these values was chosen to be the convergence value for burnt area index (BAIM) (Martín, 2005) for a particular tile. Where
Where ρcNIR = convergence value for NIR band ρcSWIR = convergence value for SWIR band ρNIR = reflectance in NIR band
ρSWIR = reflectance in SWIR band
NDVI and BAIM were calculated for both green season and post fire data. BAIM and NDVI difference image were also generated as a part of the process. The thresholds for BAIM difference image was selected by the user by seeing that image. The following rule set was then applied to each pixel to generate the final result:
1) The pixel should not be in cloud/cloud shadow mask and should be in forest mask.
2) The difference between NDVI green season data and post fire data should be greater than 0.3.
3) The difference in BAIM of green season and post fire data should be as specified by the user.
Although these rules can be applied to regions in vicinity of active fire detection and one can save a lot of error due to commission through it, for this study it was applied to the whole dataset belonging to that tile.
3. RESULTS AND DISCUSSION
3.1 Result
The algorithm was able to detect most of the burnt scars for the image. The outline for some of the scars was not correctly detected. Overall the algorithm gave a little overestimated result of the burnt scars. Major commission errors were due to changes in terrain shadow of the green season and post fire images. The algorithm detected significantly more than MOD45 result but with some commission error.
3.2 Comparison of result
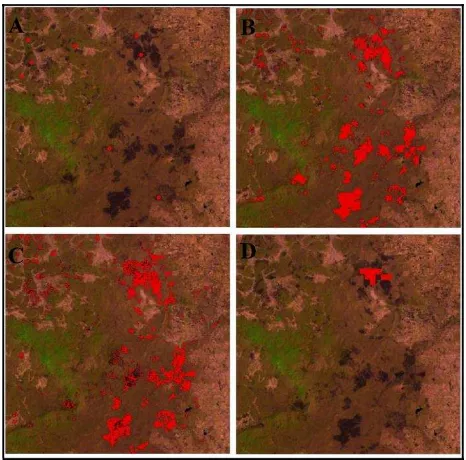
Figure 3. Comparison of result. Figure a. shows the active fire locations as received. Figure b. shows results of our method. The red area marked is the detected burnt area. Figure c. and d.
show the result from M.L. classification and MCD45 respectively
The result of algorithm was compared against a result of supervised classification (M.L. classifier) applied on the post fire image. M.L. classified image showed a total area burnt area of 266.78 km2 against 298.02 km2 shown by our result against 157.24 km2 shown by MCD45. The detection rate for all the The International Archives of the Photogrammetry, Remote Sensing and Spatial Information Sciences, Volume XL-8, 2014
ISPRS Technical Commission VIII Symposium, 09 – 12 December 2014, Hyderabad, India
This contribution has been peer-reviewed.
three methods was different (Figure 3). M.L. classified image showed an under detection of brunt scars and had lot of commission errors due to reasons discussed earlier. Our algorithm detected most of the burnt scars but the outline of some of the older scars was not detected correctly. In case of MCD45 many burnt scars were not detected even though active fire in those regions was clear detected with high confidence, possibly due to inversion of BRDF. Feasibility of this technique will be evaluated for other biomes also, with the aim to make get nationalised burned area products.
REFERENCES
Bastarrika, A., 2011. Mapping burned areas from Landsat TM/ETM+ data with a two-phase algorithm: Balancing omission and commission errors. Remote Sensing of Environment 115, pp. 1003-1012.
Chan, T.F., and Vese, A., 2001. Active contours without edges. IEEE TRANSACTIONS ON IMAGE PROCESSING, VOL. 10, NO. 2, FEBRUARY 2001
Gubbi, S., 2003. Fire, fire burning bright! Deccan Herald,
Bangalore, India. Available
from http://wildlifefirst.info/images/wordfiles/fire.doc (accessed January 2004).
Key, C.H., and Benson, N.C., 1999. Measuring and remote sensing of burn severity: The CBI and NBR. Poster abstract. Proceedings Joint fire Science Conference and Workshop, Vol.2,15-17 June 1999. University of Idaho and International Associaton of wildland and fire. ,pp-284.
Martín, M. P., Gómez, I., & Chuvieco, E.,2005. Performance of a burned-area index (BAIM) for mapping Mediterranean burned scars from MODIS data. In J. Riva, F. Pérez-Cabello, & E. Chuvieco (Eds.), Proceedings of the 5th International Workshop on Remote Sensing and GIS applications to Forest Fire Management: Fire Effects Assessment (pp. 193−198). Paris: Universidad de Zaragoza, GOFC-GOLD, EARSeL.
Roy, D.P., 2002. Burnt area mapping using multi-temporal moderate spatial resolution data- a bi-directional reflectance model-based expectation approach. Remote Sensing of Environment 83, pp. 263-286.
Roy, P.S., 2002. Forest fire and degradation assessment using satellite remote sensing and geographic information system. Satellite Remote Sensing and GIS Applications in Agricultural Meteorology, pp. 361-400.
Yang, 2014. Study of burn scar extraction automatically based on level set method using remote sensing data. PLoSONE 9(2): e87480. doi:10.1371/journal.pone.0087480.
The International Archives of the Photogrammetry, Remote Sensing and Spatial Information Sciences, Volume XL-8, 2014 ISPRS Technical Commission VIII Symposium, 09 – 12 December 2014, Hyderabad, India
This contribution has been peer-reviewed.