MULTINOMIAL LOGISTIC REGRESSION PREDICTED PROBABILITY MAP TO
VISUALIZE THE INFLUENCE OF SOCIO-ECONOMIC FACTORS ON BREAST
CANCER OCCURRENCE IN SOUTHERN KARNATAKA
Madhu B, a,*, Ashok N C b, Balasubramanian S ca andb
Department of Community Medicine, c Director Research and Dean Faculty of Life Sciences JSS University, Mysore, India. [email protected] and [email protected] [email protected]
ISPRS Technical Commission WG VIII / 2: I/4
KEY WORDS: Probability, Multinomial logistic regression, Breast Cancer, Socio-economic influence.
ABSTRACT:
Multinomial logistic regression analysis was used to develop statistical model that can predict the probability of breast cancer
in Southern Karnataka using the breast cancer occurrence data during 2007-2011. Independent socio-economic variables
describing the breast cancer occurrence like age, education, occupation, parity, type of family, health insurance coverage,
residential locality and socioeconomic status of each case was obtained. The models were developed as follows: i) Spatial
visualization of the Urban- rural distribution of breast cancer cases that were obtained from the Bharat Hospital and
Institute of Oncology. ii) Socio-economic risk factors describing the breast cancer occurrences were complied for each case.
These data were then analysed using multinomial logistic regression analysis in a SPSS statistical software and relations
between the occurrence of breast cancer across the socio-economic status and the influence of other socio-economic variables
were evaluated and multinomial logistic regression models were constructed. iii) the model that best predicted the occurrence
of breast cancer were identified. This multivariate logistic regression model has been entered into a geographic information
system and maps showing the predicted probability of breast cancer occurrence in Southern Karnataka was created. This
study demonstrates that Multinomial logistic regression is a valuable tool for developing models that predict the probability of
breast cancer Occurrence in Southern Karnataka.
* Corresponding author. This is useful to know for communication with the appropriate person in cases with more than one author.
1. INTRODUCTION
1.1 Global situation of Breast Cancer
Globally, breast cancer has been the commonest female cancer representing 23% of all cancers in women. Incidence rates show a marked geographical variation from 27.3 per 1,00,000 in less developed countries to 66,6 per 1,00,000 women in more developed countries. However, mortality rates with breast cancer are high among the low income countries and survival rates with breast cancer are better in high income countries.
1.2 Breast cancer in India
Recent National Cancer Registry Program (NCRP) reports shows that there has been a rising incidence of breast cancer in India and It is essential to understand how the disease burden is shared among women in the society from different socio-economic background and risk factors associated with breast cancer can be predicted.
* Corresponding Author : Dr Madhu B, Assistant Professor, Department of community Medicine, JSS University, Mysore: 570015. [email protected] 09480134678
1.3 Understanding risk factors of breast cancer
Like any other cancer, breast cancer can result from multiple environmental and hereditary risk factors. Epidemiological research describes the patterns of breast cancer incidence across certain population and tries to identify the environmental risk factors which are part of the physical environment, while others are primarily part of the social, cultural or economic environment.
Logistic regression analysis (Breslow NE, 1980) conceptually studies the relation to several variables and can be used to develop a model and this model when integrated with GIS can be used to generate a map showing the probability of breast cancer in Southern Karnataka.
2. METHODOLOGICAL APPROACH
2.1 Analytic frame work
Logistic regression was used to develop models to predict the probability of breast cancer occurrences in southern Karnataka. Data of 909 breast cancer cases that occurred during 2007-2011 in Mysore, Mandya, Hassan, Kodagu,
The International Archives of the Photogrammetry, Remote Sensing and Spatial Information Sciences, Volume XL-8, 2014 ISPRS Technical Commission VIII Symposium, 09 – 12 December 2014, Hyderabad, India
This contribution has been peer-reviewed.
and Chamrajnagar districts were evaluated. Independent variables associated with the occurrence of breast cancer like age, education occupation, residential location, socio-economic status, marital status, religion, parity, availability of health insurance facilities. The models were developed as follows i) Rural-urban distribution of breast cancer cases using Geographic information System. ii) Rural-Urban differences across various socio-economic status were analysed using chi-square analysis. To study the extent of influence of various factors across different socio-economic factors were added as input for analysis using multinomial logistic regression analysis. iii ) Predicted Probability mapping of results of the multinomial logistic regression analysis.
2.2 Logistic regression Analysis:
Logistic regression (Kleinbaum, 1994; Hosmer and Lemeshow, 2000; Helsel and Hirsch, 2002) is a statistical method that predicts the probability of an event occurring, in this case, the probability of occurrence of breast cancer Logistic regression is conceptually similar to multiple linear regression, because relations between one dependent variable and several independent variables are evaluated. Whereas multiple linear regression returns a continuous value for the dependent variable, logistic regression returns the probability of a positive binomial outcome (in this case, occurrence of breast cancer) in the form:
P = ex/(1+ex) (1)
where
P is the probability of breast cancer occurrence, in percent;
x is β0 + β1x1 + β2x2 + ….+ βixi ; βi is logistic regression coefficients;
xi is values for the independent variables, such as age, education, occupation, marital status, socio-economic status, parity, religion, health insurance facility
i is the number of variables.
Logistic regression calculates several statistical parameters that determine the predictive success of the model (Kleinbaum, 1994; Hosmer and Lemeshow, 2000; Garson G D, 2011). The p-values calculated for each independent variable, indicates the statistical significance that each variable has on the overall logistic regression model.
2.3 Multinomial logistic regression analysis:
The multinomial (Polytomous ) logistic regression model is an extension of the binomial logistic regression model (Schwab, J A (2002); Friedman J, 2010; ) . It is used when dependent variable has more than two nominal or unordered categories. Like binary logistic regression, multinominal logistic regression uses maximum likelihood estimation to evaluate the probability of categorical membership.
2.4 Advantages of multinomial regression analysis over other multivariate analysis:
Most multivariate analysis require the basic assumptions of normality and continuous data, involving independent and /or dependent variables as aforementioned. Tabanick et al (2001) argued that multinomial logistic regression
technique has a number of advantages as: i) it is more robust to violations of assumptions of multi-variate normality and equal variance and co-variance matrices across groups, ii) easily interpretable diagnostic statistics, iii) most importantly, MLR does not assume a linear relationship between the dependent and independent variables, iv) independent variables need not be interval, v) MLR does not require that the independents be unbounded and lastly vi) normally distributed error terms are not assumed.
With the above advantages, MLR (Vittinghoff , E 2005) is widely used a problem solving tool, particularly in the field of psychology, mathematical finance, engineering and medicine especially for risk analysis and identifying risk factors for a given condition/ event/disease. Data analysis was carried out with aid of both descriptive and inferential analysis.
3. RESULTS
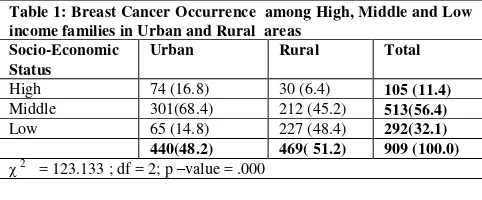
3.1Breast Cancer Occurrence among High, middle and low income families in Urban and Rural areas:
3.2 Results Of Multi-Nominal Regression
Analysis
Null Hypothesis (H0) for the MLR = There was no difference between the model without independent variables and the model with independent variables.
Alternate Hypothesis (Ha) for MLR = There is a difference between model without independent variables and model with independent variables.
Table 3.3.1 Model Fitting Information
Table 1: Breast Cancer Occurrence among High, Middle and Low income families in Urban and Rural areas
Socio-Economic
The International Archives of the Photogrammetry, Remote Sensing and Spatial Information Sciences, Volume XL-8, 2014 ISPRS Technical Commission VIII Symposium, 09 – 12 December 2014, Hyderabad, India
This contribution has been peer-reviewed.
First consideration was given to overall test relationship. Secondly, strength of MLR relationship was tested to establish strength of MLR relationship and lastly, evaluating the usefulness of logistic model and relationship between the independent and independent variables.
3.3 Overall test of relationship
First thing in MLR for any risk analysis is to describe the overall test of relationship between the dependent and independent variables. Model fitting information in table (3.3 ), describes the relationship between the dependent and independent variables and reveals that probability of the model chi-square 455.235 was 0.000, less than the level of significance of 0.05 ( i.e p < 0.05).
3.4 Urban and Rural Mapping of breast cancer in Southern Karnataka
3.5 Logit Model of breast cancer
The occurrence of breast cancer in high, middle and low income
families (there are three categories in the response variable) two
logit models are computed; one comparing Occurrence of breast
cancer in middle income families with the reference category and
one comparing occurrence of breast cancer in low income
families with the reference category (occurrence of breast cancer
in high income families). The model of occurrence of breast
cancer occurrence across socio-economic status can therefore be
represented using two (i.e., j -1) logit models (log P).
3.6 Logistic regression equation
The multinomial logistic regression equation describing
occurrence of breast cancer in middle and low income
families is presented below.
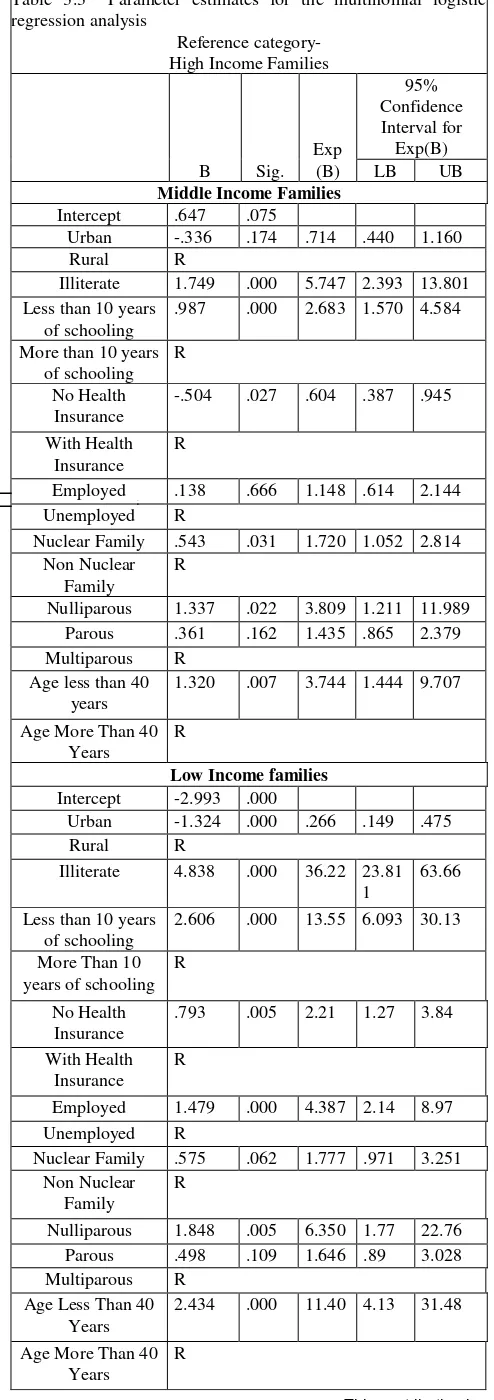
Breast cancer occurrence in middle income families =
0.647-0.336( Urban)+1.749(Illiteracy)+0.87(< 10 years of
schooling) +0.138(Employed)+1.337(Nulliparous)+ 0.361(
Parous) +1.32(Age < 40 years)
Breast cancer occurrence in low income families =
-2.933-1.324(urban)+4.838 (Illiterate )+2.606 (< 10 years of
schooling) +0.793(No health insurance)+
1.479(employed)+1.848(nulliparous)+2.43(age < 40 years)
Based on the probabilities that were saved for each case record by multinomial logistic regression was utilised and linked to base map. Geo statistical modelling like Kriging (Croner 2013; C Childs, 2004) generated maps with areas for high and low probability of breast cancer.
log Pr [Y = Breast cancer in middle class ]
Pr [Y = Breast cancer in High income families ]
= α+β1X1+β2X 2...+βkXk
log Pr [Y = Breast cancer in low income families class ]
Pr [Y = Breast cancer in High income families]
= α+β1 X1+β 2X 2...+βkX k
The International Archives of the Photogrammetry, Remote Sensing and Spatial Information Sciences, Volume XL-8, 2014 ISPRS Technical Commission VIII Symposium, 09 – 12 December 2014, Hyderabad, India
This contribution has been peer-reviewed.
4. CONCLUSIONS
Multinomial regression analysis can be used to assess the factors influencing the occurrence of breast cancer and when linked to maps that can predict areas for breast cancer.
REFERENCES
Breaslow N E and day NE (1980). Statistical methods in cancer research , Lyon , UK. International Agency for research in Cancer.
Croner C M and Cola L D. Visualization of Disease Surveillance Data with Geo statistics- UNECE by http://www.unece.org/stats/gis/pdf
C Childs. ESRI Education Services. Interpolating Surfaces in Arc GIS Spatial Analyst .(September ( 2004) pg 32-35.www.esri.com/news/interpolating.
Friedman, J; Hastie, T, Tibshirani R ( 2010). Regularization paths for generalized linear models via co=ordinate descent. Journal of Statistical software 33 (1).
Garson G D (2011) .” Logistic Regression from Stat
notes: Topics in Multivariate Analysis. http:// Faculty class. Nesu.edu /garson /pa765 /statnote.htm.
Hosmer, D.W., and S. Lemeshow, 1989. Applied Logistic Regression. Wiley series in Probability and Mathematical Statistics, John Wiley and Sons, New York, N.Y., 307 p.
Schwab , J .A (2002) . Multinomial logistic regression . Basic relationships and complete problems. http:// www. Utexas.edu./courses/Schwab/ solving problems
Vittinghoff, E., Shibosk, S.C., Glidden , D.V., and Mc Culloch, C E( 2005). Regression methods in Biostatistics: linear , logistic, survival and repeated Measures models. New York : Springer Sciences and Business Media.Inc.
Tabanick B G, Fidell L S and Osterlind S J. Using multivariate statistics.US, Allyn and Bacon Boston, 2001
The International Archives of the Photogrammetry, Remote Sensing and Spatial Information Sciences, Volume XL-8, 2014 ISPRS Technical Commission VIII Symposium, 09 – 12 December 2014, Hyderabad, India
This contribution has been peer-reviewed.