LAMPIRANA
HASIL PENGAMATAN STANDARISASI PARAMETER SPESIF1K DAN NON SPESIF1K EKSTRAK WORTEL (Daucus carota L.)
A Standarisasi parameter spesifik ekstrak wortel
Tabe1 4.22. Pemeriksaan organo1eptis ekstrak wortel
Pemeriksaan
Bentuk
Warna
Bau
Ekstrak wortel Serbuk Orange Muda Khas aromatik
Tabe1 4.23. Hasi1 pemeriksaan sifat fisik penentuan pH ekstrak wortel
Replikasi Ekstrak wortel
1 6,32
2 ~~
3 ~00
X± SD 6,11 ±0,17
Tabe14.24. Hasi1 uji kadar sari 1arut air ekstrak wortel Replikasi
1 2 3
x
±SD
Be rat
cawan
(g) 35,5190 75,7737 58,5193
Contoh cara perhitungan :
Be rat Berat konstan atau
ekstrak yang sudah (g) dipanaskan (g)
5,0122 36,5361
5,0033 76,7417
5,0061 59,5030
Berat konstan a tau yang sudah dipanaskan- berat cawan x 100% Berat ekstrak
36,5361-35,5190 X 100%
~ 20,29% 5,0122
% kadar
Tabe1 4.25. Hasi1 uji kadar sari 1arut a1koho1 ekstrak wortel Replikasi Be rat Be rat Berat konstan % kadar
cawan ekstrak atau yang sudah
(~) (~) diJ:!anaskan (~)
1 410726 5,078 41,1889 2,2
2 42,8185 5,014 42,9202 2,02
3 44,7530 5,0034 44,8690 2,11
X±SD 2,11 ± 0,09
Contoh cara perhitungan :
Berat konstan a tau yang sudah dipanaskan- berat cawan x 100% Berat ekstrak
41,1889- 41,0726x 100%
~ 2,2% 5,078
B. Standarisasi parameter spesifik ekstrak wortel
Tabe1 4.26. Hasi1 pemeriksaan uji susut pengeringan ekstrak wortel
Replikasi
1 2 3 X±SD
ReJ:!likasi 1 2 3 X±SD
Ekstrak wortel 1,2 1,4 1,3 1,3±0,1
Tabe1 4.27. Hasi1 uji kadar air ekstrak wortel
Be rat Be rat Berat cawan + % kadar
cawan cawan + ekstrak
(~) ekstrak ~) konstan (~)
22,2045 24,2597 24,1076 2,0173
23,4033 25,4981 25,3445 0,6023
23,7894 25,8790 25,6999 0,6921
0,6472 ± 0,0634
Contoh cara perhitungan :
(Berat cawan
+
ekstrak) - (berat cawan+
ekstrakkonstan) x 100% Berat cawan+
ekstrak25,498]- 25,3445 X 100%
25,4981 ~ 0,6023%
I abel 4.28. Hasil uji kadar abu total ekstrak wortel Replikasi Be rat Be rat Berat krus +
krus (g) ekstrak abu konstan
1 22,2271
2 21,2816
3 21,0179
X±SD
Contoh cara perhitungan :
(Berat krus
+
abu konstan) - berat krus x I 00% Berat ekstrak22,3664-22,2271 X ]00%
2,5018 ~ 5,56%
% kadar
5,56 5,52 5,65 5,57 ± 0,06
I abel 4.29. Hasil uji kadar abu tidak larut asam ekstrak wortel Replikasi Be rat Berat krus Berat abu + % kadar
krus (g) + abu (g) HCl konstan
1 34,2472 34,5671 34,4322 57,83
2 33,2356 33,5153 33,4044 60,35
3 34,2005 34,5672 34,4315 62,99
Contoh cara perhitungan :
( Berat abu + HC1 konstan) - berat krus x 100% (Berat krus + abu) - berat krus
34,4322- 34,2472 X 100%
34,5671 - 34,2472 ~ 57,83%
Tabe14.30. Hasi1 uji kadar abu 1arut air ekstrak wortel
Replikasi Be rat Berat krus Berat abu
krus (g) + abu konstan + aquades
1 22,0774 22,1605 22,1379
2 21,8904 21,9956 21,9349
3 23,7822 23,8829 23,8344
x±SD
Contoh cara perhitungan :
Berat abu sete1ah penam bahan aquades x 100%
(Berat krus + abu) - berat krus
22,1379-22,0774 X 100%
22,1605-22,0774
96
% kadar
72,8 42,3 51,8
I abel 4.24. Hasil penentuan ukuran partikel ekstrak wortel
Replikasi No. d Lnd Be rat % % Nilai
mes (ftm) (ftm) ekstrak bobot FKB
z
h yang
tertahan (~)
1 20 850 6,7452 0 0 99,84 2,95
40 425 6,0529 0,23 0,23 99,61 2,66 60 250 5,5215 2,45 2,45 98,16 2,09 80 180 5,1930 6,93 6,93 91,23 1,35 100 150 5,0106 11,28 11,28 79,95 0,84 120 125 4,8283 20,97 20,97 58,98 0,21
Pan 0 59,98 59,98 0 -3,9
I
99,842 20 850 6,7452 0 0 99,5 2,58
40 425 6,0529 1,13 1,13 98,37 2,14
60 250 5,5215 6,3 6,3 92,07 1,41
80 180 5,1930 11,34 11,34 80,73 0,87
100 150 5,0106 16 16 64,73 0,38
120 125 4,8283 17,43 17,43 47,0 -0,07
Pan 0 47,3 47,3 0 -3,9
I
99,53 20 850 6,7452 0 0 99,56 2,62
40 425 6,0529 2 2 97,56 1,97
60 250 5,5215 11,94 11,94 85,62 1,06 80 180 5,1930 13,53 13,53 72,09 0,6 100 150 5,0106 15,44 15,44 56,65 0,17 120 125 4,8283 18,75 18,75 37,9 -0,31
Pan 0 37,9 37,9 0 -3,9
99,56
ReJ:!likasi d50% d84% "~ dvs
1 49,94 130,84 2,6199 0,825
2 70,64 199,93 2,8302 0,943
3 83,09 242,25 2,9155 1,001
Contoh cara perhitungan :
Log dvs ~log dg (50%)- 1,151 log' og
~log 49,94 -1,151 log2 2,6199 ~ 1,6984- 0,8724
LAMPIRANB
HASIL PERIITTUNGAN LARUT AN PENY ALUT TABLET SALUT ENTERIK EKSTRAK WORTEL
Contoh hasil perhitungan larutan penyalut : Jumlah tablet inti : 350 biji
Jumlah total tablet inti : 236,9 gram
Jumlah HPMCP (dengan penambahan bobot 4%): 4/100 x 236,9 ~ 9,476 gram
Volume pelarut cam pur dengan konsentrasi HPMCP 5%: 100/5 x 9,476 ~ 189,52 ml
Jumlah plastisaiser 0,5%: 0,51100 x 9,476 ~ 0,0473 gram Beratjenis plastisaiser: 1,4056 g/cm3
Volume plastisaiser: 0,0473 ~ 0,0336 ml ~ 33,6 fll 1,4056
Jumlah talk 4%: 4/100 x 9,476 ~ 0,3790 gram
% pelarut campuran : 189,52- (9,476
+
0,0473)+
0,3790 ~ 180,37LAMPIRANC
HASIL PERIITTUNGAN PERBANDINGAN PENGISI PADA EKSTRAK WORTEL
Contoh hasil perhitungan :
Rasia ekstrak : pengisi ~ 100 : 18,5 Aerosil (1): Maltodextrin (17,5) Dosis ekstrak untuk tiap tablet : 400 mg
LAMPIRAND
HASIL PERIITTUNGAN KONVERSI NILAI TINGKAT MENJADI NILAIRIIL
Contoh hasil perhitungan konversi nilai tingkat menjadi nilai riil X' ~X -rata-rata 2 level
Yz x perbedaan level
x' :
level dalam bentuk bakuX : level sesungguhnya (level dalam bentuk %) HPMCP: -1,00 ~X -7,5
Yz X 5
x
~5%Gliserol: -1,00 ~X- 0,75
'
-!!,X 0,5
X ~0,5%
LAMPIRANE
HASIL ANALISIS DATA DENGAN DESIGN EXPERT SECARA FAKTOR DESIGN UNTUK RESPON KEKERASAN TABLET
SALUT ENTERIK EKSTRAK WORTEL
Response 1 Kekerasan (kgf)
ANOV A for selected factorial model
Analysis of variance table [Partial sum of squares - Type III]
Source
Model A-HPMCP
Sum of Mean F p-value
Squares df Square Valu Prob > F
4.37 3 1.46 17.98 0.0087 Signifikan 2.23 I 2.23 27.47 0. 0063
B-Gliserol 4.050£-003 I 4.050£-003 0.050 0.834I
AB 2.I4 I 2.I4 6.43 0.0068
Pure Error Cor Total
0.32 4 0.081 4.70 7
The Model F -value of 17.98 implies the model is significant There is only a 0. 87% chance that a "Model F-Value" this large could occur due to noise. Values of "Frob> F" less than 0.0500 indicate model terms are significant. In this case
A
ABare significant model terms.Values greater than 0.1000 indicate the model terms are not significant
If there are many insignificant model terms (not counting those required to support hierarchy), model reduction may improve your model.
Std. Dev. Mean CV% PRESS
0.28 8.34 3.41 1.30
R-Squared Adj R-Squared Pred R-Squared Adeq Precision
0.9310 8792 0.7239 10.382
The "Pred R-Squared" of 0.7239 is in reasonable agreement with the "Adj R-Squared" of0.8792.
Coefficient Standard 95% CI
Factor Estimate df Error Low
Intercept 8.34 I 010 8 06
A-HPMCP 0.53 I 010 0.25
B-Gliserol -0 023 I 010 -0.30
AB0.52 I 010 0.24 0.80
Final Eqnation in Terms of Coded Factors: Kekerasan (kgf)
+8.34 +0.53 -0 023 +0.52
*A *B *A*B Final Eqnation in Terms of Actual Factors: Kekerasan (kgf)
+8.34250
+0.52750 *HPMCP
* Gliserol
95% CI High VIF
8.62 0.81 1.00 0.26 1.00
1.00
-0 022500
+0.51750 * HPMCP * Gliserol
The Diagnostics Case Statistics Report has been moved to the Diagnostics Node.
In the Diagnostics Node, Select Case Statistics from the View Menu. Proceed to Diagnostic Plots (the next icon in progression). Be sure to look at the:
I) Normal probability plot of the studentized residuals to check for normality of residuals.
2) Studentized residuals versus predicted values to check for constant error. 3) Externally Studentized Residuals to look for outliers, i.e., influential values.
4) Box-Cox plot for power transformations.
If all the model statistics and diagnostic plots are OK, finish up with the Model Graphs icon.
LAMPIRANF
HASIL ANALISIS DATA DENGAN DESIGN EXPERT SECARA FAKTORDESIGNUNTUKRESPONWAKTUHANCUR TABLET
SALUT ENTERIK EKSTRAK WORTEL
Use your mouse to right click on individual cells for definitions.
Response 2 Waktu Hancur (menit)
ANOV A for selected factorial model
Analysis of variance table [Partial sum of squares - Type Ill]
Sum of Mean F p-value
Source Squares df Square Valu Prob > F
Model 102 3 0.34 10.80 0.0218 Signifikan
A-HPMCP 0.7I I 0.7I 22.77 0.0088
B-Gliserol 2.113£-003 I 2.113£-003 0. 067 0.8080
AB 0.30 I 0.30 9.58 0. 0364
PureError 0.13 4 0.031 Cor Total 1.14 7
The Model F-value of 10.80 implies the model is significant There is only a 2.18% chance that a "Model F-Value" this large could occur due to noise. Values of "Frob> F" less than 0.0500 indicate model terms are significant. In this case
A
ABare significant model terms.Values greater than 0.1000 indicate the model terms are not significant
If there are many insignificant model terms (not counting those required to support hierarchy), model reduction may improve your model.
Std. Dev. Mean CV% PRESS
0.18 12.48
1.42 0.50
R-Squared Adj R-Squared Fred R-Squared Adeq Precision
0.8901 0.8077 0.5606 7.866
"Adeq Precision" measures the signal to noise ratio. A ratio greater than 4 is desirable. Your ratio of 7.866 indicates an adequate signal. This model can be used to navigate the design space.
Coefficient Standard 95% CI
Factor Estimate df Error Low
Intercept 12.48 1 0.063 12.30 A-HPMCP -0.30 1 0.063 -0.47 B-Gliserol -0 016 1 0.063 -0.19
ABO.l9 1 0.063 -0.37 -0020
Final Equation in Terms of Coded Factors: Waktu Hancur (menit)
+12.48 -0.30 -0 016 -0.19
*A *B *A*B
Final Equation in Terms of Actual Factors:
Waktu Hancur (menit) + 12.47875
-0.29875 -0 016250
*HPMCP * Gliserol
95% CI High VIF
12.65 -0.12 1.00
0.16 1.00 1.00
-0.19375 * HPMCP * Gliserol
The Diagnostics Case Statistics Report has been moved to the Diagnostics Node. In the Diagnostics Node, Select Case Statistics from the View Menu. Proceed to Diagnostic Plots (the next icon in progression). Be sure to look at the:
1) Normal probability plot of the studentized residuals to check for normality of residuals.
2) Studentized residuals versus predicted values to check for constant error. 3) Externally Studentized Residuals to look for outliers, i.e., influential values.
4) Box-Cox plot for power transformations.
LAMPIRANG
HASIL ANALISIS DATA DENGAN DESIGN EXPERT SECARA FAKTOR DESIGN UNTUK RESPON TAMPILAN VISUAL TABLET
SALUT ENTERIK EKSTRAK WORTEL
Use your mouse to right click on individual cells for definitions.
Response 3 Tampilan Visual(%)
ANOV A for selected factorial model
Analysis of variance table [Partial sum of squares - Type III]
Sum of Mean F p-value
Source Squares df Square Valu Prob> F
Model 2.49 3 0.83 18.03 0.0087 Signifikan A-HPMCP 0.20 I 0.21 4.38 0.1046
B-Giiserol 1.61 I 1.61 34.97 0.0041
AB 0.68 I 0.68 14.73 0.0185
Pure Error 0.18 4 0.046 Cor Total 2.68 7
The Model F -value of 18.03 implies the model is significant There is only a 0.87% chance that a "Model F-Value" this large could occur due to noise. Values of "Frob> F" less than 0.0500 indicate model terms are significant. In this case B, ABare significant model terms.
Values greater than 0.1000 indicate the model terms are not significant
If there are many insignificant model terms (not counting those required to support hierarchy), model reduction may improve your model.
Std. Dev. Mean CV% PRESS
0.21 96.42
022 0.74
R-Squared Adj R-Squared Fred R-Squared Adeq Precision
0.9311 0.8795 0.7245 9.752
The "Fred R-Squared" of 0.7245 is in reasonable agreement with the "Adj R-Squared" of0.8795.
"Adeq Precision" measures the signal to noise ratio. A ratio greater than 4 is desirable. Your ratio of 9.752 indicates an adequate signal. This model
can be used to navigate the design space.
Coefficient Standard 95% CI 95% CI
Factor Estimate df Error Low
Intercept 96.42 I 0.076 96.21 A-HPMCP -0.16 I 0.076 -0.37 B-Gliserol 0.45 I 0.076 0.24
AB0.29 I 0.076 0.081 0.50
Final Eqnation in Terms of Coded Factors: Tampilan Visual(%)
+96.42 -0.16 +0.45 +0.29
*A *B *A*B
Final Eqnation in Terms of Actual Factors: Tampilan Visual(%)
+96.41875 -0.15875 +0.44875
*HPMCP * Gliserol
High VIF 96.63 0.052 1.00
0.66 1.00 1.00
+0.29125 * HPMCP * Gliserol
The Diagnostics Case Statistics Report has been moved to the Diagnostics Node.
In the Diagnostics Node, Select Case Statistics from the View Menu. Proceed to Diagnostic Plots (the next icon in progression). Be sure to look at the:
I) Normal probability plot of the studentized residuals to check for normality of residuals.
2) Studentized residuals versus predicted values to check for constant error. 3) Externally Studentized Residuals to look for outliers, i.e., influential values.
If all the model statistics and diagnostic plots are OK, finish up with the Model Graphs icon.
LAMPIRANH
HASIL UJI KESERAGAMAN PERTAMBAHAN BOBOT TABLET SALUT ENTERIK EKSTRAK WORTEL
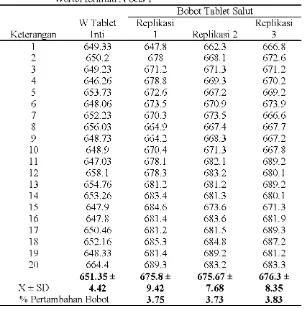
Tabel. Uji keseragaman pertam bahan bobot tablet salut enterik ekstrak Wortel formula A bets 1
Bobot Tablet Salut
W Tablet Replikasi Replikasi
Keterangan Inti 1 ReJ:likasi 2 3
1 649.33 647.8 662.3 666.8
2 650.2 678 668.1 672.6
3 649.23 671.2 671.3 671.2
4 646.26 678.8 669.3 670.2
5 653.73 672.6 667.2 669.2
6 648 06 673.5 670.9 673.9
7 652.23 670.3 673.5 666.6
8 65603 664.9 667.4 667.7
9 648.73 664.2 668.3 667.2
10 648.9 670.4 671.3 667.8
11 64703 678.1 682.1 689.2
12 658.1 678.3 683.2 680.1
13 654.76 681.2 681.2 689.2
14 653.26 683.4 681.3 680.1
15 647.9 684.6 673.6 671.3
16 647.8 681.4 683.6 681.9
17 650.46 681.2 681.5 689.3
18 652.16 685.3 684.8 687.2
19 648.33 681.4 689.2 681.2
20 664.4 689.3 683.2 683.3
651.35 ± 675.8± 675.67 ± 676.3 ±
X±SD 4.42 9.42 7.68 8.35
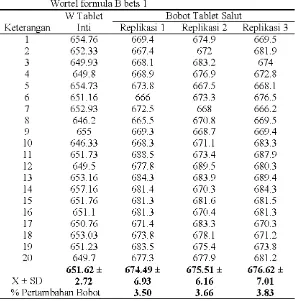
Tabel. Uji keseragaman pertam bahan bobot tablet salut enterik ekstrak W ortel formula B bets 1
W Tablet Bobot Tablet Salut
Keterangan Inti Replikasi 1 Replikasi 2 Replikasi 3
1 654.76 669.4 674.9 669.5
2 652.33 667.4 672 681.9
3 649.93 668.1 683.2 674
4 649.8 668.9 676.9 672.8
5 654.73 673.8 667.5 668.1
6 651.16 666 673.3 676.5
7 652.93 672.5 668 666.2
8 646.2 665.5 670.8 669.5
9 655 669.3 668.7 669.4
10 646.33 668.3 671.1 683.3
11 651.73 688.5 673.4 687.9
12 649.5 677.8 689.5 680.3
13 653.16 684.3 683.9 689.4
14 657.16 681.4 670.3 684.3
15 651.76 681.3 681.6 681.5
16 651.1 681.3 670.4 681.3
17 650.76 671.4 683.3 670.3
18 653 03 673.8 678.1 671.2
19 651.23 683.5 675.4 673.8
20 649.7 677.3 677.9 681.2
651.62 ± 674.49 ± 675.51 ± 676.62 ±
X±SD 2.72 6.93 6.16 7.01
% Pertam bahan Bobot 3.50 3.66 3.83
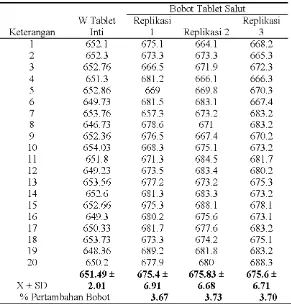
I abel. Uji keseragaman pertambahan bobot tablet salut enterik ekstrak W ortel formula C bets 1
W Tablet Bobot Tablet Salut
Keterangan Inti Replikasi 1 Replikasi 2 Replikasi 3
1 652.93 665.5 670.6 678.4
2 652.2 665.2 669.8 671.4
3 651.43 660.9 670.3 673.9
4 650.5 675.6 671.3 674.2
5 653.13 675.1 683.2 668.8
6 650 03 668.9 670.2 673.2
7 652.7 673.4 673.2 664.8
8 650.8 667.8 675.9 678.3
9 650.5 680.1 667.8 669.3
10 655.1 674.3 678.3 671.6
11 653.36 678.3 689.3 674.6
12 644.43 683.4 675.4 680.1
13 653.46 673.5 677.8 677.3
14 654.2 684.9 680.1 681.9
15 653.96 678.3 683.4 677.5
16 653.63 680.1 678.2 684.5
17 649.13 678.3 681.7 681.3
18 650.9 675.3 683.1 679.3
19 651.33 677.4 679.2 683.2
20 655.16 679.6 678.6 680.2
651.95 ± 674.8 ± 676.87± 676.19 ±
X±SD 2.45 6.32 5.75 5.26
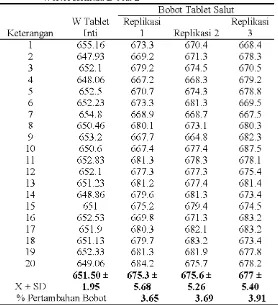
I abel. Uji keseragaman pertambahan bobot tablet salut enterik ekstrak Wortel formula D bets 1
Bobot Tablet Salut
Replikasi
Keterangan W T abletlnti Replikasi 1 Replikasi 2 3
1 648.86 673.8 684.3 666
2 65206 672.1 669.7 681.2
3 648.4 667.2 669.8 680.1
4 652.9 669.7 676.2 665.8
5 651.83 671.9 668.4 678.8
6 653.2 670.1 670.7 666.2
7 654.73 669.3 667.3 673.2
8 650.7 667.2 671.4 677.9
9 652.83 666.1 673.3 660.7
10 654.1 669.2 678.3 667.3
11 652.93 673.4 684.3 681.3
12 652.3 675.1 673.5 679.8
13 654.5 683.9 678.1 680.1
14 653.4 683.2 679.2 683.6
15 647.43 673.2 673.1 688.1
16 648.4 677.9 678.9 689.4
17 652.2 682.4 677.2 678.9
18 650.53 685.4 680.1 687.7
19 655 677.4 683.2 684.2
20 651.93 674.3 681.9 681.5
651.91 ± 674.14 ± 675.94 ± 677.6±
X±SD 2.21 5.86 5.39 8.29
% Pertam bahan Bobot 3.40 3.68 3.94
Tabel. Uji keseragaman pertam bahan bobot tablet salut enterik ekstrak W ortel formula A bets 2
Bobot Tablet Salut
W Tablet Replikasi Replikasi
Keterangan Inti 1 Replikasi 2 3
1 652.1 675.1 664.1 668.2
2 652.3 673.3 673.3 665.3
3 652.76 666.5 671.9 672.3
4 651.3 681.2 666.1 666.3
5 652.86 669 669.8 670.3
6 649.73 681.5 683.1 667.4
7 653.76 657.3 673.2 683.2
8 646.73 678.6 671 683.2
9 652.36 676.5 667.4 670.2
10 65403 668.3 675.1 673.2
11 651.8 671.3 684.5 681.7
12 649.23 673.5 683.4 680.2
13 653.56 677.2 673.2 675.3
14 652.6 681.3 683.3 673.2
15 652.66 675.3 688.1 678.1
16 649.3 680.2 675.6 673.1
17 650.33 681.7 677.6 683.2
18 653.73 673.3 674.2 675.1
19 648.36 689.2 681.8 683.2
20 650.2 677.9 680 688.3
651.49 ± 675.4 ± 675.83 ± 675.6 ±
X±SD 2.01 6.91 6.68 6.71
Tabel. Uji keseragaman pertam bahan bobot tablet salut enterik ekstrak W ortel formula B bets 2
Bobot Tablet Salut
W Tablet Replikasi Replikasi
Keterangan Inti 1 Replikasi 2 3
1 655.16 673.3 670.4 668.4
2 647.93 669.2 671.3 678.3
3 652.1 679.2 674.5 670.5
4 648 06 667.2 668.3 679.2
5 652.5 670.7 674.3 678.8
6 652.23 673.3 681.3 669.5
7 654.8 668.9 668.7 667.5
8 650.46 680.1 673.1 680.3
9 653.2 667.7 664.8 682.3
10 650.6 667.4 677.4 687.5
11 652.83 681.3 678.3 678.1
12 652.1 677.3 677.3 675.4
13 651.23 681.2 677.4 681.4
14 648.86 679.6 681.3 673.4
15 651 675.2 679.4 674.5
16 652.53 669.8 671.3 683.2
17 651.9 680.3 682.1 683.2
18 651.13 679.7 683.2 673.4
19 652.33 681.3 681.9 677.8
20 64906 684.2 675.7 678.2
651.50 ± 675.3 ± 675.6± 677 ±
X±SD 1.95 5.68 5.26 5.40
% Pertam bahan Bobot 3.65 3.69 3.91
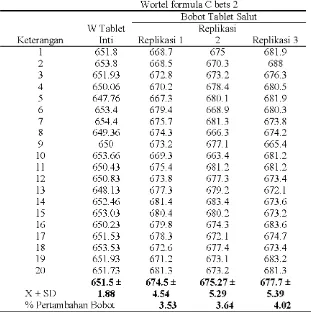
Tabel. Uji keseragaman pertam bahan bobot tablet salut enterik ekstrak Wortel formula C bets 2
Bobot Tablet Salut
W Tablet Replikasi
Keterangan Inti Replikasi 1 2 Replikasi 3
1 651.8 668.7 675 681.9
2 653.8 668.5 670.3 688
3 651.93 672.8 673.2 676.3
4 650 06 670.2 678.4 680.5
5 647.76 667.3 680.1 681.9
6 653.4 679.4 668.9 680.3
7 654.4 675.7 681.3 673.8
8 649.36 674.3 666.3 674.2
9 650 673.2 677.1 665.4
10 653.66 669.3 663.4 681.2
11 650.43 675.4 681.2 681.2
12 650.83 673.8 677.3 673.4
13 648.13 677.3 679.2 672.1
14 652.46 681.4 683.4 673.6
15 653 03 680.4 680.2 673.2
16 650.23 679.8 674.3 683.6
17 651.53 678.3 672.1 674.7
18 653.53 672.6 677.4 673.4
19 651.93 671.2 673.1 683.2
20 651.73 681.3 673.2 681.3
651.5 ± 674.5 ± 675.27± 677.7 ±
X±SD 1.88 4.54 5.29 5.39
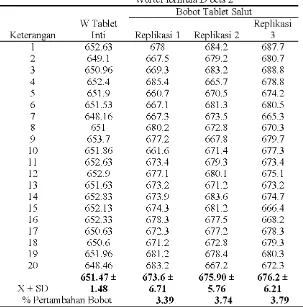
Tabel. Uji keseragaman pertam bahan bobot tablet salut enterik ekstrak W ortel formula D bets 2
Bobot Tablet Salut
W Tablet Replikasi
Keterangan Inti Replikasi 1 Replikasi 2 3
1 652.63 678 684.2 687.7
2 649.1 667.5 679.2 680.7
3 650.96 669.3 683.2 688.8
4 652.4 685.4 665.7 678.8
5 651.9 660.7 670.5 674.2
6 651.53 667.1 681.3 680.5
7 648.16 667.3 673.5 665.3
8 651 680.2 672.8 670.3
9 653.7 677.2 667.8 679.7
10 651.86 661.6 671.4 677.3
11 652.63 673.4 679.3 673.4
12 652.9 677.1 680.1 675.1
13 651.63 673.2 671.2 673.2
14 652.83 673.9 683.6 674.7
15 652.13 674.3 681.2 666.4
16 652.33 678.3 677.5 668.2
17 650.63 672.3 677.2 678.3
18 650.6 671.2 672.8 679.3
19 651.96 681.2 678.4 680.3
20 648.46 683.2 667.2 672.3
651.47 ± 673.6 ± 675.90 ± 676.2 ±
X±SD 1.48 6.71 5.76 6.21
% Pertam bahan Bobot 3.39 3.74 3.79
LAMPIRANI
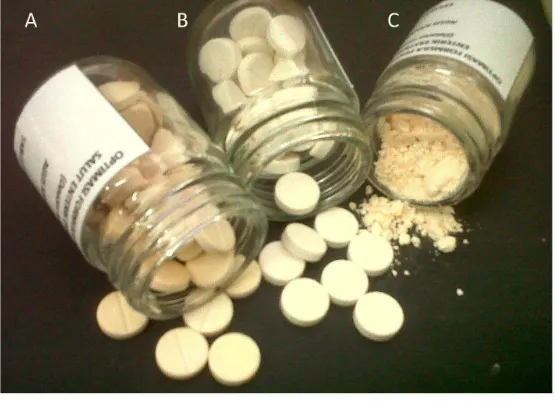
SERTIFIKAT AN ALI SIS PEMBELIAN EKSTRAK WORTEL
NATURA
FOOD & NUTRACEUTICAL COMPANY
QA Dept. Certificate of Analysis
Product Nama
Product Code
Batch/Lot No.
Manufaduring data
Best used before
Date of Issued
RA LABORATORlA PRIMA pt.
""""'
' : Wortel PE 5050A P5050A630802 April1 . . 2013 April1 . . 2014
Apt1129.2013
fino Characteriltic odour and taste
ol carrot
Sotubee in Wlilr
Min.80% Mox.8%
0.50-1 .10 ml
4.0-7.0
Max.1 .1
Max. 1.1
Fact:oty • Extrac:tkm C.nt.r
~
....
,
w ... ..
Ref No. o:zMotCoNQMV/1)
Rnults
Oro
Canfcnn Canfcnn
Canfcnn
99.80% 152%
0 733 ml
476
< 1.10
< 11
Pair 1
LAMPIRANJ
HASIL UJI STATISTIK ANT AR BETS TABLET SALUT ENTERIK EKSTRAK WORTEL
A Keseragaman Pertambahan Bobot Formula A
Paired Samples Statistics
Std. Std. Error
Mean N Deviation Mean
Pair 1 FormulaA bets! 675.9200 20 7.76198 1.73563 Farm ulaA bets2 675.5983 20 4.71382 105404
Paired Samples CorrelatiOns
N Correlation Sig. Pair 1 FormulaA bets! & 20 .706 000
Farm ulaA bets2
Paired Samples Test
Paired Differences
95% Confidence Interval of the
Std. Std. Error Difference
Mean Deviation Mean Lower Upper t df
FormulaA bets! - .32167 5.54782 1.24053 -2.27479 2.91813 .259 19 FormulaA bets2
T hi tung 0, 798 < T o,05 (19) ~ 1, 729 sehingga tidak ada perbedaan bermakna
118
Sig. (2-tailed)
FormulaE
Paired Samples Statistics
Std. Std. Error Mean N Deviation Mean Pair 1 FormulaE bets! 675.5400 20 5.08239 1.1364(
Farm ulaE bets2 675.9967 20 3.63170 .8120
Paired Samples CorrelatiOns
N Correlation Sig. Pair 1 FormulaE be 20 .593 .006
tsl & FormulaE be ts2
Parred Samples Test Paired Differences
95% Confidence
Sig.
Std. Interval of the
(2-Std. Error Difference tailed
Mean Deviation Mean Lower Upper t df )
Pair 1 FormulaE -.45667 4.13940 .92560 -2.39397 1.48063 -.493 19 .627 bets!
-FormulaE bets2
Formulae
Paired Samples Statistics
Std. Std. Error Mean N Deviation Mean Pair 1 Formulae bets! 675.9517 20 4.49251 100456
Formulae bets2 675.8250 20 2.42407 .54204
Paired Samples CorrelatiOns
N Correlation Sig. Pair 1 Formulae bets! & 20 .476 .034
Formulae bets2
Parred Samples Test Paired Differences
95% emfidence Interval of the
Sig. Std. Std. Error Difference (2-Mean Deviation Mean Lower Upper t df tailed) Pair 1 Formulae .12667 3.96071 .88564 -172700 198033 .143 19 .888
bets! -Formulae
bets2
T hi tung 0, 888 < T o,05 (19) ~ 1, 729 sehingga tidak ada perbedaan bermakna
Formula D
Paired Samples Statistics
Std. Std. Error Mean N Deviation Mean Pair 1 Formulae bets! 675.8917 20 5.12803 1.1466t
Formulae bets2 675.2500 20 3.65917 . 8182~
Pair I
Paired Samples Correlations
N Correlation Sig. !Pair I Formulae bets! & 20 .160 .50(
Formulae bets2
Parred Samples Test Paired Differences
95% Confidence
Std. Interval of the Difference Std. Error
Mean Deviation Mean Lower Upper t df
F orrnulaC bets 1 - .64167 5.80347 1.29769 -2.07444 3.35777 .494 19 F orrnulaC bets2
T hi tung 0,627 < T o,05 (19) ~ I, 729 sehingga tidak ada perbedaan bermakna
B. Kekerasan
Pair I
Formula A Paired Samples Statistics
Std. Mean N Deviation FormulaA bets! 9.4000 10 .77889 Farm ulaA bets2 9.3300 10 .82603
Paired Samples Correlations
N Correlation
Std. Error Mean
.24631 .26122
Sig.
Pair 1 F orrnulaA bets 1 10 -.150 .679
&
F orrnulaA bets2
Sig. (2-tailed)
Pair 1
Paired Samples Test
Paired Differences
95% Confidence
Std. Interval of the Std. Error Difference
Mean Deviation Mean Lower Upper t df
ForrnulaA bets! - .07000 1.21751 .38501 -.80095 .94095 .182 9 ForrnulaA bets2
T hitung 0,182 < T0 ,05 (9) ~ 1,833 sehingga tidak ada perbedaan bermakna
antar bets
Pair 1
Pair 1
Formula B Paired Samples Statistics
Std.
Mean N Deviation
FormulaE bets! 8.2400 10 1.52912 Farm ulaE bets2 8.4700 10 1.22116
Paired Samples Correlations
Std. Error
Mean
.48355 .38616
N Correlation Sig.
FormulaE bets! & 10 .609 .061 FormulaE bets2
122
Pair 1
Paired Samples Test
Paired Differences
95% Confidence
Std. Interval of the Std. Error Difference
Mean Deviation Mean Lower Upper t df
F orrnulaB bets 1 - -.23000 1.24637 .39414 -1.12160 .66160 -.584 9
F orrnulaB bets2
T hitung -0,584 < T0,05 (9) ~ 1,833 sehingga tidak ada perbedaan bermakna
antar bets
Pair 1
Formula C Paired Samples Statistics
Std.
Mean N Deviation
Formulae bets! 7.0700 10 .57164 Formulae bets2 8.0500 10 1.21769
Paired Samples Correlations
N Correlation
Pair 1 Farm ulae bets 1 & 10 .221 Farm ulae bets2
Std. Error
Mean
.18077 .38507
Sig. .539
Sig. (2-tailed)
Pair 1
Paired Samples Test
Paired Differences
95% Confidence
Std. Interval of the Std. Error Difference
Mean Deviation Mean Lower Upper t df
Formulae bets! - -.98000 1.22547 .38753 -1.85665 -.10335 -2.529 9
Formulae bets2
T hitung -0,584 < T0,05 (9) ~ 1,833 sehingga tidak ada perbedaan bermakna
antar bets
Pair 1
FormulaD Paired Samples Statistics
Std. Mean N Deviation FormulaD bets! 7.4800 10 103473 Farm ulaD bets2 8.7000 10 1.20738
Paired Samples Correlations
N Correlation Pair 1 FormulaD bets! & 10 -.579
Farm ulaD bets2
124
Std. Error Mean
.32721 .38181
Sig. .079
Pair 1
Paired Samples Test
Paired Differences
95% Confidence
Std. Interval of the
Std. Error Difference
Mean Deviation Mean Lower Upper t df
FormulaD betsl - -1.22000 1.99377 .63048 -2.64626 .20626 -1.935 9
FormulaD bets2
T hitung -1,935 < T0,05 (9) ~ 1,833 sehingga tidak ada perbedaan bermakna
antar bets
C. Waktu Hancur
Pair 1
Formula A Paired Samples Statistics
Mean N
FormulaA bets! 12.7000 2 Farm ulaA bets2 131750 2
Std.
Deviation
. 87681 .13435
Paired Samples Correlations
N Correlation
Pair 1 FormulaA bets! & 2 -1000 Farm ulaA bets2
Std. Error
Mean
.62000 .09500
Sig. 000
Sig. (2-tailed)
Pair 1
Paired Samples Test
Paired Differences
95% Confidence
Std. Std. Interval of the
Deviat:io Error Difference
Mean n Mean Lower Upper t df FonnulaA bets! - -.47500 1.01116 .71500 -9.55994 8.60994 -.664 1 FonnulaA bets2
T hitung -0,664 < T0,05 (1) ~ 6,324 sehingga tidak ada perbedaan bermakna
antar bets
Pair 1
Pair 1
FormulaE FormulaE
Formula B Paired Samples Statistics
Mean N
bets! 12.3500 2
bets2 12.7400 2
Std.
Deviation
1.30108 .77782
Paired Samples Correlations
N Correlation
FormulaE bets! & 2 1000 Farm ulaE bets2
126
Std. Error
Mean
92000 .55000
Sig. 000
Sig. (2-tailed)
Pair 1
Paired Samples Test
Paired Differences
95% Confidence
Std. Interval of the
Std. Error Difference
Mean Deviation Mean Lower Upper t df
F orrnulaB bets 1 - -.39000 .52326 .37000 -5.09130 4.31130 -1.054 1
F orrnulaB bets2
T hitung -1,054 < T0,05 (1) ~ 6,324 sehingga tidak ada perbedaan bermakna
antar bets
Pair 1
Pair 1
Formula C Paired Samples Statistics
Std.
Mean N Deviation
Formulae bets! 13.2300 2 .28284 Formulae bets2 12.4950 2 1.37886
Paired Samples Correlations
N Correlation Sig.
Formulae bets! & 2 1000 000 Formulae bets2
Std. Error
Mean
.20000 .97500
Sig.
(2-tailed)
Pair 1
Paired Samples Test
Paired Differences
95% Confidence
Std. Interval of the
Std. Error Difference
Mean Deviation Mean Lower Upper t df
F orrnulaC bets 1 - .73500 1.09602 .77500 -9.11231 10.58231 .948
F orrnulaC bets2
T hitung 0,948 < T0 ,05 (1) ~ 6,324 sehingga tidak ada perbedaan bermakna
antar bets
Pair 1
Formula D Paired Samples Statistics
Mean N
FormulaD bets! 12.7950 2 Farm ulaD bets2 11.8950 2
Std. Deviation
102530 .58690
Paired Samples Correlations
N Correlation Pair 1 FormulaD bets! & 2 -1000
Farm ulaD bets2
128
Std. Error Mean
.72500 .41500
Sig. 000
Sig.
(2-tailed)
Pair 1
Paired Samples Test
Paired Differences
95% Confidence
Std. Interval of the
Std. Error Difference
Mean Deviation Mean Lower Upper t df
FormulaD betsl - .90000 1.61220 1.14000 -13.58507 15.38507 .789
FormulaD bets2
T hitung 0,948 < T0 ,05 (1) ~ 6,324 sehingga tidak ada perbedaan bermakna
antar bets
1 Sig.
(2-tailed)
LAMPIRANK
HASIL UJI STATISTIKANTAR FORMULA TABLET SALUT ENTERIK EKSTRAK WORTEL
A Keseragaman Bobot
ANOVA
formula!
Sum of Mean
Squares df Square F Sig.
Between Groups 9.462 7 1.352 .058 1000
Within Groups 3557.434 152 23.404
Total 3566.896 159
F hrtung (0,058) < F0 ,05 - 2,07 trdak ada perbedaan bermakna antar
formula
Post Hoc Tests Keseragarnan Bobot
TukeyHSD
(I)
formula (J) formula
forrnulaA formulaE
formulae
forrnulaD
forrnulaA 2
formulaE 2
formulae 2
forrnulaD 2
formulaE forrnulaA
formulae
forrnulaD
forrnulaA 2
Multiple Comparisons
Mean
Difference Std.
(1-J) Error
.38000 1.52984
-.03167 1.52984
.02833 1.52984
.32167 1.52984
-.07667 1.52984
.09500 1.52984
.67000 1.52984
-.38000 1.52984 -.41167 1.52984
-.35167 1.52984 -.05833 1.52984
130
95% Confidence Interval
Lower Upper Sig. Bmmd Bmmd
1.000 -4.3222 5.0822
1.000 -4.7338 4.6705
1.000 -4.6738 4.7305
1.000 -4.3805 5.0238
1.000 -4.7788 4.6255
1.000 -4.6072 4.7972
1.000 -4.0322 5.3722
1.000 -5.0822 4.3222
1.000 -5.1138 4.2905
1.000 -5.0538 4.3505
formulaE 2 -.45667 1.52984 1.000 -5.1588 4.2455
formulae 2 -.28500 1.52984 1.000 -4.9872 4.4172
formulaD 2 .29000 1.52984 1.000 -4.4122 4.9922
formulae formulaA .03167 1.52984 1.000 -4.6705 4.7338
formulaE .41167 1.52984 1.000 -4.2905 5.1138
formulaD .06000 1.52984 1.000 -4.6422 4.7622
formulaA 2 .35333 1.52984 1.000 -4.3488 5.0555
formulaE 2 -.04500 1.52984 1.000 -4.7472 4.6572
formulae 2 .12667 1.52984 1.000 -4.5755 4.8288
formulaD 2 .70167 1.52984 1.000 -4.0005 5.4038
formulaD formulaA -.02833 1.52984 1.000 -4.7305 4.6738
formulaE .35167 1.52984 1.000 -4.3505 5.0538
formulae -.06000 1.52984 1.000 -4.7622 4.6422
formulaA 2 .29333 1.52984 1.000 -4.4088 4.9955
formulaE 2 -.10500 1.52984 1.000 -4.8072 4.5972
formulae 2 .06667 1.52984 1.000 -4.6355 4.7688
formulaD 2 .64167 1.52984 1.000 -4.0605 5.3438
formulaA formulaA -.32167 1.52984 1.000 -5.0238 4.3805
2 formulaE .05833 1.52984 1.000 -4.6438 4.7605
formulae -.35333 1.52984 1.000 -5.0555 4.3488
formulaD -.29333 1.52984 1.000 -4.9955 4.4088
formulaE 2 -.39833 1.52984 1.000 -5.1005 4.3038
formulae 2 -.22667 1.52984 1.000 -4.9288 4.4755
formulaD 2 .34833 1.52984 1.000 -4.3538 5.0505
formulaE formulaA .07667 1.52984 1.000 -4.6255 4.7788
2 formulaE .45667 1.52984 1.000 -4.2455 5.1588
formulae .04500 1.52984 1.000 -4.6572 4.7472
formulaD .10500 1.52984 1.000 -4.5972 4.8072
formulaA 2 .39833 1.52984 1.000 -4.3038 5.1005
formulae 2 .17167 1.52984 1.000 -4.5305 4.8738
formulaD 2 .74667 1.52984 1.000 -3.9555 5.4488
formulae formulaA -.09500 1.52984 1.000 -4.7972 4.6072
formulae -.12667 1.52984
formulaD -.06667 1.52984
formulaA 2 .22667 1.52984
formulaE 2 -.17167 1.52984
formulaD 2 .57500 1.52984
formulaD formulaA -.67000 1.52984
2 formulaE -.29000 1.52984
formulae -.70167 1.52984
formulaD -.64167 1.52984
formulaA 2 -.34833 1.52984
formulaE 2 -.74667 1.52984
formulae 2 -.57500 1.52984
Homogeneous Subsets
Keseragaman Bobot TukeyHSD"
Subset for alpha= 0.05
formula N 1
formulaD 2 20 675.2500
formulaE 20 675.5400
formulaA 2 20 675.5983
formulae 2 20 675.8250
formulaD 20 675.8917
formulaA 20 675.9200
formulae 20 675.9517
formulaE 2 20 675.9967
Sig. 1.000
Means for groups m homogeneous subsets are displayed. a. Uses Harmonic Mean Sample Size= 20.000.
132
1.000 -4.8288 4.5755
1.000 -4.7688 4.6355
1.000 -4.4755 4.9288
1.000 -4.8738 4.5305
1.000 -4.1272 5.2772
1.000 -5.3722 4.0322
1.000 -4.9922 4.4122
1.000 -5.4038 4.0005
1.000 -5.3438 4.0605
1.000 -5.0505 4.3538
1.000 -5.4488 3.9555
B. Kekerasan
ANOVA Kekerasan
Sum of Squares df Mean Square F Sig.
Between Groups 46.968 7 6.710 5.676 000
Within Groups 85.108 72 1.182
Total 132 076 79
F hitung (5,676) > F0 ,05
=
2,014 ada perbedaan bermakna antar formulaPost Hoc Tests Kekerasan TukeyHSD
(I) formula formulaA formulaE (J) formula formulaE formulae formulaD
formulaA 2
formulaE 2
formulae 2
formulaD 2
formulaA
formulae
formulaD
formulaA 2
formulaE 2
formulae 2
Multiple Comparisons
Mean
Difference Std.
(1-J) Error Sig.
1.16000 .48622 .264
2.33000' .48622 .000
1.92000' .48622 .004
.07000 .48622 1.000
.93000 .48622 .547
1.35000 .48622 .117
.70000 .48622 .836
-1.16000 .48622 .264
1.17000 .48622 .254
.76000 .48622 .770
-1.09000 .48622 .340 -.23000 .48622 1.000
.19000 .48622 1.000
95% Confidence Interval
Lower Upper
Emmd Emmd
-.3579 2.6779
.8121 3.8479
.4021 3.4379
-1.4479 1.5879
-.5879 2.4479
-.1679 2.8679
-.8179 2.2179
-2.6779 .3579
-.3479 2.6879
-.7579 2.2779
-2.6079 .4279
-1.7479 1.2879
formulaD 2 -.46000 .48622 .980 -1.9779 1.0579
formulae formulaA -2.33000' .48622 .000 -3.8479 -.8121
formulaE -1.17000 .48622 .254 -2.6879 .3479
formulaD -.41000 .48622 .990 -1.9279 1.1079
formulaA 2 -2.26000' .48622 .000 -3.7779 -.7421
formulaE 2 -1.40000 .48622 .092 -2.9179 .1179
formulae 2 -.98000 .48622 .479 -2.4979 .5379
formulaD 2 -1.63000' .48622 .027 -3.1479 -.1121
formulaD formulaA -1.92000' .48622 .004 -3.4379 -.4021
formulaE -.76000 .48622 .770 -2.2779 .7579
formulae .41000 .48622 .990 -1.1079 1.9279
formulaA 2 -1.85000' .48622 .007 -3.3679 -.3321
formulaE 2 -.99000 .48622 .466 -2.5079 .5279
formulae 2 -.57000 .48622 .937 -2.0879 .9479
formulaD 2 -1.22000 .48622 .208 -2.7379 .2979
formulaA 2 formulaA -.07000 .48622 1.000 -1.5879 1.4479
formulaE 1.09000 .48622 .340 -.4279 2.6079
formulae 2.26000' .48622 .000 .7421 3.7779
formulaD 1.85000' .48622 .007 .3321 3.3679
formulaE 2 .86000 .48622 .643 -.6579 2.3779
formulae 2 1.28000 .48622 .161 -.2379 2.7979
formulaD 2 .63000 .48622 .898 -.8879 2.1479
formulaE 2 formulaA -.93000 .48622 .547 -2.4479 .5879
formulaE .23000 .48622 1.000 -1.2879 1.7479
formulae 1.40000 .48622 .092 -.1179 2.9179
formulaD .99000 .48622 .466 -.5279 2.5079
formulaA 2 -.86000 .48622 .643 -2.3779 .6579
formulae 2 .42000 .48622 .988 -1.0979 1.9379
formulaD 2 -.23000 .48622 1.000 -1.7479 1.2879
formulae 2 formulaA -1.35000 .48622 .117 -2.8679 .1679
formulaE -.19000 .48622 1.000 -1.7079 1.3279
formulae .98000 .48622 .479 -.5379 2.4979
formulaD .57000 .48622 .937 -.9479 2.0879
formulaA 2 -1.28000 .48622 .161 -2.7979
formulaE 2 -.42000 .48622 .988 -1.9379
forrnulaD 2 -.65000 .48622 .882 -2.1679
forrnulaD 2 forrnulaA -.70000 .48622 .836 -2.2179
formulaE .46000 .48622 .980 -1.0579
formulae 1.63000' .48622 .027 .1121
forrnulaD 1.22000 .48622 .208 -.2979
formulaA 2 -.63000 .48622 .898 -2.1479
formulaE 2 .23000 .48622 1.000 -1.2879
formulae 2 .65000 .48622 .882 -.8679
Homogeneous Subsets
Kekerasan
TukeyHSD'
Subset for alpha ~ 0. 05
formula2 N 1 2
formulae 10 7.0700
formulaD 10 7.4800 7.4800
formulae 2 10 8.0500 8.0500
formulaE 10 8.2400 8.2400
formulaE 2 10 8.4700 8.4700
formulaD 2 10 8.7000
formulaA 2 10
formulaA 10
Sig. 092 .208
Means for groups m homogeneous subsets are displayed. a. Uses Harmmic Mean Sample Size~ 10.000.
.2379
1.0979
.8679
.8179
1.9779
3.1479
2.7379
.8879
1.7479
2.1679
3
C. Waktu Han cur
ANOVA Waktu Han cur
Sum of Squares df Mean Square F Sig.
Between Groups 3.302 7 .472 .718 .659
Within Groups 10.515 16 .657
Total 13.817 23
F hitung (0, 718) < F0 ,05
=
2,66 tidak ada perbedaan bermakna antarformula
Post Hoc Test
W aktu Han cur TukeyHSD
(I) Formula (J) Formula ForrnulaA FormulaE
Formulae
ForrnulaD
ForrnulaA 2
FormulaE 2
Formulae 2
ForrnulaD 2
FormulaE ForrnulaA
Formulae
ForrnulaD
ForrnulaA 2
FormulaE 2 Formulae 2
ForrnulaD 2
Formulae ForrnulaA
Multiple Comparisons
Mean
Difference Std.
(1-J) Error
.24333 .66192
-.29667 .66192
-.32333 .66192
-.88333 .66192
-.44333 .66192
-.20667 .66192
.36000 .66192
-.24333 .66192
-.54000 .66192
-.56667 .66192
-1.12667 .66192
-.68667 .66192
-.45000 .66192
.11667 .66192
.29667 .66192
136
95% Confidence Interval
Lower Upper Sig. Bmmd Bmmd
1.000 -2.0483 2.5350
1.000 -2.5883 1.9950
1.000 -2.6150 1.9683
.873 -3.1750 1.4083
.997 -2.7350 1.8483
1.000 -2.4983 2.0850
.999 -1.9317 2.651
1.000 -2.5350 2.0483
.990 -2.8317 1.751
.986 -2.8583 1.7250
.686 -3.4183 1.1650
.961 -2.9783 1.6050
.996 -2.7417 1.841
1.000 -2.1750 2.4083
FormulaE .54000 .66192 .990 -1.7517 2.831
FormulaD -.02667 .66192 1.000 -2.3183 2.2650
FormulaA 2 -.58667 .66192 .983 -2.8783 1.7050
FormulaE 2 -.14667 .66192 1.000 -2.4383 2.1450
Formulae 2 .09000 .66192 1.000 -2.2017 2.381
FormulaD 2 .65667 .66192 .969 -1.6350 2.9483
FormulaD FormulaA .32333 .66192 1.000 -1.9683 2.6150
FormulaE .56667 .66192 .986 -1.7250 2.8583
Formulae .02667 .66192 1.000 -2.2650 2.3183
FormulaA 2 -.56000 .66192 .987 -2.8517 1.731
FormulaE 2 -.12000 .66192 1.000 -2.4117 2.171
Formulae 2 .11667 .66192 1.000 -2.1750 2.4083
FormulaD 2 .68333 .66192 .962 -1.6083 2.9750
FormulaA 2 FormulaA .88333 .66192 .873 -1.4083 3.1750
FormulaE 1.12667 .66192 .686 -1.1650 3.4183
Formulae .58667 .66192 .983 -1.7050 2.8783
FormulaD .56000 .66192 .987 -1.7317 2.851
FormulaE 2 .44000 .66192 .997 -1.8517 2.731
Formulae 2 .67667 .66192 .964 -1.6150 2.9683
FormulaD 2 1.24333 .66192 .582 -1.0483 3.5350
FormulaE 2 FormulaA .44333 .66192 .997 -1.8483 2.7350
FormulaE .68667 .66192 .961 -1.6050 2.9783
Formulae .14667 .66192 1.000 -2.1450 2.4383
FormulaD .12000 .66192 1.000 -2.1717 2.411
FormulaA 2 -.44000 .66192 .997 -2.7317 1.851
Formulae 2 .23667 .66192 1.000 -2.0550 2.5283
FormulaD 2 .80333 .66192 .916 -1.4883 3.0950
Formulae 2 FormulaA .20667 .66192 1.000 -2.0850 2.4983
FormulaE .45000 .66192 .996 -1.8417 2.741
Formulae -.09000 .66192 1.000 -2.3817 2.201
FormulaD -.11667 .66192 1.000 -2.4083 2.1750
FormulaA 2 -.67667 .66192 .964 -2.9683 1.6150
FormulaD 2 .56667 .66192 .986
FormulaD 2 FormulaA -.36000 .66192 .999
FormulaE -.11667 .66192 1.000
Formulae -.65667 .66192 .969
FormulaD -.68333 .66192 .962
FormulaA 2 -1.24333 .66192 .582
FormulaE 2 -.80333 .66192 .916
Formulae 2 -.56667 .66192 .986
Homogeneous Subsets
Waktu Hancur TukeyHSD'
Subset for alpha~ 0.05
~<ormula N 1
~<ormulaD - 2 3 11.9333
~<ormulaB 3 12.0500
~<ormulaA 3 12.2933
IFormulaC_2 3 12.5000
!Formulae 3 12.5900
IFormulaD 3 12.6167
IF arm ulaB _ 2 3 12.7367
~<ormulaA 2 3 13.1767
Sig. .582
Means for groups m homogeneous subsets are displayed. a. Uses Harmmic Mean Sample Size~ 3.000.
138
-1.7250 2.8583
-2.6517 1.931
-2.4083 2.1750
-2.9483 1.6350
-2.9750 1.6083
-3.5350 1.0483
-3.0950 1.4883
D. Tampilan Visual
ANOVA Tampilan Visual
Sum of Squares df Mean Square F Sig.
~etween Groups 41.705 7 5.958 53.843
ooc
~ithin Groups 7.967 72 .111
Total 49.672 79
F hrtung (53,843) > F0 ,05 - 2,14 ada perbedaan bermakna antar formula
Post Hoc Tests Tarnpilan Visual TukeyHSD
(I) Formula (J) Formula
FonnulaA FormulaE
Formulae
FormulaD
FormulaA 2
FormulaE 2
Formulae 2
FormulaD 2
FormulaE FormulaA
Formulae
FormulaD
FormulaA 2
FormulaE 2
Formulae 2
FormulaD 2
Formulae FormulaA
Multiple Comparisons
Mean
Difference Std. (1-J) Error
.97000' .14876
-.61000' .14876
1.01000' .14876
-.51000' .14876
1.03000' .14876
-.59000' .14876
.87000' .14876
-.97000' .14876 -1.58000' .14876
.04000 .14876
-1.48000' .14876
.06000 .14876 -1.56000' .14876
-.10000 .14876 .61
ooo'
.1487695% Confidence Interval
Lower Upper Sig. Bmmd Bmmd
.000 .5056 1.434
.003 -1.0744 -.1456
.000 .5456 1.474
.021 -.9744 -.0456
.000 .5656 1.494
.004 -1.0544 -.1256
.000 .4056 1.334
.000 -1.4344 -.5056
.000 -2.0444 -1.1156
1.000 -.4244 .504
.000 -1.9444 -1.0156
1.000 -.4044 .524
.000 -2.0244 -1.0956
.997 -.5644 .364
FormulaE 1.58000' .14876 .000 1.1156 2.044
FormulaD 1.62000' .14876 .000 1.1556 2.084
FormulaA 2 .10000 .14876 .997 -.3644 .564
FormulaE 2 1.64000' .14876 .000 1.1756 2.104
Formulae 2 .02000 .14876 1.000 -.4444 .484
FormulaD 2 1.48000' .14876 .000 1.0156 1.944
FormulaD FormulaA -1.01000' .14876 .000 -1.4744 -.5456
FormulaE -.04000 .14876 1.000 -.5044 .424
Formulae -1.62000' .14876 .000 -2.0844 -1.1556
FormulaA 2 -1.52000' .14876 .000 -1.9844 -1.0556
FormulaE 2 .02000 .14876 1.000 -.4444 .484
Formulae 2 -1.60000' .14876 .000 -2.0644 -1.1356
FormulaD 2 -.14000 .14876 .981 -.6044 .324L
FormulaA 2 FormulaA .51000' .14876 .021 .0456 .974L
FormulaE 1.48000' .14876 .000 1.0156 1.944L
Formulae -.10000 .14876 .997 -.5644 .364
FormulaD 1.52000' .14876 .000 1.0556 1.984
FormulaE 2 1.54000' .14876 .000 1.0756 2.004
Formulae 2 -.08000 .14876 .999 -.5444 .384
FormulaD 2 1.38000' .14876 .000 .9156 1.844
FormulaE 2 FormulaA -1.03000' .14876 .000 -1.4944 -.5656
FormulaE -.06000 .14876 1.000 -.5244 .404
Formulae -1.64000' .14876 .000 -2.1044 -1.1756
FormulaD -.02000 .14876 1.000 -.4844 .444
FormulaA 2 -1.54000' .14876 .000 -2.0044 -1.0756
Formulae 2 -1.62000' .14876 .000 -2.0844 -1.1556
FormulaD 2 -.16000 .14876 .960 -.6244 .304
Formulae 2 FormulaA .59000' .14876 .004 .1256 1.054
FormulaE 1.56000' .14876 .000 1.0956 2.024
Formulae -.02000 .14876 1.000 -.4844 .444
FormulaD 1.60000' .14876 .000 1.1356 2.064
FormulaA 2 .08000 .14876 .999 -.3844 .544
FormulaE 2 1.62000' .14876 .000 1.1556 2.084
FormulaD 2 1.46000' .14876 .000 .9956
ForrnulaD 2 FormulaA -.87000' .14876 .000 -1.3344
FormulaE .10000 .14876 .997 -.3644
Formulae -1.48000' .14876 .000 -1.9444
FormulaD .14000 .14876 .981 -.3244
FormulaA 2 -1.38000' .14876 .000 -1.8444
FormulaE 2 .16000 .14876 .960 -.3044
Formulae 2 -1.46000' .14876 .000 -1.9244
Homogeneous Subsets
Tampilan Visual TukeyHSD'
Subset for alpha~ 0.05
~<ormula N 1 2
~'ormulaB - 2 10 95.4100
~'ormulaD 10 95.4300
~'ormulaB 10 95.4700
IFormulaD 2 - 10 95.5700
IFormulaA 10 96.4400
IF arm ulaA _ 2 10
IFormulaC_2 10
~<ormulaC 10
Sig. .960 1000
Means for groups m homogeneous subsets are displayed. a. Uses Harmmic Mean Sample Size~ 10.000.
1.924
-.4056
.564
-1.0156
.604
-.9156
.624
-.9956
3
LAMPIRANL
HASIL PENILAIAN TAMPILAN VISUALPANELIS TABLET SALUT ENTERIK EKSTRAK WORTEL
Pemeriksaan Visual Panelis I
Pcmerlksaan Visual
Tablet salu t enteri k ekstrak wortel
ama : Apn1ini fmn«rttA
NRP 244~09\l'»
TTD: ~I>
Pet·unjuk Peogi.Jian:
<90 : Pennukaan tablet kasar atau tidak rata
90-95 : Pennukaan tablet agak kasar
95-100 : Pcnnukaan tablet hal us atau rata .atau tidak rctak dan tenuiUp oleh lapisan
pcnyalut
Tablet FonnuJa
ke Bets I Bets 2
FA FB FC FD FA FB FC
I 9> 9'1 ~ 93
9' G4 g,
2 OS 9<1 95 9~ 9l 91 4r
3 9~ gr ~ 94 9$ 9' '~
4 9< 9• 'll ~ 9l 91" ~
5 91 9~ 91 ~ 9l 93 9<
6 91. 9< g, 93 'lt> 93 91
7
"'
94 95 93 9< 93 9•8 91 91 <fo ~ 'l' 9> 9'
9 ~ 9o1 9< ~ '}; 91 9~
10 9~ g; 9~
,
... ~ 94gs-X±SD
.% ~.l ~
•..
41 . • -" · ~ jl.l ~ . ,FD
••
9 4 93
94
94 95 9>
- ~
93 94
j U
~ 1.33 t 1,19 t l,U
IPemeriksaan Visual Panelis II
Pemerikuan Vbual
Tablet salut enterik ekslrak worttl
Nama :
Dtno .
M NRP : '2.'<~ &"1-1 ~ 101TID :~
Petunju k Pengisian :
<90 : Pennukaan tablet k:asar atau tidak nua
90-95 : Pcrmukaan tablet agak kasar
95·100 : Pennukaan tablet halus atau rota a tau tidak retak dan tcrtutup olch lapisan pcnyalut
Tablet Fonnula
kc Bets I Bets 2
FA FB FC FD FA FB FC FD
I ~0 5>
1'
~ ~1 ~ ' ~~ - ~I>2 fj<; ~ 1 ~~ ~~ ~8
,,
~~ 9~3 ~3 9'> ~"l ~ ~'I ,~
"
514 ~"t ~,.. ')& ~( ~6 .lt ')6 ~l
5
~·
'L
3l ~ ~:t ~~ '}!. ~ ":}6 ~~ ~~ ~"t ~L ~~ ~~ 'I! ~t
7 ~~ ~b 'l~
'~ ~~ ~L lj 5-r
8 ~ c; %
~ 1l 'Ji ~~ g) _l1l_
- 9
~"
'\~n
j ~ ~~ ~~,s
1'1"10 ~~ ~~ ,~
~ · \ '
rr
~\ ~~X±SD .9s. ~
Pemeriksaan Visual Panelis III
Pt mtriksaa n Visual T a blrt salut tntt rik tkstrak wortel
Pt lunjuk Pt.nglsl.an:
<90 : Pennukaan tablet kasar a1au tidak rata
90-95 : Permukaan tablet agak kasar
95-100 : Permukaan tablet hal us atau rata 111au tidak retak dan tertutup olch lapisan penyalut
Tablet Fom1ula
kc Bets I Bets 2
FA FB FC FD FA FB F C
I Qs Qs 96 <>s '11 9'- 98
2 9~ 0< tf. qo 9) tf.
·~
F D 9<
91-3 9l 9t '11 I>' ~ Q<' <n 0~
4 ex 9t 9~ 9< Q(, 9t 9t Ql.
5 98 ~ H 0)
••
9t QG o<.6 Qb <){, 9i 941 9< 9<
"'
9~7 9•
"'
g(, 9~ 9G·~
~ Ql.8 QS 9t 9' qo
"'
0) QG q~9 ~ 9t ~ 910 0} Q~ q; 9t
10 'll 9) II' Q) Ol Qb Qs ~
X±SD
~ ·
9SS -"·g ~s . q 'IL :s .9>,g .!/..') ~.3t ~Jo t o.S> 1 ~llJI t l.!o I
-· - ~ )
-
0,31 1 J,J, LPemeriksaan Visual Panelis IV
I
NRP : 2.'{'1 ~<>o:t t<-j' TI D:~
Pctuojuk Pengisian :
Pemeriksaan Visual
Tablet salut enterik ekstrak wortel
<90 : Pennukaan tablet kasar atau 1idak rata
90-95 : Pcnnukaan tablet agak kasar
95-100 : Pennukaan tablet hal us atau rata a tau tidak retnk dan tenutup oleh lapisan pcnyalut
Tablet Fonnula
ke Bets I Bets 2
FA FB FC FD FA FB F C FD
I _silo !N JQ, :JS
n
~~ j''b Jr2 9(, S{. Jq, :ts J?
J'
:JQ,Js-3 97 ~ b :i7 ,y(. .9~ ~~
:n
.964 J'b
.J7 J7 H !l4o ,1/S" 97 J(,
5 :/fo g.r ,96 57 .5-~ Sl.r 5'?
.'17
6 :17 37
:n
:n
9'7 96 (i(, .977 J7 J) J7 5~ 9q, ,76 .J~
!N
8
:t' ,Jb ,91b 9'1 J'<\,
:t•
5'1!.:t/.
9 8'b
'?
.9 ~ :n 8~8• 97 .Jj
10 5 1. ~7 J7 !J'S
j'
J797
••
X ± SD
Pemeriksaan Visual Panelis V
Pem erikJaan Visual
Tablet salut enterik ekstrak wortel
Nama : ,YUL\Ut; 1\oSI"\~Dti
NRP : .l.44 3~14T
TI D : ~
Petunjuk Pengisian :
<90 : Pcm1ukaan tablet kasar atau tidak rata
9()..95 : Pcrmukaan tablet agak kasar
95- 100 : Pcrmukaan table1 hal us atau rata atau tidak retak dan tcr1utup oleh lapisan
pcnyalut
Tablet Formula
ke Bets I Bets 2
FA FB FC FD FA FB FC FD
I 9~ 3S j6
.,,
:Jf Jt 81 .Ji2 9"\ .9~ 9> 9> tH
_q,
.94 .9/, 3 .C\tq' j{, §~ 9' .JI. 91 !1!;
4 qa . ~t 99 g4 .96 ,9/, -'l- ,_9S
5
'I~ Jt 91 9b .9'3
Jr-""
.'ft 6"
9~ 9f ~ 88 JL Bt .4f.7 95 9~ 58
.9' .98 j t 91 .J(
R JS .9~
St-
sr
M .9t8'
!1l9 9'\ ~ ~{ _qr 8f 45" 91 9L
10 g<.
9'
9_<; 9t 5' ,9!.94
.9rX,oSO j,,5
~~.s 9/,L .l>.? .91.5 1>.1 .943 j >, q
t '
• J.J> ~ O,M t l.3J -0,61 t l.o8 t
Pemeriksaan Visual Panelis VI
Pemeri ksaan Visual
Tablet salut euterik ekstrak wo rt el
Nama : 1-1..-ti n u> N RP : ~,'(3oo j 16"1
ITO
:It
Petunjuk Pengisian :
: Pcnnukaan tablet kasar atau tidak rata : Pennukaan tablet agak kasar
<90
90-95
95-100 : Pcm1ukaan tablet hal us atau rata atau tidak rclak dan tertutup oleh lapisan penyalut
Tabler Fonnula
ke Bers I Bcrs2
FA FB FC F D FA FB FC
I fj~
j r !jQ 51 3-' !JS ,1Q
2 .9~
j ' _q)
~' ~a .51 ,111
3 ~l
~1 51 .H ~l
"
514
,,
_,,
~t j1
,s
ss
.515 S1
~'
,,
' 1 S1 5' .51.6 ~, ~\ .'l\
_,,
~' j& ~17
!I'
'J
'1
~·
31 j l'6
FD
3'
.91
';)?
s~
-96 !JS
!IS
8 j \ l))
,,
~ '
,,
!H fl1 I ~9 !)S :1~
.,a
91 .:J3_,,
!li !!110
,,
gSq :J.
' t
s~_,,
a3 ,JX±SD
%.5 jl,.J jjJ 9'.5 ~~ -z. ·~"-; jl,~ .%.1
Pemeriksaan Visual Panelis VII
Pemeriksaau Visual
Tablet salut entcrik ekstra k wortcl
Nama : lolc.'"9C-rel\x;.. I'· ce ... e
NRP TID
Petunjuk Pe ngisian :
<90 : Permukaan tablet kasar atau tidak rata
90-95 : Pcrmukaan tablet agak kasar
95- 100 : Permukaan tablet hal us atau rata atau tidak retak dan tertutup oleh lapisan pcnyalut
Tablet Fonnula
kc Bets I Bets2
FA FB FC FD FA FB F C
I QG
~ 9a 9~ qG ~ 9~
2
~ 9b 91 9(, c;n. ~ qS
3 ')\ 9(; 96 It, ~ 9" 96
4 Q(, 9(. 9(, H Q& Qt ~
5 Q> Qt 9} QG 911 9!- ~
6 q1 9l 96 9> 9<;. 9l Q~
7 Cl8 9~ 91 9r <X ~i
~
8 Qb It 9~
FD
'~'"
<)1:.
~
q'
9"
0)-911
9>
~ 9S" 9b 9C.
9 91. 9) 1{, Q(, \)!;. ()(. k
r---
~10 9!> 91. 9t 1} QfJ ~ CJr
9t-X±SD
j(,.lf Y-..3 5l,l 3 ~ • .9 ~ . a .9L 11l- 3€, 1
l o . ~ l J.U l o,u l J.l3 ! l ,o.- ! 0.18 J •·1.9
Pemeriksaan Visual Panelis VIII
Pemeriksaan Visual
Tablet ulut enterik ekstrak wortel
Nama Pol'l'l NRP N~ilooio'& ~
TID ~
Pctunjuk Penglslan :
<90 : Pcrmukaan tablet kasar atau tidak rata
90-95 : Pennukaan tablet agaJc. kasar
95- 100 : Permukaan tablet halus atau rata atau tidak n:tak dan tertutup olch lapisan pcnyalut
Tablet Fonnula
ke Bets I Beu2
FA FB FC F D FA FB F C
I 9<
..
!!Co y '!S ~· 1>2 ~L
••
'IS ~).,
"
...
3 $1
..
~' !k u,,
••
4
,,
·~ !l<
,,
~ ~ or5
,,
'"
!I<"
...
••
9t6 !I
,,
9f••
'!S,,
"
7 I< .~ ~l
"
"
! ',,
8 B•
••
,,
..
,,
~·
"
9
,,
g, !k,,
"'
••
~10 I• !t-l
·~ ~~
••
,.
~·X± SD
'~ ,) jJ,I- .9(,, 'l'l jH U.) 95. ¥ F D
••
"
,,
,,
••
~
"'
,,
,,
~~
Pemeriksaan Visual Panelis IX
Pemt riksaan VIs ual
T ablet salut ent.erik ekslra k wortel
Nama : <;. ~ tA~(' \\ud.\1:>.<">
NRP : 2A<\,1fl·\ '!:. \ 1.'1!
lTD : 3)1\.
PeiUnjuk Ptngl slan :
<90 : Pcnnukaan tablet kasar atau tidak rata 90-95 : Pennukaan tablet agak kasar
95-100 : Permukaan tablet haJus alau rata atau lidak retak dan tertulup oleh lapisan
penyalut
Tablet F'onnuia
kc Bets I Bets2
FA FB FC FD FA FB FC
I 91 S<; ~ 5S 98 $ Sf.
2 91 ~ ~ ~ :;1 9'. ~t
3
sa
~ ~ 9'- ~ 9b
Sl-4 St 91- 9il ~
91-~ ~
5 91 ?Ia :;-r 9<0 sa ~ ~
6 91! ~ ~ $ 51 9S" 9E
7 98 9S 51- 9 ~ 51- 9S" $
8
·- 9 5I! 9S 91- ~ 91 9b
51-91 ~ 91 ~ 91- 9S
91-10 Sl- $ 9'il '3>
98 '$ ~
X±SD jl . ~ -'5.6 jl,, jS,S'
1!. ~ %5 91S
t 0 51 i ! o,st ! • i D ,Sj i o.sz L o.c;z
150
FD 5>
~
'§
~
sr
9'1-efo
$
""
$""
.,,,8
P emeriksaan Visual Panel is X
P~me:riUu11 V1sua1
T abiet saiut eaurik Wtrak wortd
Nama : 1 punJ 'l\JPI ~.6<-''1
e
·
Pmnjuk Peng131an :
<90 : Pcnnuiaan tabiet kasaT atau tidak rata
90-95 : Pc:nnukaan tablet agak icasar
95-100 : r<:nDUUan IOblet haius azau tala auu lidak m.k dan tatvtup oleh lapisan
penyalut T!!bl• t
ke Bets I
FA FB i'C
I ~8 ")r -'8
~ ~ :X. ~8
3 ~ 9~ ~b
4
'8 q:r ~r-s 98 9S' g~ 6
'"'
tft0j;
7 g~ q)
o/1-8 o/7- 9!"_ ~g
t-- 9
-
,s
'1~ g8
r-w-·
~1- 0/1 ~ . ·X±SD ·
-.91.1 -'>.s -'1.¥
t • 08~ 1o i O.lt!
Formula
FD FA
05" '3~
'31' 9> .
%
93% ~B
9ft q't -~
~ .r '?!?-~r ~8
'3.1 ~'}
~(i, ~8
!?.I 'PB
~S . 6 9t. z.
!-
j tel !.l,oJ Bel• 2 FB "¥" !)(. ~
g.r
~ '3~ 9GJs-gr
~~-~s . ~
W-O.Sl FC ?1-~n 91-~g 9R <r!J ~a 0f-~~ ~8 11S - 0 FD ~S" ~
~
9~9(;, 9C.
9.J
el~ 9{P9r
j S,/,LAMPIRANM
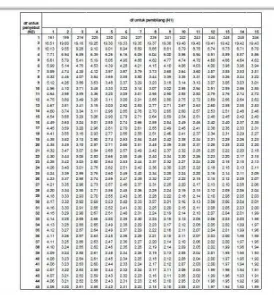
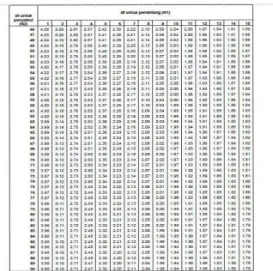
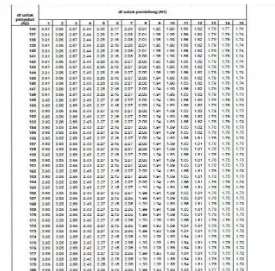
TABEL UJIF
dfU[JtiJII: di' Wit!a paomblllngfN1)
...
~ 1' '
'' '
7 8'
10 II 12"
"