LAMPIRAN A
HASIL PEMERIKSAAN STANDARISASI PARAMETRIK EKSTRAK ROSELLA
A. PEMERIKSAAN ORGANOLEPTIS EKSTRAK ROSELLA
B. HASIL PENENTUAN pH EKSTRAK ROSELLA
C. HASIL PENENTUAN KADAR SARI LARUT AIR EKSTRAK ROSELLA
Replikasi Berat cawan(g)
Berat ekstrak
(g)
Berat konstan % kadar
1 81,1772 5,0039 81,1563 95,89
2 76,2100 5,0038 76,1816 97,44
3 79,3394 5,0015 79,2535 98,96
X
± SD 97,43±1,53Contoh perhitungan standarisasi kadar sari larut air :
Berat cawan sesudah dipanaskan = 81,1563 Berat cawan kosong = 80,1966
Pemeriksaan Ekstrak Rosella
Bentuk Serbuk
Warna Merah Bau Khas rosella
Rasa Asam
Replikasi Ekstrak Rosella
I 3,21 II 3,22 III 3,21
Berat ekstrak = 5,0039/5
= 1,0078
% kadar = berat pemanasan terakhir – berat cawan kosong x 100% Berat ekstrak/5 % kadar = (81,1563 – 80,1966) x100%
1,0078 = 95,89%
D. HASIL PENENTUAN KADAR SARI LARUT ETANOL EKSTRAK ROSELLA
Replikasi Berat cawan(g)
Berat ekstrak
(g)
Berat konstan
% kadar
1 57,8016 5,0026 57,7713 29,25
2 41,3881 5,0034 41,3819 29,73
3 72,9216 5,0015 72,6671 29,72
X
± SD 29,57±0,27Contoh perhitungan standarisasi kadar sari larut etanol :
Berat cawan sesudah dipanaskan = 57,7713 Berat cawan kosong = 57,4786
Berat ekstrak = 5,0026/5
= 1,00052
% kadar = berat pemanasan terakhir – berat cawan kosong x 100% Berat ekstrak/5 % kadar = (57,7713 – 57,4786) x100%
LAMPIRAN B
HASIL PEMERIKSAAN STANDARISASI NON PARAMETRIK EKSTRAK ROSELLA
A. HASIL PENENTUAN KADAR ABU TOTAL EKSTRAK ROSELLA
Rep Berat krus
(g)
Berat ekstrak
(g)
Berat krus+abu konstan (g)
% kadar
I 36,3608 2,5042 36,4647 4,14 II 35,1912 2,5102 35,2952 4,14 III 23,3239 2,5042 23,4260 4,08
X
± SD 4,12±0,01Contoh Perhitungan standarisasi kadar abu total :
% kadar = berat abu konstan – berat kurs x 100% Berat ekstrak % kadar = 36,4647 – 36,3608 x 100%
2,5042 = 4,14
B. HASIL PENETAPAN KADAR ABU TIDAK LARUT ASAM EKSTRAK ROSELLA
Replikasi
Berat krus (g)
Berat krus+abu konstan (g)
Berat abu+HCl
konstan (g) % kadar
I 23,4802 36,2526 22,2886 9,32
II 24,8618 34,3136 23,8586 10,61
III 23,4920 36,2626 23,32324 9,15
Contoh Perhitungan standarisasi kadar abu tidak larut asam:
% kadar = berat abu setelah penambahan HCl x 100%
Berat abu total – berat kurs % kadar = 22,2886 – 23,4802 x 100%
36, 2526 – 23,4802
= 9,32%
C. HASIL PENETAPAN KADAR ABU LARUT AIR EKSTRAK ROSELLA
Contoh Perhitungan standarisasi kadar abu larut air :
% kadar = berat abu setelah penambahan Aquadest x 100% Berat abu total – berat kurs
% kadar = 23,4740 – 22,2703 x 100%
36,2731 – 22,2705
= 8,59%
D. HASIL PENENTUAN KADAR AIR
Contoh Perhitungan standarisasi kadar air :
% kadar = berat ekstrak – berat ekstrak konstan x 100% Berat ekstrak % kadar = 10,0042 – 9,9974 x 100%
10,0042
= 0,06%
E. HASIL PENENTUAN SUSUT PENGERINGAN
Replikasi Ekstrak kering rosella
LAMPIRAN C
HASIL ANOVA SATU ARAH UJI MUTU FISIK PENYALUT
A. VISKOSITAS
formula (J) formula
Mean Difference
(I-J)
Std.
Error Sig.
95% Confidence Interval
Lower Bound
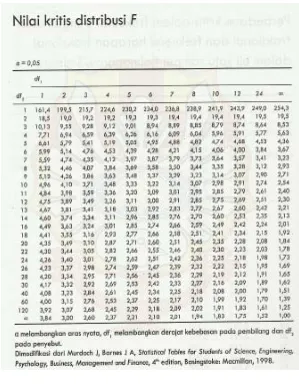
Karena F hitung = 249,635 > F tabel 0,05(3,8) = 4,07; maka H0 ditolak dan ada
perbedaan yang bermakna antar formula viskositas penyalut Tukey HSD
formula N
Subset for alpha = 0.05
1 2 3
Formula B 3 24.1333
Formula A 3 24.6333 24.6333
Formula c 3 25.4000
Formula D 3 33.1667
Sig. .580 .260 1.000
B. BERAT JENIS
ANOVA berat jenis
Sum of
Squares df
Mean
Square F Sig.
Between Groups .003 3 .001 1.209E3 .000
Within Groups .000 8 .000
Multiple Comparisons berat jenis
Tukey HSD
(I) formula
(J) formula
Mean Difference
(I-J) Std. Error Sig.
95% Confidence Interval
Lower Bound
Upper Bound
formula A formula B -.0202000* .0007157 .000 -.022492 -.017908
formula C .0005000 .0007157 .895 -.001792 .002792
formula D .0228667* .0007157 .000 .020575 .025159
formula B formula A .0202000* .0007157 .000 .017908 .022492 formula C .0207000* .0007157 .000 .018408 .022992
formula D .0430667* .0007157 .000 .040775 .045359 formula C formula A -.0005000 .0007157 .895 -.002792 .001792
formula B -.0207000* .0007157 .000 -.022992 -.018408 formula D .0223667* .0007157 .000 .020075 .024659
formula D formula A -.0228667* .0007157 .000 -.025159 -.020575 formula B -.0430667* .0007157 .000 -.045359 -.040775
formula C -.0223667* .0007157 .000 -.024659 -.020075
*. The mean difference is significant at the 0.05 level.
Karena F hitung = 0,0012 < F tabel 0,05(3,8) = 4,07; maka H0 diterima dan tidak ada
berat jenis Tukey HSD
formula N
Subset for alpha = 0.05
1 2 3
formula D 3 1.011433E0
formula C 3 1.033800E0
formula A 3 1.034300E0
formula B 3 1.054500E0
Sig. 1.000 .895 1.000
Means for groups in homogeneous subsets are displayed.
C. UJI pH LARUTAN PENYALUT
NOVA pH
Sum of
Squares df
Mean
Square F Sig.
Between Groups .091 3 .030 23.242 .000
Within Groups .010 8 .001
Multiple Comparisons pH
Tukey HSD
(I) formula
(J) formula
Mean Difference
(I-J) Std. Error Sig.
95% Confidence Interval
Lower Bound
Upper Bound
formula A formula B .14333* .02953 .006 .0488 .2379
formula C -.04000 .02953 .558 -.1346 .0546
formula D .16000* .02953 .003 .0654 .2546 formula B formula A -.14333* .02953 .006 -.2379 -.0488
formula C -.18333* .02953 .001 -.2779 -.0888 formula D .01667 .02953 .940 -.0779 .1112
formula C formula A .04000 .02953 .558 -.0546 .1346 formula B .18333* .02953 .001 .0888 .2779
formula D .20000* .02953 .001 .1054 .2946 formula D formula A -.16000* .02953 .003 -.2546 -.0654
formula B -.01667 .02953 .940 -.1112 .0779 formula C -.20000* .02953 .001 -.2946 -.1054 *. The mean difference is significant at the 0.05 level.
Karena F hitung = 23,242 >F tabel 0,05(3,8) = 4,07; maka H0 ditolak dan ada
pH Tukey HSD
formula N Subset for alpha = 0.05
1 2
formula D 3 3.5000
formula B 3 3.5167
formula A 3 3.6600
formula C 3 3.7000
Sig. .940 .55 8
LAMPIRAN D
HASIL UJI STATISTIK ANTAR BETS FORMULA TABLET SALUT ENTERIK EKSTRAK KELOPAK ROSELLA
A. KESERAGAMAN BOBOT
Formula A
Paired Samples Test Paired Differences
t df
Sig. (2-tailed) Mean
Std. Deviation
Std. Error Mean
95% Confidence Interval of the
Difference
Lower Upper
Pair 1
Formula A - Formula A
.09000 .11314 .08000 -.92650 1.10650 1.125 1 .463
Hipotesa pengujian :
Formula B Interval of the
Difference
Hipotesa pengujian :
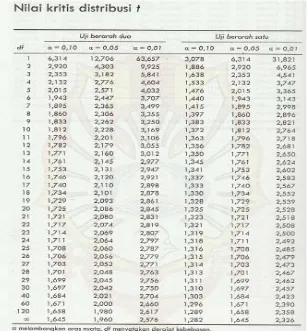
T hitung < T tabel (0,05) sehingga tidak ada perbedaan yang bermakna antar bets.
Formula C
Hipotesa pengujian :
T hitung < T tabel (0,05) sehingga tidak ada perbedaan yang bermakna antar bets. Interval of the
Formula D
Interval of theDifference
Hipotesa pengujian :
T hitung < T tabel (0,05) sehingga tidak ada perbedaan yang bermakna antar bets.
B.
WAKTU HANCUR
Formula A
Hipotesa pengujian :
T hitung < T tabel (0,05) sehingga tidak ada perbedaan yang bermakna antar bets. Interval of the
Formula B
Hipotesa pengujian :
T hitung < T tabel (0,05) sehingga tidak ada perbedaan yang bermakna antar bets.
Formula C
Hipotesa pengujian :
T hitung < T tabel (0,05) sehingga tidak ada perbedaan yang bermakna antar bets. Interval of the
Difference Interval of the
Difference
-3.71333 5.08235 2.93429 -16.33858 8.9119 1
Formula D
Hipotesa pengujian :
T hitung < T tabel (0,05) sehingga tidak ada perbedaan yang bermakna antar bets.
C.
KEKERASAN
Formula A
Hipotesa pengujian :
T hitung < T tabel (0,05) sehingga tidak ada perbedaan yang bermakna antar bets. Interval of the
Difference
95% Confidence Interval of the Difference
Lower Upper
Pair 1 Formula A - Formula A
Formula B
Hipotesa pengujian :
T hitung < T tabel (0,05) sehingga tidak ada perbedaan yang bermakna antar bets
Hipotesa pengujian :
T hitung < T tabel (0,05) sehingga tidak ada perbedaan yang bermakna antar bets Interval of the
Difference Interval of the
Formula D Interval of the
Difference
Hipotesa pengujian :
T hitung < T tabel (0,05) sehingga tidak ada perbedaan yang bermakna antar bets
D. TAMPILAN VISUAL
Formula A
Hipotesa pengujian :
T hitung < T tabel (0,05) sehingga tidak ada perbedaan yang bermakna antar bets. Interval of the
Formula B
Hipotesa pengujian :
T hitung < T tabel (0,05) sehingga tidak ada perbedaan yang bermakna antar beta
Hipotesa pengujian :
T hitung < T tabel (0,05) sehingga tidak ada perbedaan yang bermakna antar bets Interval of the
Difference Interval of the
Formula D
Paired Samples Test
Paired Differences
t df
Sig. (2-tailed) Mean
Std. Deviation
Std. Error Mean
95% Confidence Interval of the
Difference
Lower Upper
Pair 1 Formula D - Formula D
.33333 1.15470 .66667 -2.53510 3.20177 .500 2 .667
Hipotesa pengujian :
LAMPIRAN E
HASIL ANOVA SATU ARAH UJI TABLET SALUT ENTERIK EKSTRAK KELOPAK BUNGA ROSELLA
A. KESERAGAMAN BOBOT
ANOVA
keseragaman bobot
Sum of
Squares df Mean Square F Sig.
Between Groups .028 3 .009 2.718 .179
Within Groups .014 4 .003
Total .042 7
Tukey HSD
(I) formula (J) formula
Mean Difference
(I-J)
Std. Error Sig.
95% Confidence Interval
Lower Bound Upper Bound
Formula A Formula B .16500 .05884 .149 -.0745 .4045
Formula C .07500 .05884 .621 -.1645 .3145
Fotmula D .10500 .05884 .395 -.1345 .3445 Formula B Formula A -.16500 .05884 .149 -.4045 .0745 Formula C -.09000 .05884 .500 -.3295 .1495 Fotmula D -.06000 .05884 .749 -.2995 .1795 Formula C Formula A -.07500 .05884 .621 -.3145 .1645 Formula B .09000 .05884 .500 -.1495 .3295 Fotmula D .03000 .05884 .952 -.2095 .2695 Fotmula D Formula A -.10500 .05884 .395 -.3445 .1345 Formula B .06000 .05884 .749 -.1795 .2995 Formula C -.03000 .05884 .952 -.2695 .2095
Karena F hitung = 2,718 < F tabel 0,05(3,4) = 6,59; maka H0 diterima dan tidak
B. TAMPILAN VISUAL
Uji tampilan visual tablet salut enterik
ANOVA
Sum of Squares df
Mean
Square F Sig. Between Groups 4.119 3 1.373 9.904 .025 Within Groups .554 4 .139
Total 4.673 7
Tukey HSD
(I) formula
(J) formula
Mean Differenc
e (I-J) Std. Error Sig.
95% Confidence Interval
Lower Bound Upper Bound
formula a formula b 1.17000 .37232 .109 -.3457 2.6857
formula c -.66500 .37232 .395 -2.1807 .8507
formula d .83500 .37232 .255 -.6807 2.3507 formula b formula a -1.17000 .37232 .109 -2.6857 .3457 formula c -1.83500* .37232 .026 -3.3507 -.3193 formula d -.33500 .37232 .807 -1.8507 1.1807 formula c formula a .66500 .37232 .395 -.8507 2.1807 formula b 1.83500* .37232 .026 .3193 3.3507 formula d 1.50000 .37232 .052 -.0157 3.0157 formula d formula a -.83500 .37232 .255 -2.3507 .6807 formula b .33500 .37232 .807 -1.1807 1.8507 formula c -1.50000 .37232 .052 -3.0157 .0157 *. The mean difference is significant at the 0.05 level.
Karena F hitung = 9,904 >F tabel 0,05(3,4) = 6,59; maka H0 ditolak dan ada
C. KEKERASAN
ANOVA
Sum of
Squares df Mean Square F Sig. Between Groups 1.430 3 .477 88.045 .000 Within Groups .022 4 .005
Total 1.451 7 Tukey HSD
formula N
Subset for alpha = 0.05
1 2
formula b 2 97.1650
formula d 2 97.5000 97.5000 formula a 2 98.3350 98.3350
formula c 2 99.0000
Sig. .109 .052
Tukey HSD
(I) formula
(J) formula
Mean Differenc
e (I-J) Std. Error Sig.
95% Confidence Interval
Lower Bound Upper Bound
formula a formula b -.42000* .07357 .016 -.7195 -.1205 formula c .71000* .07357 .002 .4105 1.0095 formula d .38500* .07357 .022 .0855 .6845 formula b formula a .42000* .07357 .016 .1205 .7195 formula c 1.13000* .07357 .000 .8305 1.4295 formula d .80500* .07357 .001 .5055 1.1045 formula c formula a -.71000* .07357 .002 -1.0095 -.4105 formula b -1.13000* .07357 .000 -1.4295 -.8305 formula d -.32500* .07357 .038 -.6245 -.0255 formula d formula a -.38500* .07357 .022 -.6845 -.0855 formula b -.80500* .07357 .001 -1.1045 -.5055 formula c .32500* .07357 .038 .0255 .6245 *. The mean difference is significant at the 0.05 level.
Karena F hitung = 88,045 > F tabel 0,05(3,7) = 4,35; maka H0 ditolak dan ada
perbedaan yang bermakna antar formula
Tukey HSD
formula N
Subset for alpha = 0.05
1 2 3 4
formula c 2 6.9000
formula d 2 7.2250
formula a 2 7.6100
formula b 2 8.0300
Sig. 1.000 1.000 1.000 1.000
D. WAKTU HANCUR
ANOVA
X1 Sum of
Squares df Mean Square F Sig. Between Groups 85.257 3 28.419 5.927 .059 Within Groups 19.179 4 4.795
Total 104.436 7
Tukey HSD
(I) formula
(J) formula
Mean Difference
(I-J) Std. Error Sig.
95% Confidence Interval
Lower Bound Upper Bound
formula a formula b -4.09500 2.18971 .365 -13.0090 4.8190
formula c 5.07500 2.18971 .237 -3.8390 13.9890
formula d -.42500 2.18971 .997 -9.3390 8.4890 formula b formula a 4.09500 2.18971 .365 -4.8190 13.0090 formula c 9.17000* 2.18971 .046 .2560 18.0840 formula d 3.67000 2.18971 .438 -5.2440 12.5840 formula c formula a -5.07500 2.18971 .237 -13.9890 3.8390 formula b -9.17000* 2.18971 .046 -18.0840 -.2560 formula d -5.50000 2.18971 .197 -14.4140 3.4140 formula d formula a .42500 2.18971 .997 -8.4890 9.3390 formula b -3.67000 2.18971 .438 -12.5840 5.2440 formula c 5.50000 2.18971 .197 -3.4140 14.4140
Karena F hitung = 5,927 > F tabel 0,05(3,7) = 4,35; maka H0 ditolak dan ada
Tukey HSD
formula N
Subset for alpha = 0.05
1 2
formula b 2 4.8650
formula d 2 9.9400 9.9400 formula a 2 10.3650 10.3650
formula c 2 14.0350
Sig. .197 .365
139
LAMPIRAN F
HASIL ANOVA SATU ARAH UJI WAKTU HANCUR PADA PROGRAM DESIGN EXPERT
Response 1 waktu hancur
ANOVA for selected factorial model
Analysis of variance table [Partial sum of squares - Type III]
Sum of Mean F p-value
Source Squares df Square Value Prob > F
Model109.95 3 36.65 204.16 < 0.0001 significant
A-HPMCP 84.11 1 84.11 468.52 < 0.0001
B-Gliserol 14.42 1 14.42 80.31 0.0009
AB11.42 1 11.42 63.64 0.0013
Pure Error 0.72 4 0.18
Cor Total 110.67 7
The Model F-value of 204.16 implies the model is significant. There is only a 0.01% chance that a "Model F-Value" this large could occur due to noise.
Values of "Prob > F" less than 0.0500 indicate model terms are significant. In this case A, B, AB are significant model terms.
Values greater than 0.1000 indicate the model terms are not significant.
140
Std. Dev. 0.42 R-Squared 0.9935
Mean10.65 Adj R-Squared 0.9886
C.V. % 3.98 Pred R-Squared 0.9740
PRESS 2.87 Adeq Precision 30.607
The "Pred R-Squared" of 0.9740 is in reasonable agreement with the "Adj R-Squared" of 0.9886.
"Adeq Precision" measures the signal to noise ratio. A ratio greater than 4 is desirable. Your ratio of 30.607 indicates an adequate signal. This model can be used to navigate the design space.
Coefficient Standard 95% CI 95% CI
FactorEstimate df Error Low High VIF
Intercept 10.65 1 0.15 10.23 11.06
A-HPMCP 3.24 1 0.15 2.83 3.66
1.00
B-Gliserol -1.34 1 0.15 -1.76 -0.93 1.00
AB1.19 1 0.15 0.78 1.61 1.00
Final Equation in Terms of Coded Factors:
waktu hancur =
+10.65
141
-1.34 * B
+1.19 * A * B
Final Equation in Terms of Actual Factors:
waktu hancur =
+10.64500
+3.24250 * HPMCP
-1.34250 * Gliserol
+1.19500 * HPMCP * Gliserol
The Diagnostics Case Statistics Report has been moved to the Diagnostics Node. In the Diagnostics Node, Select Case Statistics from the View Menu.
Proceed to Diagnostic Plots (the next icon in progression). Be sure to look at the:
1) Normal probability plot of the studentized residuals to check for normality of residuals. 2) Studentized residuals versus predicted values to check for constant error.
3) Externally Studentized Residuals to look for outliers, i.e., influential values. 4) Box-Cox plot for power transformations.
142
LAMPIRAN G
HASIL ANOVA SATU ARAH UJI KEKERASAN PADA PROGRAM DESIGN EXPERT
Response 2 kekerasan
ANOVA for selected factorial model
Analysis of variance table [Partial sum of squares - Type III]
Sum of Mean F p-value
Source Squares df Square Value Prob > F
Model1.43 3 0.48 88.05 0.0004 significant
A-HPMCP 0.28 1 0.28 51.27 0.0020
B-Gliserol 1.15 1 1.15 212.03 0.0001
AB4.512E-003 1 4.512E-003 0.83 0.4129
Pure Error 0.022 4 5.412E-003
Cor Total 1.45 7
The Model F-value of 88.05 implies the model is significant. There is only a 0.04% chance that a "Model F-Value" this large could occur due to noise.
Values of "Prob > F" less than 0.0500 indicate model terms are significant. In this case A, B are significant model terms.
Values greater than 0.1000 indicate the model terms are not significant.
143
Std. Dev. 0.074 R-Squared 0.9851
Mean7.44 Adj R-Squared 0.9739
C.V. % 0.99 Pred R-Squared 0.9403
PRESS 0.087 Adeq Precision 21.722
The "Pred R-Squared" of 0.9403 is in reasonable agreement with the "Adj R-Squared" of 0.9739.
"Adeq Precision" measures the signal to noise ratio. A ratio greater than 4 is desirable. Your ratio of 21.722 indicates an adequate signal. This model can be used to navigate the design space.
Coefficient Standard 95% CI 95% CI
FactorEstimate df Error Low High VIF
Intercept 7.44 1 0.026 7.37 7.51
A-HPMCP 0.19 1 0.026 0.11 0.26
1.00
B-Gliserol -0.38 1 0.026 -0.45 -0.31 1.00
AB-0.024 1 0.026 -0.096 0.048 1.00
Final Equation in Terms of Coded Factors:
kekerasan =
+7.44
144
-0.38 * B
-0.024 * A * B
Final Equation in Terms of Actual Factors:
kekerasan =
+7.44125
+0.18625 * HPMCP
-0.37875 * Gliserol
-0.023750 * HPMCP * Gliserol
The Diagnostics Case Statistics Report has been moved to the Diagnostics Node. In the Diagnostics Node, Select Case Statistics from the View Menu.
Proceed to Diagnostic Plots (the next icon in progression). Be sure to look at the:
1) Normal probability plot of the studentized residuals to check for normality of residuals. 2) Studentized residuals versus predicted values to check for constant error.
3) Externally Studentized Residuals to look for outliers, i.e., influential values. 4) Box-Cox plot for power transformations.
145
LAMPIRAN H
HASIL ANOVA SATU ARAH UJI KESERAGAMAN BOBOT PADA PROGRAM DESIGN EXPERT
Response 3 keseragaman bobot
ANOVA for selected factorial model
Analysis of variance table [Partial sum of squares - Type III]
Sum of Mean F p-value
Source Squares df Square Value Prob > F
Model0.028 3 9.412E-003 2.72 0.1792 not significant
A-HPMCP 0.019 1 0.019 5.49 0.0791
B-Gliserol 1.125E-004 1 1.125E-004 0.032 0.8657
AB9.113E-003 1 9.113E-003 2.63 0.1801
Pure Error 0.014 4 3.463E-003
Cor Total 0.042 7
The "Model F-value" of 2.72 implies the model is not significant relative to the noise. There is a 17.92 % chance that a "Model F-value" this large could occur due to noise.
Values of "Prob > F" less than 0.0500 indicate model terms are significant. In this case there are no significant model terms.
Values greater than 0.1000 indicate the model terms are not significant.
146
Std. Dev. 0.059 R-Squared 0.6709
Mean312.15 Adj R-Squared 0.4241
C.V. % 0.019 Pred R-Squared -0.3163
PRESS 0.055 Adeq Precision 3.966
A negative "Pred R-Squared" implies that the overall mean is a better predictor of your response than the current model.
"Adeq Precision" measures the signal to noise ratio. A ratio of 3.97 indicates an inadequate signal and we should not use this model to navigate the design space.
Coefficient Standard 95% CI 95% CI
FactorEstimate df Error Low High VIF
Intercept 312.15 1 0.021 312.09 312.21 A-HPMCP -0.049 1 0.021 -0.11 9.012E-003 1.00
B-Gliserol -3.750E-003 1 0.021 -0.062 0.054 1.00
AB0.034 1 0.021 -0.024 0.092 1.00
Final Equation in Terms of Coded Factors:
keseragaman bobot = +312.15
147
-3.750E-003 * B
+0.034 * A * B
Final Equation in Terms of Actual Factors:
keseragaman bobot =
+312.14875
-0.048750 * HPMCP
-3.75000E-003 * Gliserol
+0.033750 * HPMCP * Gliserol
The Diagnostics Case Statistics Report has been moved to the Diagnostics Node. In the Diagnostics Node, Select Case Statistics from the View Menu.
Proceed to Diagnostic Plots (the next icon in progression). Be sure to look at the:
1) Normal probability plot of the studentized residuals to check for normality of residuals. 2) Studentized residuals versus predicted values to check for constant error.
3) Externally Studentized Residuals to look for outliers, i.e., influential values. 4) Box-Cox plot for power transformations.
148
LAMPIRAN I
HASIL ANOVA SATU ARAH UJI TAMPILAN VISUAL PADA PROGRAM DESIGN EXPERT
Response 4 visual
ANOVA for selected factorial model
Analysis of variance table [Partial sum of squares - Type III]
Sum of Mean F p-value
Source Squares df Square Value Prob > F
Model4.12 3 1.37 9.90 0.0253 significant
A-HPMCP 3.56 1 3.56 25.71 0.0071
B-Gliserol 0.50 1 0.50 3.61 0.1304
AB0.054 1 0.054 0.39 0.5648
Pure Error 0.55 4 0.14
Cor Total 4.67 7
The Model F-value of 9.90 implies the model is significant. There is only a 2.53% chance that a "Model F-Value" this large could occur due to noise.
Values of "Prob > F" less than 0.0500 indicate model terms are significant. In this case A are significant model terms.
Values greater than 0.1000 indicate the model terms are not significant.
149
Std. Dev. 0.37 R-Squared 0.8813
Mean98.00 Adj R-Squared 0.7924
C.V. % 0.38 Pred R-Squared 0.5254
PRESS 2.22 Adeq Precision 6.970
The "Pred R-Squared" of 0.5254 is not as close to the "Adj R-Squared" of 0.7924 as one might normally expect. This may indicate a large block effect or a possible problem with your model and/or data. Things to consider are model reduction, response transformation, outliers, etc.
"Adeq Precision" measures the signal to noise ratio. A ratio greater than 4 is desirable. Your ratio of 6.970 indicates an adequate signal. This model can be used to navigate the design space.
Coefficient Standard 95% CI 95% CI
FactorEstimate df Error Low High VIF
Intercept 98.00 1 0.13 97.63 98.37
A-HPMCP -0.67 1 0.13 -1.03 -0.30
1.00
B-Gliserol 0.25 1 0.13 -0.12 0.62
1.00
AB-0.082 1 0.13 -0.45 0.28 1.00
Final Equation in Terms of Coded Factors:
visual =
150
+0.25 * B
-0.082 * A * B
Final Equation in Terms of Actual Factors:
visual =
+98.00000
-0.66750 * HPMCP
+0.25000 * Gliserol
-0.082500 * HPMCP * Gliserol
The Diagnostics Case Statistics Report has been moved to the Diagnostics Node. In the Diagnostics Node, Select Case Statistics from the View Menu.
Proceed to Diagnostic Plots (the next icon in progression). Be sure to look at the:
1) Normal probability plot of the studentized residuals to check for normality of residuals. 2) Studentized residuals versus predicted values to check for constant error.
3) Externally Studentized Residuals to look for outliers, i.e., influential values. 4) Box-Cox plot for power transformations.
151
LAMPIRAN J
RANGKUMAN HASIL PREDIKSI BERDASARKAN PROGRAM DESIGN EXPERT
Number HPMCP gliserol waktu hancur kekerasan keseragaman bobot tampilan visual
152
LAMPIRAN K
CONTOH PERHITUNGAN BAHAN PENYALUT
- Jumlah tablet inti = 900 tablet - W total tablet inti = 265,7 gram
- W HPMCP (dengan pertambahan bobot 4%) = 4/100 x 265,7 = 10,628 gram
- Vol pelarut campuran dengan konsentrasi HPMCP 9,75% = 100/9,75 x 10,628 = 109,0051 ml
- Jumlah plastisaiser = 0,52/200 x 10,628 = 0,0553 gram - BJ plastisaiser = 1,26 g/ml
- Volume plastisaiVHU PO O - Jumlah talk (4%) = 4/100 x 10,628 = 0,4251 gram
- % pelarut campuran = 109,0051 – (10,628 +0,0553 + 0,4251) = 97,8967 ml
Maka untuk 900 tablet dibutuhkan HPMCP sebanyak 10,628 gram, Gliserol
153
LAMPIRAN L
CONTOH PERHITUNGAN KONVERSI DOSIS EKSTRAK KELOPAK BUNGA ROSELLA
Perbandingan ekstrak jadi natura : pengisi (7 : 1)
Dosis acuan 250 mg ekstrak terstandarisasi (Hudson, 2011). Berat tablet 300 mg
Perhitungan konversi : 8/7 x 150 = 171,42 mg
Jadi berat ekstrak dari PT. Natura Laboratoria yang harus ditimbang untuk jumlah per tablet yaitu
154
LAMPIRAN M
155
LAMPIRAN N
156
LAMPIRAN O
157
LAMPIRAN P