India 2017
Acronyms
AD Auto disable
AEFI Adverse events following immunization
AFP Acute flaccid paralysis
BCG Bacillus Calmette-Guérin vaccine
CES Coverage evaluation survey
cMYP Comprehensive multi-year plan
CRS Congenital rubella syndrome
DHS Demographic health survey
DT Diphtheria tetanus toxoid, pediatric
DTP Diphtheria – tetanus – pertussis vaccine
DTP-Hib-HepB Pentavalent vaccine
DTP-Hib-HepB3 3rd dose pentavalent vaccine
EPI Expanded programme on immunization
GDP Gross domestic product
HCW Health care worker
HepB Hepatitis B vaccine
Hib Haemophilus influenzae type b
HPV Human papilloma virus
IgM Immunoglobulin M
IPV Inactivated poliovirus vaccine
JE Japanese encephalitis
JE_Live-Atd JE live attenuated vaccine
JRF WHO UNICEF joint reporting form
LB Live birth
M Measles
MCV1 First dose measles containing vaccine
MCV2 Second dose measles containing vaccine
MICS Multiple indicator cluster survey
MMR Measles mumps rubella vaccine
MNT Maternal and neonatal tetanus
MR Measles rubella vaccine
NCIP National committee on immunization practices
NID National immunization day
NTAGI National technical advisory group on immunization
NPEV Non-polio enterovirus
NT Neonatal tetanus
OPV Oral poliovirus vaccine
bOPV Bivalent OPV
tOPV Trivalent OPV
PCV Pneumococcal conjugate vaccine
SEAR WHO South-East Asia Region
SIA Supplementary immunization activities
SNID Subnational immunization day
Td Tetanus diphtheria toxoid; older children, adults
TT Tetanus toxoid
TT2+ 2 or more doses TT
VDPV Vaccine derived poliovirus
VPD Vaccine preventable diseases
WCBA Women of child bearing age
Contents
Impact of rouine immunizaion
Page
No.
EPI history 5
Basic informaion 2016 Table 1 5
Immunizaion schedule 2016 Table 2 5
Naional immunizaion coverage 1980 - 2016 Figure 1 6
Immunizaion system highlights Table 3 6
DTP3 coverage, diphtheria and pertussis cases 1980 - 2016 Figure 2 7 Reported cases of vaccine preventable diseases 2011 - 2016 Table 4 7
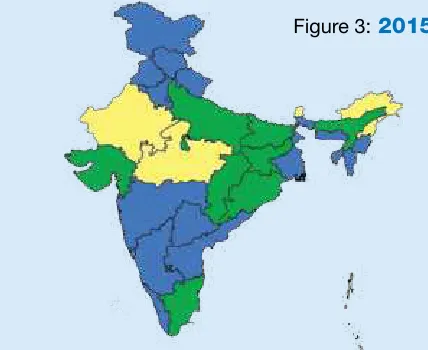
DTP-Hib-HepB3 coverage by state 2015 Figure 3 7
DTP-Hib-HepB3 coverage by state 2016 Figure 4 7
Towards measles eliminaion and rubella/congenital rubella
syndrome control
Page
No.
MCV1 and MCV2 coverage, measles and rubella cases, 1980-2016 Figure 11 11
MCV supplementary immunizaion aciviies Table 7 11
MCV1 coverage by state 2015 Figure 12 12
MCV1 coverage by state 2016 Figure 13 12
MCV2 coverage by state 2015 Figure 14 12
MCV1 coverage by state 2016 Figure 15 12
Immunity against measles – immunity proile by age in 2016 Figure 16 12 Subnaional risk assessment for measles and rubella Figure 17 12 Sporadic and outbreak associated measles cases by month 2011 - 2016 Figure 18 13 Immunizaion status of conirmed (laboratory and EPI linked) measles outbreak
associated cases by age 2011 – 2016 Figure 19 13
Quality of ield and laboratory surveillance for measles and rubella 2012 - 2016 Table 8 14 Performance of laboratory surveillance 2012 - 2016 Table 9 14 Network of WHO supported surveillance medical oicers and laboratories for
VPD surveillance Figure 20 15
Maternal and neonatal tetanus eliminaion is sustained
Page
No.
TT2+ coverage and NT cases 1980 - 2016 Figure 5 8
Polio-free status is maintained
Page
No.
AFP surveillance indicators 2011 - 2016 Table 5 9
Non-polio AFP rate by district 2015 Figure 6 9
Non-polio AFP rate by district 2016 Figure 7 9
Environmental surveillance sites for polio detecion Figure 8 10 Adequate stool specimen collecion percentage by district 2015 Figure 9 10 Adequate stool specimen collecion percentage by district 2016 Figure 10 10
WHO South-East Asia Region
EPI history
• EPI launched in 1978 with DPT, OPV, BCG and typhoid vaccines
• TT immunizaion of pregnant women introduced in 1983
• MCV introduced in 1985
• HepB piloted in 2002 and made universal in 2011
• MCV2 introduced 2010 onward
• Pentavalent (introduced in two states in 2011 and gradually expanded to all states by 2015
• Two doses of JE (9-12 months and 16-24 months) introduced in 2013 in endemic districts
• Muli-dose vial policy for vaccines introduced in 2013
• IPV introduced in six states in 2015 and expanded to all states in 2016
• Naionwide fIPV introduced in phase manner between April 2016 to June 2017
• Rotavirus vaccine introduced in four states in 2016
• tOPV to bOPV switched on 25 April 2016.
Source: cMYP 2013-2017 and EPI/MoHFW
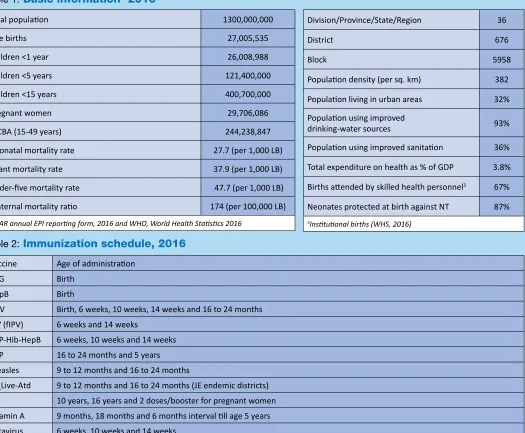
Table 1:
Basic information
12016
Total populaion 1300,000,000
Live births 27,005,535
Children <1 year 26,008,988
Children <5 years 121,400,000
Children <15 years 400,700,000
Pregnant women 29,706,086
WCBA (15-49 years) 244,238,847
Neonatal mortality rate 27.7 (per 1,000 LB)
Infant mortality rate 37.9 (per 1,000 LB)
Under-ive mortality rate 47.7 (per 1,000 LB)
Maternal mortality raio 174 (per 100,000 LB)
1SEAR annual EPI reporing form, 2016 and WHO, World Health Staisics 2016
Division/Province/State/Region 36
District 676
Block 5958
Populaion density (per sq. km) 382
Populaion living in urban areas 32% Populaion using improved
drinking-water sources 93%
Populaion using improved sanitaion 36%
Total expenditure on health as % of GDP 3.8%
Births atended by skilled health personnel3 67%
Neonates protected at birth against NT 87%
3Insituional births (WHS, 2016)
Table 2:
Immunization schedule, 2016
Vaccine Age of administraion
BCG Birth
HepB Birth
OPV Birth, 6 weeks, 10 weeks, 14 weeks and 16 to 24 months IPV (fIPV) 6 weeks and 14 weeks
DTP-Hib-HepB 6 weeks, 10 weeks and 14 weeks
DTP 16 to 24 months and 5 years
Measles 9 to 12 months and 16 to 24 months
JE_Live-Atd 9 to 12 months and 16 to 24 months (JE endemic districts)
TT 10 years, 16 years and 2 doses/booster for pregnant women
Vitamin A 9 months, 18 months and 6 months interval ill age 5 years
Rotavirus 6 weeks, 10 weeks and 14 weeks Source: WHO/UNICEF JRF, 2016
Figure 1:
National immunization coverage, 1980-2016
Source: WHO/UNICEF esimates of naional immunizaion coverage, July 2017 revision
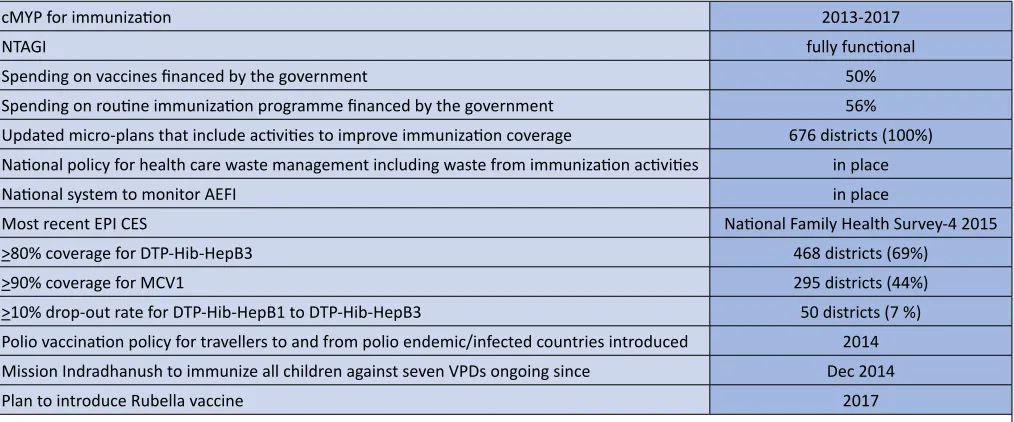
Table 3:
Immunization system highlights
cMYP for immunizaion 2013-2017
NTAGI fully funcional
Spending on vaccines inanced by the government 50%
Spending on rouine immunizaion programme inanced by the government 56% Updated micro-plans that include aciviies to improve immunizaion coverage 676 districts (100%) Naional policy for health care waste management including waste from immunizaion aciviies in place
Naional system to monitor AEFI in place
Most recent EPI CES Naional Family Health Survey-4 2015
>80% coverage for DTP-Hib-HepB3 468 districts (69%)
>90% coverage for MCV1 295 districts (44%)
>10% drop-out rate for DTP-Hib-HepB1 to DTP-Hib-HepB3 50 districts (7 %) Polio vaccinaion policy for travellers to and from polio endemic/infected countries introduced 2014 Mission Indradhanush to immunize all children against seven VPDs ongoing since Dec 2014
Plan to introduce Rubella vaccine 2017
Source: WHO/UNICEF JRF, 2016
% Coverage
1980 1985 1990 1995 2000 2005 2010 2014 2015 2016
BCG 0 8 66 81 74 86 89 89 87 89
DTP3 6 18 70 71 58 65 79 85 87 88
OPV 2 14 66 71 57 65 76 84 86 86
MCV1 0 1 56 72 56 68 82 85 87 88
Figure 3:
2015
Figure 4:
2016
Source: SEAR annual EPI reporing form, 2015 (administraive data)Source: SEAR annual EPI reporing form, 2016 (administraive data)
Figure 2:
DTP3 coverage
1, diphtheria and pertussis cases
2, 1980-2016
Year
Diphtheria Cases Pertussis Cases DTP3 Coverage
%
320,109 184,368 112,416
0
1WHO/UNICEF esimates of naional immunizaion coverage, July 2017 revision 2WHO vaccine-preventable diseases: monitoring system 2016
Table 4:
Reported cases of vaccine preventable diseases, 2011-2016
Year Polio Diphtheria Pertussis (% of all Tetanus)NT Measles Rubella Mumps JE CRS
2011 1a 4,233 39,091 734 (26%) 33,634 ND ND 1,214 ND
2012 0b 2,525 44,154 588 (24%) 3,305 1,201 ND ND ND
2013 0c 3,133 31,089 415 (15%) 8,285 3,289 ND 1,078 ND
2014 0d 6,094 46,706 492(10%) 26,530 5,716 ND 1,657 ND
2015 0e 2,365 25,206 491 (22%) 30,168 5,850 ND 1,620 ND
2016 0f 3,380 37,274 227 (6%) 17,250 10,311 ND 1,627 25
a Excludes six type 2 VDPVs and one type 3 VDPVs
b Excludes one type 2 VDPVs
c Excludes ive type 2 VDPVs d Excludes three type 2 VDPVs e Excludes two type 2 VDPVs
f Excludes one type 2 VDPVs
Source: WHO/UNICEF JRF and EPI/MOHFW ND=No data
DTP-Hib-HepB3 coverage by state
1980 1985 1990 1995 2000 2005 2010 2011 2012 2013 2014 2015 2016
NT Cases TT2+ Coverage
No data
1 WHO/UNICEF JRF, country oicial esimates, 1980-2016 2WHO vaccine-preventable diseases: monitoring system 2016
Maternal and
neonatal tetanus elimination is sustained
36 States and Union Territories have achieved MNT eliminaion status by May 2015
© WHO/India/M Shapiro
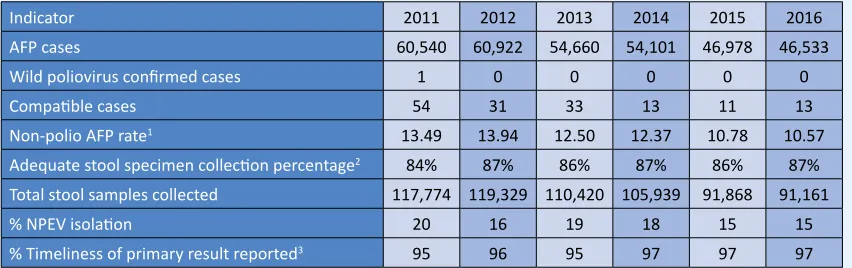
Table 5:
AFP surveillance performance indicators, 2011-2016
Indicator 2011 2012 2013 2014 2015 2016
AFP cases 60,540 60,922 54,660 54,101 46,978 46,533
Wild poliovirus conirmed cases 1 0 0 0 0 0
Compaible cases 54 31 33 13 11 13
Non-polio AFP rate1 13.49 13.94 12.50 12.37 10.78 10.57
Adequate stool specimen collecion percentage2 84% 87% 86% 87% 86% 87%
Total stool samples collected 117,774 119,329 110,420 105,939 91,868 91,161
% NPEV isolaion 20 16 19 18 15 15
% Timeliness of primary result reported3 95 96 95 97 97 97 1Number of discarded AFP cases per 100,000 children under 15 years of age.
2Percent with 2 specimens, at least 24 hours apart and within 14 days of paralysis onset. 3Results reported within 14 days of sample received at laboratory.
Figure 6:
2015
Figure 7:
2016
Polio-free
status is maintained
The last polio case due to WPV was reported on 13 January 2011 from West Bengal.
Non-polio AFP rate by district
<1 1 – 1.99
Delhi- 7 sites Maharashtra- 6 sites Bihar – 3 sites West Bengal- 6 sites Punjab- 4 sites Gujarat -2 sites Telangana – 4 sites Utar Pradesh – 3 sites
Figure 8:
Environmental surveillance sites for
poliovirus detection
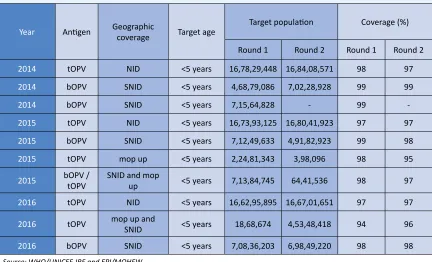
Table 6:
OPV SIAs
Year Anigen Geographic
coverage Target age
Target populaion Coverage (%)
Round 1 Round 2 Round 1 Round 2
2014 tOPV NID <5 years 16,78,29,448 16,84,08,571 98 97
2014 bOPV SNID <5 years 4,68,79,086 7,02,28,928 99 99
2014 bOPV SNID <5 years 7,15,64,828 - 99
-2015 tOPV NID <5 years 16,73,93,125 16,80,41,923 97 97
2015 bOPV SNID <5 years 7,12,49,633 4,91,82,923 99 98
2015 tOPV mop up <5 years 2,24,81,343 3,98,096 98 95
2015 bOPV / tOPV SNID and mop up <5 years 7,13,84,745 64,41,536 98 97
2016 tOPV NID <5 years 16,62,95,895 16,67,01,651 97 97
2016 tOPV mop up and
SNID <5 years 18,68,674 4,53,48,418 94 96
2016 bOPV SNID <5 years 7,08,36,203 6,98,49,220 98 98
Source: WHO/UNICEF JRF and EPI/MOHFW
Adequate stool specimen collection percentage by district
Figure 10:
2016
Figure 9:
2015
<60% 60% - 79%
>80% No AFP
Towards
measles elimination and rubella/CRS control
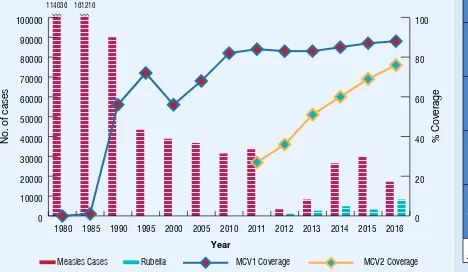
Figure 11:
MCV1 and MCV2 coverage
1, measles and rubella cases
2, 1980-2016
Measles Cases Rubella MCV1 Coverage MCV2 Coverage 2016
No. of cases
Year
1WHO/UNICEF esimates of naional immunizaion coverage, July 2017 revision 2WHO vaccine-preventable diseases: monitoring system 2016
Table 7:
MCV SIAs
Year Anigen Geographic
coverage Target group Target
Coverage %
2010 M subnaional 9 months to
10 years 13,845,686 87%
2011 M subnaional 9 months to
10 years 40,167,580 90%
2012 M subnaional 9 months to
10 years 76,730,639 92%
2015* M subnaional 1 to 15 years 890,070
0%
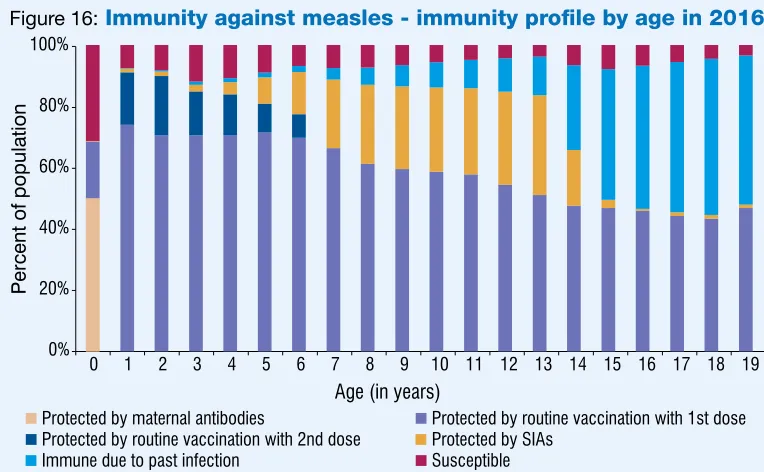
Percent of population
Age (in years)
Protected by maternal antibodies Protected by routine vaccination with 1st dose Protected by routine vaccination with 2nd dose Protected by SIAs
Immune due to past infection Susceptible
Figure 16:
Immunity against measles - immunity profile by age in 2016*
* Modeled using MSP tool ver 2 assuming the schedule and MCV coverage remain unchanged and MR SIA will be conducted in 10 states of India in 2016.
<80% 80% - 89% 90% - 94% >95%
Figure 13:
2016
Figure 14:
2015
Figure 15 :
2016
Source: SEAR annual EPI reporing form, 2016 (administraive data)
Source: SEAR annual EPI reporing form, 2016 (administraive data)
Figure 12:
2015
Source: SEAR annual EPI reporing form,
2015 (administraive data) Source: SEAR annual EPI reporing form, 2015 (administraive data)
Figure 17:
Sub-national risk assessment - measles
and rubella 2016
MCV1 coverage by state
MCV2 coverage by state
Source: developed using WHO risk assessment tool based on JRF & ARF data base
Figure 18:
Sporadic and outbreak associated measles cases* by month and 2011-2016
Outbreak associated measles
No of cases
*Includes laboratory conirmed and epidemiologically linked cases Source: SEAR Monthly VPD reports
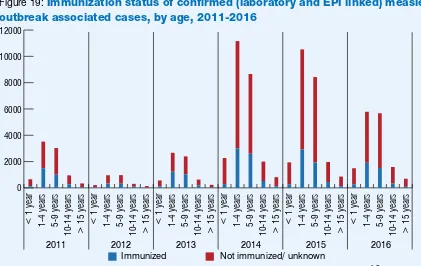
Figure 19:
Immunization status of confirmed (laboratory and EPI linked) measles
outbreak associated cases, by age, 2011-2016
> 15 years
10-14 years
5-9 years
1-4 years
< 1 year
> 15 years
10-14 years
5-9 years
1-4 years
< 1 year
> 15 years
10-14 years
5-9 years
1-4 years
< 1 year
> 15 years
10-14 years
5-9 years
1-4 years
< 1 year
> 15 years
10-14 years
5-9 years
1-4 years
< 1 year
> 15 years
10-14 years
5-9 years
1-4 years
< 1 year
2011 2012 2013 2014 2015 2016
Immunized Not immunized/ unknown
Table 8:
Surveillance performance indicators for measles and rubella, 2012-2016
Year
# suspect
ed measles c
ases not
in
ves
ig
at
ed being discr
et
e c
ases Case classiicaion (number)
Indicators
Measles Rubella
Disc
ar
ded measles
non-rubella c
ases
Annual incidence of con
irmed Measles c
ases per
million t
ot
al popula
ion
Annual incidence of con
irmed Rubella c
ases per
oporion of all suspect
ed
measles and rubella c
ases
tha
t ha
ve had an adequa
te
in
ves
ig
aion iniia
ted within
48 hour
s of noiic
aion
Disc
ar
ded measles
non-rubella incidence per 100,000 total popula
ion
Pr
oporion of subna
ional
measles non-rubella c
ases
per 100,000 t
ot
al popula
ion
Pr
oporion of sub-na
ional
sur
veillance units r
eporing
2014 31,970 3,408 23,052 70 557 5,159 3,840 20.8 4.5 ND 0.3 ND 94.9
2015 38,752 4,808 24,897 463 715 5,135 5,902 23.2 4.5 ND 0.5 ND 92.2
2016 36,447 3,476 13,070 704 1,351 8,960 4,107 13.1 7.8 ND 0.5 ND 90
* Includes those cases of mixed outbreaks for which serum sample was not collected Source: SEAR annual EPI reporing form (2012-2016) ND=No data
Year
Serum specimen collect
ed fr
Serum Specimen receiv
ed in
Labor
a
tor
y
within 4 da
ys of
collecion Specimen Posiiv
e f
or
Measles IgM Specimen Posiiv
e f
or
Rubella IgM
% R
esults within 4 of
receip
tecion Genotypes de
tect
ed
No (%) No (%) No. % No. % Measles Rubella
794(3.1) 794(100) 303 38.16 114 14.36 67 ND ND ND ND
1564(4.6) 1564(100) 910 58.18 373 23.85 88 ND ND ND 2B
4748(7.0) 4748(100) 3,408 71.78 557 11.73 76 15.1 D4,D8,B3 ND ND
7227(9.0) 7227(100) 4,808 66.53 715 9.89 81 23.7 D4,D8,B3 2B ND
7763(11.1) 7763(100) 3,476 44.78 1,351 17.4 56 25.5 D4,D8,B3 2B 2B
Source: SEAR annual EPI reporing form (2012-2016) ND=No data
Figure 20 :
Network of WHO supported surveillance medical officers and laboratories for VPD surveillance
Source: WHO/NPSP and SEARO, 2016
Laboratories:
Polio
Measles/rubella Polio and measles/rubella
Japanese encephaliis
IBD and Rotavirus reference Lab
For contact or feedback:
Immunizaion DivisionMinistry of Health and Family Welfare (MOHFW), New Delhi, India Tel/Fax : +91-11-23062728, Email: [email protected] www.mohfw.nic.in
Immunizaion and Vaccine Development (IVD)
WHO-SEARO, IP Estate, MG Marg, New Delhi 110002, India Tel: +91 11 23370804, Fax: +91 11 23370251
Email: [email protected]