IMPACT OF PAKISTAN-MALAYSIA FTA ON INDONESIAN
EXPORT OF REFINED BLEACHED DEODORIZED
(
RBD) OLEIN
1Reni Kustiari
Indonesian Center for Agriculture Socio Economic and Policy Studies ([email protected])
Grace Rumagit
Universitas Sam Ratulangi, Menado ([email protected])
Abstract
Indonesia needs to increase its export products in order to maintain surplus balance of payment. However, Pakistan-Malaysia FTA could make Indonesian RBD Olein in a difficult situation. This paper aims to examine the impact of a decrease in import tariff of Malaysian RBD olein in Pakistan on Indonesian export of RBD Olein using Trade analysis employing Armington model that distinguishes the product by the country of origin. RBD olein trade model consists of four endogenous countries and one exogenous rest of the world (ROW). The endogenous countries are Indonesia, Malaysia, the United State of America and Pakistan. The results indicate that the reduction in import tariff of Malaysian RBD Olein by 10 percent will cause the price to decrease by around 7.3 percent. The decline in Malaysian RBD olein price will increase its demand in Pakistan by around 4.4 percent. While import demand of Indonesian RBD Olein in Pakistan estimated to increase by only 0.35 percent, this is because the price of Indonesian RBD Olein rises by 0.17 percent. In other word, calculated based on the average of export volume and implicit price in the period 2005-2007, import of Indonesian RBD Olein in Pakistan will only increase by around 2.1 thousand tones, or US$ 1.03 million,.
Keywords: tariff, import, export, Armington model.
INTRODUCTION1
Refined Bleached Deodorized (RBD)
Olein is one of Palm oil products. As Indonesian major export commodity and raw material of cooking oil commonly consumed by Indonesian, palm oil is considered as a strategic commodity. As a labor intensive industry it also plays important role in providing employment for Indonesia’s growing population. For instance, in 2007,
1 Paper Presented at the Second Indonesian Regional Science Association Conference (IRSA Institute) Organized by IRSA. Bogor, July 21-22, 2009.
From 1970 to 2007, palm oil was one of the fastest growing industries in Indonesian economy. In term of planted area, it increased by 20 folds, and in term of production, it increased by 12 percent annually. Besides giving important economic benefit, however, it has posed an increasing threat to Indonesia’s natural forest. This remarkable growth made Indonesia became the world’s second largest RBD Olein producer, with 30 percent contribution to the 2007 global RBD Olein supply. In the export market, Malaysia and Indonesia contributed 64.8 percent and 25.5 percent of the total world RBD Olein export in 2007, respectively (Comtrade, 2008).
The failure of WTO negotiations has given rise to Free Trade Agreements (FTA). FTA aims to remove the barriers to trade and investment. At present, more than 60% of the global trade is channeled through bilateral and regional trading arrangements (Kazmi, 2007). Based on their potentials, Pakistan and Malaysia FTA may include trade in goods, services, investment and other economic collaborations. In trading with Malaysia, Pakistan will reduce the import tariff of seven tariff lines of palm oil products up to 15 per cent of the Margin of Preference (MOP); 10 percent in 2008 and an additional 5 percent cut in 2010.
To maintain surplus balance of payment, Indonesia needs to increase its export products. The above condition, however, indicates that Indonesian RBD Olein is in a difficult position. If Indonesian government does not have appropriate trade strategy, Indonesia will lose the opportunity to export RBD Olein to Pakistan. The main objective of this paper is to estimate the impact of Pakistan-Malaysia FTA on Indonesian export of palm oil, especially RBD and Olein.
FRAMEWORK FOR ANALYSIS
Several straight forward observations of real world behavior support the differentiated good view. Pakistan, in fact, buys from many
sources; RBD Olein differs by quality, for instance, and there may be blending problems that lead buyers to distinguish different RBD Olein. Importers may vary their sources because of security or other political considerations. Contractual obligations may present fairly long adjustment lags. For many exogenous. This formulation results in three sets of equations: (a) a set of demand equations:
Qij =f(PijD, Zi) for I,j= 1,...,n. (1)
where Qij is a quantity consumed in country i
of RBD Olein originating from country j, PijD,
is consumer price in country of RBD Olein
(exogenous) supply in j.
The three sets of equation can be combined in the deterministic equations as
where X is a matrix of demand parameters, export weights, and any other weights that appear as coefficients on endogenous variable, A is a vector of exogenous shifters, and Y is the solution vector of endogenous variables. The inverse of X, which is necessary for the solution, can be thought as a matrix of impact multipliers, where each element in the inverse is a partial derivative of an element in Y with respect to an element in A. Once X-1 is known, endogenous countries and an exogenous rest of the world (ROW). The countries are Indo-nesia, Malaysia, United States and Pakistan.
The endogenous variables of the model are six trade flows, six demand prices, and two supply prices. The system used is deter-ministic. The price elasticities in the demand equations were obtained from Linear Appro-ximation AID’s (LA-AIDs) demands system (Ito, Chen and Peterson, 1990).
ln Wij = ln aij + (1- σ) γij ln (Pij/Pi) +
(2γij -1) ln Ei + eij (5)
where: Wij = is the fraction of the export of
country j that go to country i; Pij = is consumer
price in country of RBD Olein from country j; Pi = RBD Olein price index in country i; Ei =
total import value of RBD Olein in country i. Based on equation 5, price and income elasticities can be calculated as follows:
εjk = -djk + (1- σ) γij (djk - Wk)
djk= 1 if j = k, and 0 if j ≠ k
εje= 2 γij
where: εjk = import demand elasticity of
country j on RBD Olein from country k; εje =
income elasticity of country j on RBD Olein.
The model shows the effect on all sixteen endogenous variables of any exogenous distur-bance. The major exogenous variables are demand shifters (income, price of substitution, imports by ROW), supply shifters (production and inventory changes, and trade shifters (transport costs, trade control, exchange rates).
The most important shifters for these purposes are the trade shifter that appear in the price equations, to determine their effects on the sixteen endogenous variables. This article is concerned with the import price of Malaysian RBD Olein in Pakistan. Hypothe-tical effects of these shifters on the import of Indonesian RBD olein in Pakistan will be analyzed.
WORLD MARKET OF RBD OLEIN AND INDONESIA’S POSITION
1. World Market of RBD olein
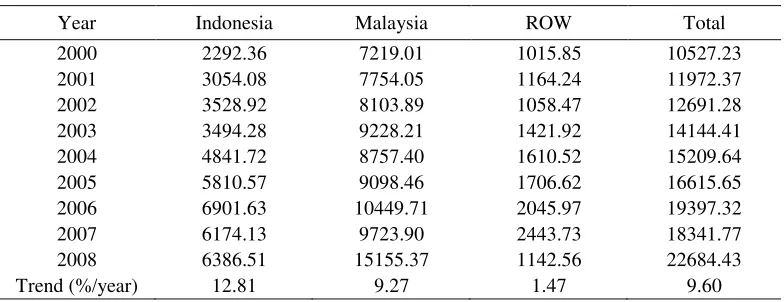
The world RBD Olein trade in 2008 was 22.7 million tons, compared to around 10.5 million tons in 2000. Up to present, Malaysia is the world’s leading exporter (See table 1); the status that has been hold for more than ten years. From 2000 to 2008, it exported 9.49 million tons per year in average, or around 60.9 percent of the world trade.
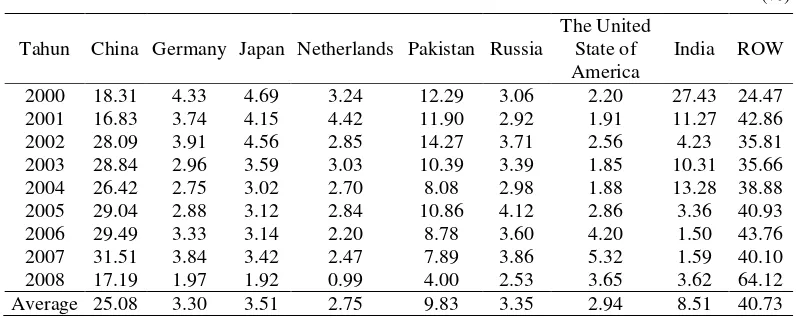
(See table 4). India, Japan and Russia followed the two countries. During the period of 2000 and 2008, the share of these three countries accounted for about 15.3 percent of the total world market, on average. During the same period, The United States of America was the most growing market of RBD Olein with the growth rate of 24 percent, annually, followed by China (13.7%) and Russia (12.8%).
2. Indonesia’s Position in International Market
Throughout the period of analysis, Asia is the primary export market for Indonesian RBD Olein. In 2001, 38.4 percent of Indonesia’s RBD Olein were exported to Asian markets, especially China, India and Pakistan. In the last decade, Indonesia,s RBD Olein market distributions were relatively the same. In 2008, Asean market were destination of 45.4 percent
Table 1. Trends of Export Volume of RBD olein by Major Exporter, 2000-2008
(1000Ton)
Year Indonesia Malaysia ROW Total
2000 2292.36 7219.01 1015.85 10527.23
2001 3054.08 7754.05 1164.24 11972.37
2002 3528.92 8103.89 1058.47 12691.28
2003 3494.28 9228.21 1421.92 14144.41
2004 4841.72 8757.40 1610.52 15209.64
2005 5810.57 9098.46 1706.62 16615.65
2006 6901.63 10449.71 2045.97 19397.32
2007 6174.13 9723.90 2443.73 18341.77
2008 6386.51 15155.37 1142.56 22684.43
Trend (%/year) 12.81 9.27 1.47 9.60
Source: COMTRADE http://www.unstats.un.org/unsd/comtrade
Appendix Table 2. Market Share of Major Exporter, 2000-2008
(%)
Year Indonesia Malaysia ROW Total
2000 21.78 68.57 9.65 100.00
2001 25.51 64.77 9.72 100.00
2002 27.81 63.85 8.34 100.00
2003 24.70 65.24 10.05 100.00
2004 31.83 57.58 10.59 100.00
2005 34.97 54.76 10.27 100.00
2006 35.58 53.87 10.55 100.00
2007 33.66 53.02 13.32 100.00
2008 28.15 66.81 5.04 100.00
Average 29.33 60.94 9.73 100.00
of Indonesia’s RBD Olein exports, whereas China’s and India’s shares were 22.9 percent and 14.4 percent, respectively (See table 5) or 1460.8 thousand tons and 918.2 thousand tons.
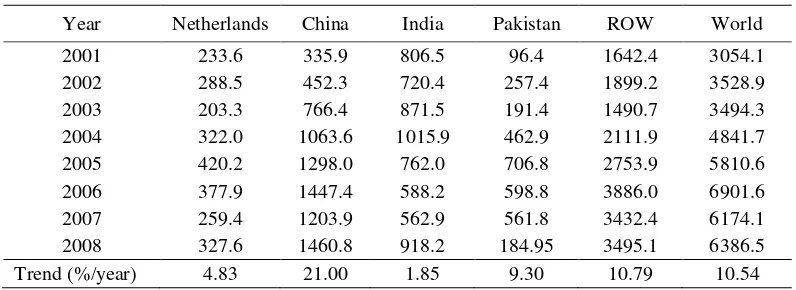
During 2001-2008 periods, the rate of growth of Indonesia’s exports to China was 21 percent while Indonesia’s export to Pakistan and The Netherlands grew at 9.3 percent and 4.8 percent per year, respectively (See table 6). This market trend shows that it is reasonable for Indonesia to expand its exports to non-traditional market. It is important to note that
Indonesia’s market share in China, which is one of the targeted markets for Indonesian RBD Olein, in 2001 was only 22.4 percent increase to 31.1 percent in 2008
In general, Indonesia’s market share in several markets were fluctuated and tended to decrease, except in China and India (See table 7).
In line with the improvement of trade relationship between Indonesia and Pakistan, statistics for the period of 2000 to 2007 issued by the Government of Pakistan showed that
Table 3. Trends of Volume Import by Major Importer Countries, 2000-2008
(1000ton)
Tahun China Germany Japan Netherlands Pakistan Russia
The United State of America
India ROW
2000 1376 325 352 243 924 230 165 2061 7513
2001 1503 334 371 395 1063 261 171 1007 8931
2002 2399 334 389 244 1219 317 219 361 8541
2003 3296 338 410 346 1187 387 211 1178 11430
2004 3851 401 440 393 1177 435 274 1936 14575
2005 4226 419 454 413 1581 600 416 489 14554
2006 4423 500 471 330 1317 539 629 225 14998
2007 4662 568 505 365 1168 571 787 236 14799
2008 4698 539 526 271 1093 692 997 989 27329
Trend
(%) 13.67 7.87 5.00 1.32 2.21 12.79 24.04 -13.37 13.81
Source: COMTRADE. http://unstats.un.org/unsd/comtrade
Table 4. Proportion of Major Importer Countries, 2000-2008
(%)
Tahun China Germany Japan Netherlands Pakistan Russia
The United State of America
India ROW
2000 18.31 4.33 4.69 3.24 12.29 3.06 2.20 27.43 24.47 2001 16.83 3.74 4.15 4.42 11.90 2.92 1.91 11.27 42.86
2002 28.09 3.91 4.56 2.85 14.27 3.71 2.56 4.23 35.81
2003 28.84 2.96 3.59 3.03 10.39 3.39 1.85 10.31 35.66 2004 26.42 2.75 3.02 2.70 8.08 2.98 1.88 13.28 38.88
2005 29.04 2.88 3.12 2.84 10.86 4.12 2.86 3.36 40.93
2006 29.49 3.33 3.14 2.20 8.78 3.60 4.20 1.50 43.76
2007 31.51 3.84 3.42 2.47 7.89 3.86 5.32 1.59 40.10
2008 17.19 1.97 1.92 0.99 4.00 2.53 3.65 3.62 64.12
Indonesian export value to Pakistan increased significantly which led to the increase of Indonesia’s balance of trade. In other words, lndonesia is in a better position.
Considering the increasing trend of Malaysia-Pakistan trade and the finalization of FTA between the two countries, it is expected that trade relationship between Pakistan-Malaysia will experience a rapid growth in the years to come. In addition, implementation of Pakistan-Malaysia FTA in early January 2008, which consequently reduce both tariff and
non-tariffs barrier of trade between the two countries will also strengthen trade relation-ship between the two countries. It is predicted, however, this will have negative impact on trade between Indonesia-Pakistan.
Pakistan is the world’s fourth largest consumer of vegetables oil where 90 per cent of it was imported, mostly from Malaysia (81%) and Indonesia (17%). Before the implementation of the FTA, Pakistan imposed sales tax and federal excise duty of 15 per cent and holding tax of 2 per cent. Under the Free
Table 5.The Composition of Indonesia’s RBD Olein Export by Country of Destination, 2001-2008
(%)
Year Netherlands China India Pakistan ROW World
2001 7.82 11.00 26.41 3.16 53.78 100.00
2002 7.65 12.82 20.41 7.29 53.82 100.00
2003 8.18 21.93 24.94 5.48 42.66 100.00
2004 5.82 21.97 20.98 9.56 43.62 100.00
2005 6.65 22.34 13.11 12.16 47.39 100.00
2006 7.23 20.97 8.52 8.68 56.31 100.00
2007 5.48 19.50 9.12 9.10 55.59 100.00
2008 5.13 22.87 14.38 2.89 54.73 100.00
Average 6.75 19.18 17.23 7.29 50.99 100.00
Source: COMTRADE. http://unstats.un.org/unsd/comtrade
Table 6. Export of RBD olein Indonesia by Country of Destination, 2001-2008
(1000Ton)
Year Netherlands China India Pakistan ROW World
2001 233.6 335.9 806.5 96.4 1642.4 3054.1
2002 288.5 452.3 720.4 257.4 1899.2 3528.9
2003 203.3 766.4 871.5 191.4 1490.7 3494.3
2004 322.0 1063.6 1015.9 462.9 2111.9 4841.7
2005 420.2 1298.0 762.0 706.8 2753.9 5810.6
2006 377.9 1447.4 588.2 598.8 3886.0 6901.6
2007 259.4 1203.9 562.9 561.8 3432.4 6174.1
2008 327.6 1460.8 918.2 184.95 3495.1 6386.5
Trend (%/year) 4.83 21.00 1.85 9.30 10.79 10.54
Trade Agreements, the tariff will be reduced by 10 percent at the beginning of 2008.
In short, FTA agreement between Pakistan and Malaysia will give a serious challenge to Indonesia in maintaining its market share in Pakistan market in the coming years. As, it has been observed that, Malaysia and Indonesia export similar product to Pakistan, the Pakistan-Malaysia FTA which start in January 2008 will lead Malaysia to be in a better position compared to Indonesia.
EMPIRICAL RESULT
Referring to the equation, the X matrix consists of three groups of elements. The first are demand elasticities for the products (RBD Olein distinguished by place of origin). These direct and cross price elasticities are calculated using equations 5. Direct price elasticities for
RBD Olein in four endogenous markets are derived from the demand systems. The second elements, S (price flexibilities of Indonesia and Malaysian RBD Olein) are 12.88 and 9.53, respectively. The elasticities are obtained by inverting the corresponding supply price elasticities, which are 0.07 and 0.14, respec-tively. The third element are the proportions of Indonesia and Malaysian RBD Olein going to the two endogenus regions (dij). These proportions calculated using data from 1993-2007. Finally, all price elasticities of trans-mission tij are assumed to be equal to 1.
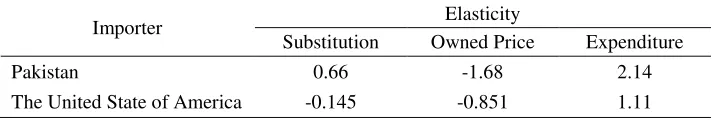
Table 8 shows elasticity of substitution, owned price and expenditure of Indonesian RBD Olein estimated by the LA/AIDs system. Elasticity of substitution on Indonesian RBD Olein in Pakistan is 0.66 which indicates the existence of substitution relationship among
Appendix Table 7. Indonesian Market Share in Country of Destination, 2001-2008
(%)
Year Netherland China India Pakistan World
2001 59.21 22.35 80.12 9.07 13.72
2002 98.22 20.45 52.91 21.11 14.96
2003 58.75 23.25 73.96 16.12 10.54
2004 81.88 27.62 52.48 39.31 13.89
2005 88.84 30.72 79.41 44.72 16.57
2006 97.02 32.72 70.18 45.46 20.03
2007 70.99 25.82 66.11 48.10 18.71
2008 42.21 31.09 92.80 16.92 13.30
Average 74.64 26.75 71.00 30.10 15.22
Source: COMTRADE. http://unstats.un.org/unsd/comtrade
Table 8. Elasticity of Substitution, Owned Price and Expenditure of Indonesian RBD Olein
Importer Elasticity
Substitution Owned Price Expenditure
Pakistan 0.66 -1.68 2.14
The United State of America -0.145 -0.851 1.11
RBD Olein from exporting countries. This could be due to low quality of RBD Olein imported by Pakistan, and hence easily substituted by RBD Olein from other exporting countries.
In the United States of America, however, elasticity of substitution on Indonesian RBD Olein is -0.145, which indicates the existence of complementary relationship among RBD Olein from exporting countries. Export to the United States of America and Pakistan look relatively prospective, reflected by expendi-ture elasticities of RBD Olein from Indonesia which were around 1.11 and 2.14, respec-tively. Price elasticity of Indonesian RBD Olein in Pakistan was around 1.68, indicating the existence of high competition among RBD Olein from other exporting countries.
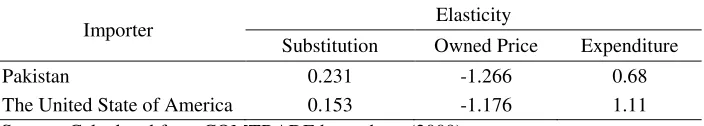
In Pakistan, RBD Olein from Malaysia has particular market and considered as an important commodity to its oil industry. This indicated by elasticity of expenditure around 0.68 (See table 9). This means that in Pakistan, RBD Olein from Malaysia is categorized as primary product. Therefore, the changes of import expenditure in Pakistan would caused less impact on import demand of RBD Olein from Malaysia compared to that of from Indonesia.
Several changes in exogenous shifters of demand for the world’s RBD Olein industries have taken place in the fats and oils economy. They are, among others:
Supply change, both Malaysia and Indonesia, increase world RBD Olein production. During 1993-2007 Malaysian and
Indonesian RBD Olein production grew by 3.8 percent and 11.7 percent, respectively. In absolute volumes, however, Malaysia’s production (9.7 million tones) was 1.5 times higher than that of Indonesia’s (6.2 million tones) (DGPE, 2008). In Indonesia, new policies to increase production of palm oil have been implemented. It is expected that, by the end of the 2020, the production will increase significantly.
A simulation has been done to analyze effects of the Pakistan-Malaysia FTA and the production changes on the Malaysian and Indonesian RBD Olein. In long run solution, the change on production can be treated as an approximation to a change in supply available in the market–clearing identities.
The impact of the changes of Malaysian import tariff for RBD Olein which started in January 2008 can be estimated using model described above. Pakistan-Malaysia FTA which is reflected by import tariff decrease for RBD Olein from Malaysia will depress Malaysian RBD Olein price in Pakistan and then increase demand for Malaysian RBD Olein, and ultimately reduce demand for Indonesian RBD Olein.
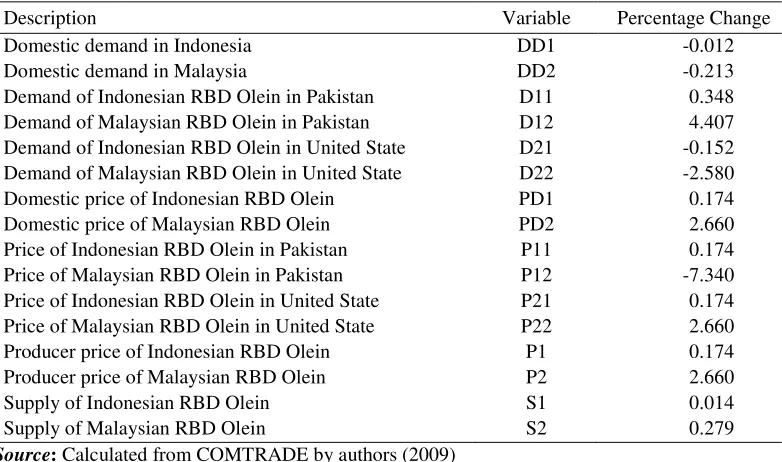
Simulation shows that a 10 percent decrease in tariff on Malaysian RBD Olein in Pakistan will reduce Malaysian RBD Olein price in the region by 7.34 percent (See table 10) and increase Indonesian RBD Olein price in Pakistan by 0.17 percent. Predicted impacts of this particular policy are an increase in the flow of Malaysian RBD Olein to Pakistan by 4.4 percent, but it led to a decrease in the flow
Table 9. Elasticity of Substitution, Owned Price and Expenditure of Malaysian RBD Olein
Importer Elasticity
Substitution Owned Price Expenditure
Pakistan 0.231 -1.266 0.68
The United State of America 0.153 -1.176 1.11
to the United States of America by 2.6 percent. Domestic consumption in Malaysia falls by 0.21 percent and total supply increase by 0.28 percent.
This tariff policy in Pakistan caused a small increase in the Indonesian RBD Olein export to Pakistan by around 0.35 percent compared to that of 29.4 percent per year in the period 2000-2007. In other word, calculated based on the average of export volume and implicit price in the period 2005-2007, import of Indonesian RBD Olein in Pakistan will increase by around 2.1 thousand tones, or US$ 1.03 million,. Domestic consumption in Indonesia falls by 0.01 percent
but total supply increase by 0.01 percent. Small increase in the Indonesian RBD Olein export to Pakistan will reduce Indonesian export to the United States of America by 0.15 percent. The decrease in the flows to the region is attributable to an increase in the price of the products by 0.17 percent.
The effect of the Pakistan-Malaysia FTA was amplified by the government regulation issued on September 10, 2005 that taxed export. This export tax is called export collection which is categorized as non tax revenue by the government. The tariff of the export collection is tabulated in table 11. It can be easily calculated that export of RBD Olein
Table 10. Impact of Tariff Reduction of Malaysian RBD olein in Pakistan on Indonesian export
Description Variable Percentage Change
Domestic demand in Indonesia DD1 -0.012
Domestic demand in Malaysia DD2 -0.213
Demand of Indonesian RBD Olein in Pakistan D11 0.348
Demand of Malaysian RBD Olein in Pakistan D12 4.407
Demand of Indonesian RBD Olein in United State D21 -0.152
Demand of Malaysian RBD Olein in United State D22 -2.580
Domestic price of Indonesian RBD Olein PD1 0.174
Domestic price of Malaysian RBD Olein PD2 2.660
Price of Indonesian RBD Olein in Pakistan P11 0.174
Price of Malaysian RBD Olein in Pakistan P12 -7.340
Price of Indonesian RBD Olein in United State P21 0.174
Price of Malaysian RBD Olein in United State P22 2.660
Producer price of Indonesian RBD Olein P1 0.174
Producer price of Malaysian RBD Olein P2 2.660
Supply of Indonesian RBD Olein S1 0.014
Supply of Malaysian RBD Olein S2 0.279
Source: Calculated from COMTRADE by authors (2009)
Table 11. Export Collection Tariff and Reference Price
Particular Export Collection Tariff (%) Reference Price(US$ /ton)
Fresh Fruit Bunches (FFB) 3.0 60
Crude Palm oil (CPO) 1.5 350
CRD Olein 0.3 360
RBD Oil 0.3 360
RBD Olein 0.3 380
is US$ 1.14 per ton (Bangun, 2006). The should find strategies to sustain the production of palm oil products in Indonesia to fulfill the world demand and, at the same time, provide job opportunities and improving the standard of living of Indonesia’s population which is still far behind those of many other countries.
CONCLUSIONS
Many distortions can be found in the international pricing of fats and oils, including the international market for RBD Olein product. The failure of WTO agreement causes many FTA to exist. One of FTA that threat Indonesian RBD Olein industry is Pakistan-Malaysia FTA. Considering and anticipating the trends that may occur in the trade relationship between Indonesia-Pakistan, the Government of Indonesia is expected to find a way so that the trade relationship between Indonesia-Pakistan will not deteriorate in the future.
Foundation to improve trade cooperation between the two countries actually has been formed, which is in the Trade Negotiating Committee of Pakistan-Indonesia which led to the formation of PTA/FTA in the framework of Comprehensive Economic Partnership (CEP), which is currently in discussion. The finalization process, however, still need some time. Agreement on some trade issues between the two countries have not been made yet.
Exploring alternative non-traditional markets for Indonesian exports, increase trade with Pakistan is one of an important step to do, considering Pakistan can also become a gateway for Indonesian export to Central Asian region. Therefore, it is expected that cooperation framework between the two countries can be finished soon. Interchange
business delegation must be improved as well as continuing efforts to eliminate trade barriers (both tariff and non-tariff barriers) between Indonesia-Pakistan.
All stakeholders should be aware of not only the role of palm oil in fulfilling the world needs and in providing job opportunities for millions of labours but also of the challenges faced by the industry. Cooperation among stakeholders will be able to promote the production, use of sustainable palm oil, and maintaining reasonable growth of Indonesian export earnings.
REFERENCES
Azahari, D.H., 2008. “The Implementation of
Sustainable Palm oil Production in Indonesia”. Research Workshop on Sustainable Palm oil Production in Indonesia. Jakarta.
Bangun, D., 2006. “Indonesian Palm Oil Industry”. Indonesian Palm Oil Asso-ciation (GAPKI). Indonesia.
Center for Agricultural Data and Information., 2008. Agricultural Statistics, 2002-2007. Ministry of Agriculture. Jakarta.
Directorate General of Plantation Estates, 2008. Palm oil Statistics 2000-2007. Ministry of Agriculture. Jakarta.
Ito, S., D.T. Chen and E.W.F. Peterson, 1990. “Modelling international trade flows and market shares for agricultural commo-dities: a modified armington procedure for rice”. Agricultural Economics, 9, 347-356. Johnson, Grennes, and Thursby., 1977. “Devaluation, foreign trade controls, and domestic wheat prices”. American Journal
of Agricultural Economics, 59(4), 619–
627.
Kazmi, S., 2007. The Effect of Export Tax on
Indonesia’s Crude Palm Oil (CPO) Export
Competitiveness. University of Tokyo and