REMOTE SENSING OF WATER QUALITY IN OPTICALLY COMPLEX LAKES
T. Kutser a,b *, B. Paavel a, C. Verpoorter b, T. Kauer a, E. Vahtmäea
aEstonian Marine Institute, University of Tartu, Mäealuse 14, 12618, Tallinn, Estonia – [email protected] b Limnology / Department of Ecology and Genetics, University of Uppsala, Norbyvägen 18D, Uppsala, 75236, Sweden
Commission VIII/4
KEY WORDS: Lakes, remote sensing, water quality, aquatic optics, chlorophyll-a, CDOM, suspended matter
ABSTRACT:
Solving of several global and regional problems requires adequate data about lake water quality parameters like the amount and type of phytoplankton dominating in the lakes, the amount of dissolved and coloured dissolved organic matter and/or concentration of suspended sediment. Remote sensing is the only practical way to study many lakes provided it can produce sufficiently accurate estimates of the water characteristics. We studied optically very variable lakes in order to test both physics based methods and conventional band-ratio type algorithms in retrieval of water parameters. The modelled spectral library used in the physics based approach provided very good results for chlorophyll-a retrieval. The number of different concentrations of CDOM and suspended matter used in the simulations was too low to provide good estimates of these parameters. Extending the spectral library is currently in progress. Band-ratio type algorithms worked well in chlorophyll-a and CDOM retrieval. None of the algorithms tested for total suspended matter, organic suspended matter and inorganic suspended matter retrieval performed well enough and there is need in further testing.
* Corresponding author. This is useful to know for communication with the appropriate person in cases with more than one author. 1. INTRODUCTION
Monitoring of lake water quality in regional to global scales is important from several aspects. For example recent studies (Cole et al., 2007; Battin et al., 2009; Tranvik et al., 2009) indicate that lakes play very important role in the global carbon cycle. These estimates are mainly based on upscaling regional in situ data to global scale. The true role of lakes in the global carbon cycle can be determined only by remote sensing as it is not possible to study sufficient amount of lakes by means of in situ sampling. However, reliable remote sensing algorithms for retrieval of parameters like coloured dissolved organic matter, CDOM, will be needed as CDOM can be used as a proxy to estimate also DOC (dissolved organic carbon) concentrations and CO2 saturation in lakes in global scale (Kutser et al. 2005a,b, 2009a, Sobek et al. 2003). Monitoring of lake DOC is important also from drinking water quality point of view as chlorination produces cancerogenic compounds and increasing DOC in lakes used as a drinking water source impacts human health (McDonalnd and Komulainen 2005).
Frequency and extent of intense phytoplankton blooms has increased in inland and coastal waters around the world (Hallegraeff 2003, Sellner et al. 2003, Glibert et al. 2005) Potentially harmful effects of the blooms (Edler et al. 1985, Horner et al. 1997, Landsberg 2002, Hallegraeff 2003, Sellner et al. 2003, Glibert et al. 2005, Backer and McGillicuddy 2006) on human and animal health, drinking water quality and recreational use of water bodies have caused awareness of general public, environmental agencies and water authorities. Conventional monitoring networks, that are based on infrequent sampling in a few fixed monitoring stations, cannot provide the information needed as the blooms are very heterogeneous both spatially and temporally. Only remote sensing can provide the spatial and temporal coverage needed. Many authors (see
references in review papers by Kutser 2009b and Matthews 2011) have worked on recognition and quantitative mapping of potentially harmful blooms. However, the quantitative mapping problem is still unsolved as there is no sufficient information on optical properties of different blooms and vertical structure of biomass in the blooms (for these species that can migrate in the water column).
Physics based methods using modelled spectral libraries (look-up tables) in interpretation of remote sensing data have gained popularity in both mapping of water depth and shallow water benthic habitats (Kutser et al. 2002, 2006; Mobley et al. 2005; Lesser and Mobley 2007; Brando et al. 2009) but also in retrieving optically active constituents of the water column (Kutser et al. 2001, Brando et al. 2009) or estimating phytoplankton biomass in heavy blooms (Kutser 2004). We used Hydrolight radiative transfer model to simulate remote sensing reflectance spectra and then used procedure called Spectral Angle Mapper, SAM, to find the modelled spectrum most similar to the measured one. It was assumed that the concentrations of chlorophyll-a, CDOM and mineral particles in the water match the concentrations used in modelling if the measured and modelled reflectance spectra match. This would allow to retrieve the three concentrations simultaneously. Suitability of several band-ratio type algorithms for retrieving the optically active water constituents were also tested.
2. STUDY SITES AND METHODS
2.1 Study sites
The selected lakes are variable in their optical water properties and large enough for satellite remote sensing with sensors like MERIS with it’s 300 m spatial resolution. Lake Peipsi in Estonia is the fourth largest lake in Europe (3555 km2). It’s International Archives of the Photogrammetry, Remote Sensing and Spatial Information Sciences, Volume XXXIX-B8, 2012
waters are CDOM dominated and cyanobacterial blooms take place every summer. Lake Mälaren in Sweden is the ninth largest lake in Europe (1140 km2). Mälaren has sophisticated morphology and due to that optical water properties vary greatly in different basins. Lake Võrtsjärv is the second largest lake in Estonia (270 km2). It is a hypetrophic lake with relative high concentrations of optically active substances (phytoplankton, CDOM and suspended matter). Lake Tämnaren in Sweden (32.62 km2) is a very shallow (max depth 1.8 m) brown-watered lake. We happened to sample there in a windy day and therefore the suspended matter concentration was the highest from all sampled lakes (64.95 mg/l). Lake Harku is the smallest from studied lakes with it’s 1.64 km2 area. The concentrations of chlorophyll-a there were the highest from all studied lakes (203.31 mg/m3) while the CDOM absorption at 400 nm was in the same range with Lake Peipsi (up to 11.7 m-1).
The Estonian lakes were sampled three times during spring-summer season 2011 (in May, July, August). The Swedish lakes were sampled in September 2011.
2.2 Remote sensing data
The original idea was to collect MERIS imagery from all studied lakes, test performance of the standard products and develop new methods/algorithms if the standard products do not perform well. The first two field campaigns in Estonia took place in practically cloud free conditions. Unfortunately, there were small clouds or processing errors in MERIS Level 2 products in the places where our sampling took place. In Sweden we sampled during a week with variable weather. Some parts of Lake Mälaren were sampled during cloudy days. In one day our sampling stations happened to be in an area between two MERIS swaths. As a consequence, the number of matchup points is too low to validate MERIS Level 2 products.
We carried our reflectance measurements with two Ramses radiometers in each sampling station. The reflectance measurements were carried out in two different ways. Firstly we measured reflectance in a “normal” way where both the downwelling irradiance and upwelling radiance sensors were above the water surface. These measurements were followed by measurements where the irradiance sensor was above the water surface but the upwelling radiance sensor was just below the water surface. This allowed us to collect reflectance spectra without any sun or sky glint contamination.
2.3 Optical measurements
We studied optical water properties with a Wetlabs instrument package, besides the reflectance measurements, in each sampling station. The package consists of a hyperspectral absorption and attenuation meter ac-s, a backscattering senor eco-bb3 measuring backscattering coefficient at three wavelengths (412, 595, 715 nm), and a volume scattering sensor eco-vsf3 that measures scattering at three wavelengths (460, 532, 660 nm) and under three angles (100, 125 and 150 degrees). It is possible to calculate the backscattering coefficient also from the ec-vsf3 data. This way we get backscattering coefficient at six different wavelengths.
2.4 Laboratory measurements
For chlorophyll concentrations 0.5–1.0 liters of water was filtered through Whatman GF/F-filters (pore size 0.7 μm), extracting pigments with hot ethanol (90%, 75°C) and
measuring absorption coefficients at the wavelengths of 665 and 750 nm (ISO 10260, 1992 (E)).
The concentration of total suspended matter, CTSS, was
measured gravimetrically after filtration of the same amount of water through pre-weighed and pre-combusted (103–105 °C for 1 h) filters; the inorganic fraction, CSPIM, was measured after
combustion at 550 °C for 30 min. The organic fraction CSPOM
was determined by subtraction of CSPIM from CTSS (ESS method
340.2, 1993).
Absorption by coloured dissolved organic matter (CDOM, called also yellow substance), ays, was measured with a spectrometer (Hitachi U-3010 UV/VIS, in the range 350–750 nm) in water filtered through Millipore 0.2 m filter, measured in a 10 cm cuvette against distilled water and corrected for residual scattering according to Davis-Colley and Vant (1987), who estimated the accuracy of the method to be better than 0.017 m–1.
The total particulate absorption, ap(λ), was measured with a
spectrometer (Hitachi U-3010 UV/VIS, in the range 400–800 nm) with the Whatman GF/F filter pad technique (Tassan & Ferrari, 1995, 2002) and using later depigmentation with sodium hypochloride (Ferrari & Tassan, 1999), which separates phytoplankton pigment absorption aph(λ) and the absorption by
the rest of particles, at(λ) (tripton).
2.5 Radiative transfer modelling
Hydrolight 5.0 radiative transfer model (Mobley and Sundman 2001) was used to simulate remote sensing reflectance spectra. A Case 2 model was parameterised in Hydrolight with some input from our local knowledge about the optical properties of the lakes under investigation. For example specific absorption and scattering coefficients of Anabaena circinalis (Metsamaa et al. 2006) were used as we know that Anabaena species dominated in some of the lakes during certain periods.
We are in the early stages of creating the modelled spectral library that covers the whole possible range of chlorophyll, CDOM and suspended matter variations in our lake waters. The spectral library used in this study was created using chlorophyll-a concentrchlorophyll-ations 1, 5, 10, 30, 60, chlorophyll-and 200 mg/m3; CDOM absorption coefficients (at 420 nm) 1, 5, and 10 m-1; and mineral particle concentrations 1, 5, 10, and 20 mg/l.
In this study we used reflectance spectra where the water leaving radiance (Lw) was divided by the downwelling irradiance (Ed). These spectra were compared with in situ reflectance spectra measured with upwelling radiance sensor just below the water surface and the downwelling irradiance sensor above the water surface i.e. both the modelled and measured reflectance spectra did not contain any glint.
Spectral Angle Mapper (SAM) was used to find the modelled spectrum most similar to any measured reflectance spectrum. Different angles from 0.2 to 0.5 were used in SAM. All the angles produced identical classification results but the number of unclassified reflectance spectra was the lowest for the angle of 0.5. Therefore, the results presented in this study are for this angle.
3. RESULTS AND DISCUSSION
Results of the physic based approach can be considered as preliminary because the modelled spectral library is very small. The number of different CDOM concentrations used in the model was three and the number of mineral suspended matter concentrations was four. This was too crude to describe the whole range of concentrations we had in the studied lakes. Therefore, the correlation between measured and estimated concentrations was poor. The number of different chlorophyll-a concentrations was six. The correlation between measured and estimated concentrations of chlorophyll-a was very good as seen in Figure 1, although one of the reasons behind the good correlation is the Lake Harku where chlorophyll was above 200 mg/m3.
Figure 1. Correlation between the chlorophyll concentration measured from water samples and the chlorophyll concentration
estimated using a modelled spectral library and Spectral Angle Mapper procedure.
We are currently in the process of creating a comprehensive spectral library that contains thousands of spectra modelled for different concentrations of optically active substances. Our previous results (Kutser et al. 2001, where we used a simple bio-optical model and slightly different procedure for comparing measured and modelled spectra) showed that using of variable concentration steps is a reasonable approach to reduce the number of model simulations needed i.e. concentrations used in the model are increased with small steps when the concentrations are small and the step are increased with increasing concentrations. Otherwise the number of different combinations of the tree optically active constituents becomes exhaustive.
There is also some need to improve parameterisation of the Hydrolight model for our lakes. For example the model was not able to replicate as strongly as needed the features characteristic to cyanobacterial blooms – a peak at 650 nm and phycocyanin absorption feature at 620 nm. One of the reasons may be that the Anabaena circinalis specific optical properties do not mach exactly these of the species present in the studied lakes. However, more likely cause is too low and too flat scattering to backscattering ratio used in Hydrolight as it is known that cyanobacteria are very efficient backscatterers and their specific backscattering coefficient spectra may have more sophisticated spectral shape than just monotonous decrease with increasing wavelength. Optical properties of cyanobacteria differ significantly from other phytoplankton. It may mean that creating a comprehensive spectral library that will work well during the whole ice free season may require modelling with
two sets of optical properties of phytoplankton – cyanobacteria and all others.
The “classical” statistical approach was used in parallel with the physic based approach i.e. we were looking for band ratio type or more sophisticated algorithms that are in correlation with any of the water properties. Different algorithms were used for retrieval of chlorophyll-a, CDOM, suspended matter. A few results are presented below.
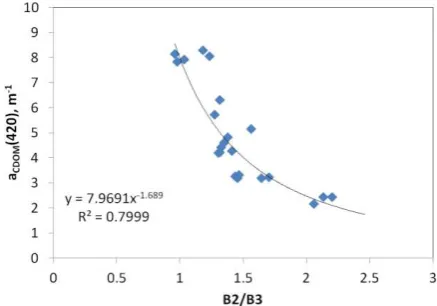
It has been shown (Kutser et al. 2005a,b, 2009a) that lake CDOM can be mapped with multispectral satellites using ratio of green (B2) and red (B3) bands. We calculated average reflectance values for 525-605 nm and 630-690 nm spectral ranges from Ramses reflectance data in order to test suitability of the B2/B3 ratio for CDOM retrieval in lakes under investigation. Results from two measurements in Lake Harku did not fit the general picture. These two measurements were rather exceptional as chlorophyll-a was above 200 mg/m3 in both cases. Figure 2 illustrates the correlation between B2/B3 ratio and lake CDOM when the two extreme samples were removed from the analysis.
Figure 2. Correlation between in situ measured absorption of CDOM at 420 nm and B2/B3 ratio calculated from Ramses
reflectance spectra.
Glint-free reflectance spectra were used in the analysis as was mentioned above. For the comparison we used also reflectance spectra measured above the water surface. The correlation between CDOM and the band ratio shown in Figure 2 dropped significantly (R2=0.54) when the above water reflectance spectra were used. This confirms the need to remove sun and sky glint from reflectance spectra. On the other hand we have developed a procedure to remove glint from field radiometry data (Kutser et al. 2012). Thus, the field reflectance spectra can be corrected to the same level than the data used by us in this study. Comparing the CDOM retrieval algorithm obtained here for field radiometers with the algorithm we obtained for Advanced Land Imager (Kutser et al. 2005b) shows that there is slight shift in the power function (i.e. the coefficients in the retrieval algorithm are not the same). One of the reasons may be the glint as it was not removed from the satellite data in the earlier study.
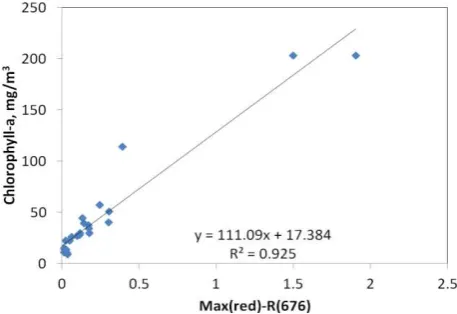
The peak in reflectance spectra near 700 nm is often used as an indicator of chlorophyll-a concentration in eutrophic waters (Gitelson 1992, Kutser 1997, Kallio et al. 2001, Gower et al. 2005). In the present study we used a simple difference between the reflectance in the read peak, Max(red), and minima in the International Archives of the Photogrammetry, Remote Sensing and Spatial Information Sciences, Volume XXXIX-B8, 2012
chlorophyll-a absorption feature at 676 nm, R(676). The peak is shifting towards longer wavelengths with increasing concentration of phytoplankton in the water. We have continuous spectra with 2 nm interval. Therefore, the peak value was taken from the spectral range 690 nm to 716 nm instead of a fixed wavelength like you have to do in the case of satellite data. The correlation was very good as seen in Figure 3. The Lake Harku samples with chlorophyll-a concentration above 200 mg/m3 make the correlation better than it would have been for the lakes with smaller concentrations. The only point currently significantly off from the regression line (see Figure 3) is Lake Tämnaren where the strong winds and shallow water depth caused high amount of suspended sediments in the water (TSS=64.95). Most of the suspended matter (63%) were organic particles absorbing light as the total absorption measured in Tämnaren was significantly higher than in most other lakes. This may have affected also red part of spectrum used in the chlorophyll-a retrieval algorithm.
Figure 3. Correlation between the height of the reflectance peak near 700 nm and concentration of chlorophyll-a.
Several band-ratio type algorithms were tested for total, organic and inorganic suspended matter retrieval (Kallio et al. 2001, Doxaran et al. 2005). However, no sufficiently good algorithms were found up to now for these lakes.
4. REFERENCES
Backer, L.C., and McGillicuddy, D.J. 2006 Harmful algal blooms. At the interface between coastal oceanography and human health. Oceanography, 19, pp. 94-106.
Battin, T.J., Luyssaert, S., Kaplan L.A., Aufdenkampe, A.K., Richter, A., and Tranvik, L.J. 2009. The boundless carbon cycle. Nature Geoscience, 2, pp. 598-600.
Brando, V., Anstee, J., Wettle, M., Dekker, A., Phinn, S., Roelfsema, C., 2009. A physics based retrieval and quality assessment of bathymetry from suboptimal hyperspectral data. Remote Sensing of Environment, 113, pp. 755-70.
Cole J.J., Y. T. Prairie, N. F. Caraco, W. H. McDowell, L. J. Tranvik, R. G. Striegl, C. M. Duarte, P. Kortelainen, J. A. Downing, J. J. Middelburg, 2007. Plumbing the global carbon cycle: integrating inland waters into the terrestrial carbon budget. Ecosystems, 10, pp. 171–184.
Davies-Colley, R. J., and Vant, W. N. 1987. Absorption of light by yellow substance in freshwater lakes. Limnology and Oceanography, 32, pp. 416–425.
Doxaran, D, Cerukuru, R.C.N., and Lavender S.J., 2005. Use of reflectance band ratios to estimate suspended and dissolved matter concentrations in estuarine waters. International Journal of Remote Sensing, 26(8), pp. 1763–1769.
Edler, L., Fernö, S., Lind, M.G., Lundberg, R., and Nilsson, P.O. 1985. Mortality of dogs associated with a bloom of the cyanobacterium Nodularia spumigena in the Baltic Sea. Ophelia, 24, pp. 103-109.
ESS method, 340.2. 1993. Total suspended solids, Mass balance, Volatile suspended solids. Environmental Sciences Section, 3, pp. 189–192.
Glibert, P.M., Seitzinger, S., Heil, C.A., Burkholder, J.M., Parrow, M.W., Codispoti L.A., and Kelly, V., 2005. The role of eutrophication in the global proliferation of harmful algal blooms. New perspectives and new approaches. Oceanography, 18, pp. 198-209.
Gower, J., King, S., Borstad, G. and Brown, L., 2005. Detection of intense plankton blooms using the 709nm band of the MERIS imaging spectrometer. International Journal of Remote Sensing, 26(9), pp. 2005-2012
Ferrari, G. M., and Tassan, S., 1999. A method using chemica oxidation to remove light absorption by phytoplankton pigments. Journal o. Phycology, 35, pp. 1090–1098
Gitelson, A., 1992. The peak near 700 nm on radiance spectra of algae and water – relationships of its magnitude and position with chlorophyll concentration, International Journal of Remote Sensing, 13(17) pp. 3367-3373.
Hallegraeff, G.M., 2003. Harmful algal blooms A global review. In: Hallegraeff G.M., Anderson D.M., Cembella A.D. (Eds.) Manual on harmful marine microalgae, pp. 1-22, UNESCO.
Horner, R.A., Garrison, D.L., and Plumley, F.G., 1997. Harmful algal blooms and red tide problems on the US west coast. Limnology and Oceanography, 42, pp. 1076-1088.
ISO 10260. 1992(E). Water quality – Measurements of biochemical parameters– Spectrophotometric determination of chlorophyll-a concentration. (Geneva, Switzerland: ISO): 1–6
Kutser, T., 1997. Estimation of water quality in turbid inland and coastal waters by passive optical remote sensing. Ph.D. Disertation, Tartu University Press
Kallio, K., T. Kutser, T. Hannonen, S. Koponen, J. Pulliainen, J. Vepsäläinen, T. Pyhälahti, 2001. Retrieval of water quality from airborne imaging spectrometry of various lake types in different seasons, The Science of the Total Environment, 268, pp. 59-77.
Kutser, T., A. Herlevi, K. Kallio, H. Arst, 2001. A hyperspectral model for interpretation of passive optical remote sensing data from turbid lakes, The Science of the Total Environment 268, pp. 47-58.
Kutser, T., Miller, I., Jupp, D.L.B., 2002. Mapping coral reef benthic habitat with a hyperspectral space borne sensor. Proceedings of Ocean Optics XVI, Santa Fe, 2002.
Kutser, T., Miller, I., Jupp, D. L. B., 2006. Mapping coral reef benthic substrates using hyperspectral space-borne images and spectral libraries. Estuarine Coastal and Shelf Science, 70, pp. 449-460
Kutser, T., Tranvik, L., Pierson, D.C., 2009. Variations in colored dissolved organic matter between boreal lakes studied by satellite remote sensing. Journal of Applied Remote Sensing, 3:033538, doi:101117/1.3184437.
Kutser T, 2009. Passive optical remote sensing of cyanobacteria and other intense phytoplankton blooms in coastal and inland waters. International Journal of Remote Sensing, 30, pp. 4401-4425.
Kutser, T., D. C. Pierson, K. Kallio, A. Reinart, S. Sobek, 2005, Mapping lake CDOM by satellite remote sensing. Remote Sensing of Environment, 94, pp. 535-540.
Kutser, T., D. C. Pierson, L. Tranvik, A. Reinart, S. Sobek, K. Kallio, 2005. Estimating the colored dissolved organic matter absorption coefficient in lakes using satellite remote sensing, Ecosystems, 8, pp. 709-720.
Kutser, T. 2004, Quantitative detection of chlorophyll in cyanobacterial blooms by satellite remote sensing. Limnology and Oceanography, 49, pp. 2179-2189.
Kutser, T., Vahtmäe, E., Paavel, P., 2012. Removing air/water interface effects from hyperspectral radiometry data.
Proceedings of MTS/IEEE Oceans’12 Conference, Yeosu,
Korea.
Landsberg, J.H. 2002. The effects of harmful algal blooms on aquatic organisms. Reviews in Fisheries Science, 10, 113-390. Matthews M.W., 2011. A current review of empirical procedures of remote sensing in inland and near-coastal transitional waters. International Journal of Remote Sensing, 32(21), pp. 6855-6899.
Lesser, M. P. and C. D. Mobley, 2007. Bathymetry, optical properties, and benthic classification of coral reefs using hyperspectral remote sensing imagery. Coral Reefs, 26, pp. 819-829.
McDonald, T.A., and Komulainen, H. 2005. Carcinogenicity of the chlorination disinfection by-product MX”, Journal of Environmental Science and Health, Part C Environmental Carcinogenesis and Ecotoxicology Reviews, 23, pp. 163–214.
Metsamaa, L., T. Kutser, N. Strömbeck, 2006, Recognising cyanobacterial blooms based on their optical signature: a modelling study. Boreal Environment Research, 11, pp. 493-506.
Mobley, C. D., and L. K. Sundman, 2001. Hydrolight 4.2 Users’ Guide. Sequoia Scientific, Inc., Redmond, WA, 87 pages.
Mobley, C. D., L. K. Sundman, C. O. Davis, T. V. Downes, R. A. Leathers, M. J. Montes, J. H. Bowles, W. P. Bissett, D. D. R.
Kohler, R. P. Reid, E. M. Louchard, and A. Gleason, 2005. Interpretation of hyperspectral remote-sensing imagery via spectrum matching and look-up tables. Applied Optics 44(17), pp. 3576-3592.
Sellner, K.G., Douchette, G.J., and Kirkpatrick, G.J., 2003. Harmful algal blooms: causes, impacts and detection. Journal of Indian Microbiology and Biotechnology, 30, pp. 383-406.
S. Sobek, G. Algesten, A.-K. Bergström, M. Jansson, and L. J. Tranvik, 2003. The catchment and climate regulation of pCO2 in boreal lakes, Global Change Biol. 9, pp. 630-641.
Tassan, S., and Ferrari, G. M., 1995. An alternative approach to absorption measurements of aquatic particles retained on filters. Limnolology andOceanography, 40, pp. 1358–1368
Tassan, S., and Ferrari, G. M., 2002. A sensitivity analysis of the “Transmittance-Reflectance” method for measuring light absorption by aquatic particles. Journal ofPlanktonResearch, 24(8), pp. 757–774.
Tranvik, L.J., Downing, J.A., Cotner, J.B., Loiselle, S.A., Striegl, R.G., Ballatore, T.J., Dillon, P., Finlay, K., Knoll, L.B., Kortelainen, P.L., Kutser, T., Larsen, S., Laurion, I., Leech, D.M., McCallister, S.L., McKnight, D.M., Melack, J.M., Overholt, E., Porter, J.A., Prairie, Y., Renwick, W.H., Roland, F., Sherman, B.S., Schindler, D.W., Sobek, S., Tremblay, A., Vanni, M.J., Verschoor, A.M., von Wachenfeldt, E., and Weyhenmeyer, G.A., 2009, Lakes and impoundments as regulators of carbon cycling and climate, Limnology and Oceanography, 54, pp. 2298-2314.
Acknowledgements
The study was supported by Estonian Science Foundation Grants ETF8654 and ETF 8576, Estonian Basic Research Grant SF0180009As11 and by the Swedish Research Council for Environment, Agricultural Sciences and Spatial Planning, FORMAS the project “The colour of water – interplay with climate, and effects on drinking water supply.”