THE POWER OF VIRTUAL GLOBES FOR VALORISING CULTURAL HERITAGE AND
ENABLING SUSTAINABLE TOURISM: NASA WORLD WIND APPLICATIONS
M. A. Brovelli a, P. Hogan b, M. Minghini a, G. Zamboni a
a Politecnico di Milano, DICA, Laboratorio di Geomatica, Como Campus, via Valleggio 11, 22100 Como, Italy -
[email protected], [email protected], [email protected] b NASA Ames Research Center, M/S 244-14, Moffett Field, CA USA - [email protected]
Commission IV, Working Group IV/5
KEY WORDS: Cultural Heritage, GIS, Three-dimensional, Virtual Globe, Web based
ABSTRACT:
Inspired by the visionary idea of Digital Earth, as well as from the tremendous improvements in geo-technologies, use of virtual globes has been changing the way people approach to geographic information on the Web. Unlike the traditional 2D-visualization typical of Geographic Information Systems (GIS), virtual globes offer multi-dimensional, fully-realistic content visualization which allows for a much richer user experience. This research investigates the potential for using virtual globes to foster tourism and enhance cultural heritage. The paper first outlines the state of the art for existing virtual globes, pointing out some possible categorizations according to license type, platform-dependence, application type, default layers, functionalities and freedom of customization. Based on this analysis, the NASA World Wind virtual globe is the preferred tool for promoting tourism and cultural heritage. This is because its open source nature allows unlimited customization (in terms of both data and functionalities), and its Java core supports platform-independence. Relevant tourism-oriented World Wind-based applications, dealing with both the Web promotion of historical cartography and the setup of a participatory Web platform exploiting crowd-sourced data, are described. Finally, the paper presents a project focusing on the promotion of the Via Regina area (crossing the border between Italy and Switzerland) through an ad hoc World Wind customization. World Wind can thus be considered an ideal virtual globe for tourism applications, as it can be shaped to increase awareness of cultural history and, in turn, enhance touristic experience.
1. INTRODUCTION
The use of the Web as a dissemination medium for maps can be regarded as a major advancement in cartography and opens many new opportunities, such as real-time maps, cheaper dissemination, more frequent and cheaper updates of data and software, personalized map content, distributed data sources and sharing of geographic information. It also encounters many challenges due to technical restrictions (low display resolution and limited bandwidth, in particular with mobile computing devices, many of which are physically small and use slow wireless Internet connections), copyright and security issues, reliability issues and technical complexity. While the first Web maps were primarily static, today’s Web maps can be fully interactive and integrate multiple media. This means that both Web mapping and Web cartography also have to deal with interactivity, usability and multimedia issues (Neumann, 2008). For several years geographic information has been represented on the computer in a bi-dimensional way, as natural evolution of the computerization of the classic 2D paper maps. With the growth of the 3D computer graphics and the spread of high- performance hardware (processing power, storage capacities, 3D-enabled video cards, etc.) the geospatial viewer started to show data in the three-dimensional aspects of their virtual geographic features. The first 3D geographic viewers were mainly developed by scientific and technical institutes for specific research purposes and provided 3D visualization of data usually restricted to a limited area of interest.
Nowadays, so-called virtual globes are a highly advanced evolution of these viewers, providing the ability to render terrain, imagery and vector datasets over a whole 3D digital
model of the Earth, with the freedom of exploration and the ability to visualize huge amounts of data.
The concept of Digital Earth was proposed by Al Gore (1999), who described the possibility for citizens to interact with a computer-generated multidimensional spinning virtual globe and to access vast amounts of environmental and cultural information. The idea was to help citizens understand the Earth and human activities as part of its history. A Digital Earth greatly helps this citizen interaction. The combination of the Web and access to geographic data has made possible the development of powerful virtual globes which now provide this Digital Earth. The terms Digital Earth and virtual globe are usually considered synonyms, although Digital Earth points most clearly to the unequivocally multiple experiences and knowledge we have, and continue to make, of the world, while virtual globe appears to be the more viable term for discussions of the applications’ software environment (Harvey, 2009). Virtual globes can be considered as purpose and multi-dimensional, not only 3D but also 4D if the temporal dimension is also considered. This geographic environment can represent any geo-localizable data in a nearly infinite range of scales, and where user is able to move freely around the globe dynamically changing the point of view and interacting with the information represented on the surface (Elvidge and Tuttle, 2008). Using a virtual globe it is possible for instance to show a spatial distribution of an environmental variable (e.g. temperature, pressure and concentration of a pollutant) around the entire Earth, and zoom into the city streets to show the detailed structure of an urban setting (e.g. position of environmental monitoring stations, 3D representation of polluting factories and related technological networks).
International Archives of the Photogrammetry, Remote Sensing and Spatial Information Sciences, Volume XL-4/W2, 2013 ISPRS WebMGS 2013 & DMGIS 2013, 11 – 12 November 2013, Xuzhou, Jiangsu, China
Virtual globes have been emerging in recent years thanks to their context capability and, at the same time, their ease of use which provides good user experience. In particular, they are becoming more and more important due to their intuitiveness of use, the faithful correspondence of information to the reality represented and their multi-disciplinary relevance.
The growth of increasingly accurate and detailed geographic data such as aerial and satellite images, digital elevation models and topographic maps, the increased Internet accessibility to these data provided by map-servers with standard protocols (by ISO and OGC) and the easiness of the virtual globes to be customized through the direct mapping of any geographically localized phenomenon (e.g. physical, social and environmental) have not only increased the popular use of these technologies, but have also offered great opportunities to improve geographic representations and scientific analysis.
The possibility of simultaneously geo-locating different kinds of information within a single 3D virtual environment opens many fields of use for these tools in those disciplines that depend on geographic data (i.e. education, archaeology, sociology, urban and environmental planning, etc.). Until not long ago, this data could only be textually represented using highly technical and specific tools such as Geographic Information Systems (GIS). Virtual globes are an excellent tool that extends the expressive power through a conceptual representation of GIS data in a more realistic and intuitive medium. At the same time, ease of access and use of these tools allows for sharing and communicating of information formerly “restricted” to only users of highly specialized software tools and often accessible only in highly specific scientific environments (Brovelli and Zamboni, 2012).
2. BACKGROUND ON VIRTUAL GLOBES
Nowadays, several 3D virtual globes are available. The number of ready-to-use applications and active projects focused on the development of virtual globe-based technology is continuously increasing due to the tremendous benefits they bring for multi-disciplinary use in both the scientific and business sectors. Some of the most popular virtual globes that are worth mentioning include Google Earth (http://www.google.com/earth/index.html), NASA Word Wind
(http://goworldwind.org), ESRI ArcGIS Explorer
(http://www.esri.com/software/arcgis/explorer) and ArcGlobe (http://www.esri.com/software/arcgis/extensions/3danalyst), Microsoft’s Bing Maps Platform
(http://www.microsoft.com/maps), TerraExplorer and
SkylineGlobe (http://skylineglobe.com), CitySurf Globe
(www.citysurf.com.tr), Erdas Virtual Explorer
(http://geospatial.intergraph.com), ossimPlanet
(http://trac.osgeo.org/ossim/wiki/OssimPlanet), QGIS Globe (http://hub.qgis.org/wiki/quantum-gis/Globe_Plugin), gvSIG3D (https://gvsig.org/web/projects/gvsig-desktop/devel/gvsig-3d), osgEarth (http://osgearth.org), Norkart Virtual Globe
(http://www.virtual-globe.info), Earth3D
(http://www.earth3d.org), Marble (http://edu.kde.org/marble), etc. Furthermore, recent developments in the Web Graphics Library (WebGL), a JavaScript API for rendering interactive 2D and 3D graphics within any compatible Web browser without the use of plugins, are leading to the birth of virtual globes entirely developed with this technology. Examples of WebGL-based virtual globes are Cesium (http://cesium.agi.com), WebGL Earth (http://www.webglearth.org), WebGL Globe (http://code.google.com/p/webgl-globe) and OpenWebGlobe (http://www.openwebglobe.org).
Virtual globes are available with different capabilities and characteristics: they differ from each other according to the philosophy of development, the technology used, the features implemented, the spatial coverage, and the typology of user. These products use different data sources for the layers represented on the globe (digital elevation models, satellite and aerial imagery, topographic maps, vector layers, etc.). This means they also differ for the temporal accuracy, visual quality of represented geographical features, and for supported formats used to represent grid, raster and vector data.
In this section it is not the authors’ intention to make an accurate census of all the existing virtual globes, but only briefly recall the main properties to be evaluated in order to select the most appropriate virtual globes for the given specific needs. The first main classification that distinguishes virtual globes is the license type. Some of them are available as free and open source software (e.g. NASA World Wind, ossimPlanet, osgEarth, Marble), while others are “closed” (code not available for the public) and released with proprietary licenses. Some of the latter require purchase of a license (e.g. ESRI ArcGlobe, SkylineGlobe, CitySurf Globe) while still others are available both with a freeware license (e.g. Google Earth free) or a paid license depending on the capabilities required (e.g. Google Earth Pro, Google Earth Enterprise). The second main feature that can be used to classify virtual globes is the platform required to run on. Speaking about traditional computers (desktop, notebook, and netbook) some of them require a specific operating system (e.g. ESRI ArcGIS Explorer, ArcGlobe and Erdas Virtual Explorer require Windows OS). Others can be installed on diverse platforms due to the availability of releases for each operating system (e.g. Google Earth is available for Windows, Linux, Mac) and still others are platform-independent due to the development technology used (e.g. NASA World Wind is written in cross-platform JAVA language; WebGL Earth, WebGL Globe, etc. are written in cross-platform HTML5 script language). Speaking about mobile devices, releases of some of the previous virtual globes are also available, usually with less functionality than the standard releases (e.g. Google Earth and NASA World Wind are available both for iOS and Android devices, Marble and CitySurf Globe for Android devices).
Besides the operating system, virtual globes can be differentiated according to the type of application: some are desktop applications and require a local installation (e.g. ossimPlanet, gvSIG3D, QGIS Globe, ESRI ArcGlobe, etc.), others are pure Web applications (e.g. the WebGL virtual globes), still others can be executed either by installing the application or directly as a Web application using specific browser plugins (e.g. Google Earth and NASA World Wind can be used as desktop or Web applications).
Other important features to take into account when choosing a virtual globe are the set of default geographic layers provided and the possibility of content customization.
Each virtual globe uses different data sources in order to represent geographic information: usually the default data are satellite (e.g. BlueMarble and Landsat) and aerial images, digital elevation models (e.g. SRTM and ASTER) and other common thematic maps like street maps (e.g. OpenStreetMap layer). In order to use virtual globes for specific applications, it is important to know the accuracy and the updating of the default layers, and the type (and format) of external data that can be loaded and visualized on the globe in addition to the base layers. Some virtual globes need to interact with specific proprietary data servers (e.g. Erdas Virtual Explorer), while others are able to read and display standard data formats used to transmit geographic data over the network (e.g. the OGC
International Archives of the Photogrammetry, Remote Sensing and Spatial Information Sciences, Volume XL-4/W2, 2013 ISPRS WebMGS 2013 & DMGIS 2013, 11 – 12 November 2013, Xuzhou, Jiangsu, China
KML/KMZ file format and the WMS protocol can be used with Google Earth, NASA World Wind, SkylineGlobe, etc.) and superimpose specific layers both in raster format (images and thematic maps) and vector format (placemarks, callouts, 2D and 3D geometries, etc.).
A last but not least important feature to be considered for virtual globes is the set of functionalities provided and the possibility to add new ones in order to customize the platform for specific applications. Usually virtual globes provide basic tools to visualize, integrate, communicate and disseminate geographic data. For this reason classical navigational functionalities are available (zoom-in, zoom-out, pan, rotate, dynamically navigation changing of the point of view, switch on/off of the layers, etc.). Typically, other tools like geometric measurement (position, distance, area, etc.), road route calculation, geocoding (finding associated geographic coordinates, often expressed as latitude and longitude, from other geographic data, such as street addresses) and reverse geocoding (coding of a point location to a readable address or place name) are already integrated. In order to customize the virtual globe, two different approaches can be adopted according to the tools provided to the developers.
The first one is to use high-level programming interfaces made available from the virtual globes through external Application Programming Interfaces (APIs). This approach does not require very high programming skills and it is the only method usable with proprietary virtual globes, where the engine-core is visible only as a “black box”. External APIs enable, with a scripting approach, the ability to programmatically interact with the features showed on the globe, i.e. draw and move geometries, drape images over the terrain, add 3D models, allowing one to build custom 3D map applications (e.g. Google Earth API, Bing Maps SDK, TerraExplorer native API). The second approach is to take advantage of the availability of the source code when the virtual globes are released with free and open source license. Having a full control of the application makes it possible to both improve the basic functionalities of the engine-core and to build new plugins for specific purposes. The great advantage of this approach is the possibility to implement complex analytical functionalities (not achievable using an external API) and to combine the power of 3D visualization with the computational power of the typical GIS functionalities inside a unique multi-dimensional geographic platform.
3. NASA WORLD WIND
For the present work, the authors decided to use NASA World Wind as a basic tool to show the usefulness of virtual globes for promoting cultural heritage and enabling sustainable tourism. The first feature taken into account was the open source nature of the software, something that would allow a high degree of customization. Moreover, the goal was to implement a platform-independent viewer directly executable on different operating systems and potentially accessible by a simple Web browser. These combined needs led to the choice of a virtual globe written in the Java language. These two features, and the need for a tool that can provide accurate data customization (local high resolution aerial imagery and digital elevation models) made NASA World Wind a good and viable solution.
World Wind is NASA’s open source virtual globe technology, providing the infrastructure for spatial data as a Software Development Kit (SDK). It is based on open standards and can be configured to accommodate any desired data format. The characteristic of being written in Java makes it platform-independent (software directly executable on different operating
systems) and usable like desktop application or accessible by simple Web browsers (like applet or via Java Web Start technology).
NASA World Wind is freely utilized by the world’s space agencies, local and national government agencies, commercial industry, including Fortune 100 companies, and others. It was conceived to work with large quantities of data and information, all of which can be stored on local disk or on remote data servers. The platform makes available a collection of pre-configured classes which project spatial data on a 3D virtual globe of Earth. This virtual Earth is composed of many satellite images: BlueMarble (BMNG 500m), i3-Landsat (15m), USGS Orthophoto (1m US only), USGS Urban Area Orthophoto (0.5 - 0.25m selected US city), MS Virtual Earth Aerial Imagery, etc. Some fundamental digital elevation models, like SRTM30Plus (30 arc-sec, ~900m), SRTM3 v2 v4.1 (3 arc-sec, ~90m), ASTER (~30m), USGS NED (~30m, ~10m US only), which are dynamically served by NASA and USGS WMSs (Web Mapping Services). Moreover, it is possible to access any OGC-compliant WMS server providing geo-referenced images and maps to be projected on the globe (code implementation is also made available by NASA) and the digital elevation models to be superimposed onto the geoid model which is implemented within the platform.
Finally, besides imagery and elevation data, it is possible to accurately locate on the globe and in its surrounding space both 2D objects such as lines, polygons, markers, callouts, multimedia viewers, and 3D objects built up from geometric primitives, as parallelepipeds, spheres, extruded polygons, etc. The complete freedom of customizing the presented data makes the platform suitable for any spatial data application, thanks to the possibility of controlling the quality and accuracy of both the horizontal component (by varying the texture) and the vertical component (by varying the digital elevation model). This NASA technology has gained standard recognition due to two very important criteria. One is the great trust and confidence the world community places in NASA. The other is the extraordinary talent NASA attracts and the passion with which these individuals carry out their mission. But to answer this question more directly, World Wind is based on open standards and yet is not limited to them. As open source, World Wind is able to continually respond to the changing needs of customer and community. Moreover, the international open source geospatial community and other open source projects, mutually influence the development and the success of NASA World Wind. Interoperability and the choice of Open Source Initiative (OSI) certified licenses allow different technologies to work together. This is a great strength of any open source geospatial software, NASA World Wind included.
The openness of the code allows the complete control of both the customization and the extensions required for creating the 3D model and all functionalities needed for interacting with the model itself. NASA World Wind allows developers to implement and constantly improve functionalities (analytical tools) in order to deal with changing needs and to increase sophistication of the analysis. These analyses will involve impact-assessment functionalities built into applications for repeated use under various scenarios for a very dynamic feedback of information. World Wind simply standardizes the infrastructure for this visualization. World Wind applications are also used for emergency response scenarios, such as by the US National Guard for Katrina and the US State Department following the Haiti earthquake.
A real-world interface can greatly enhance critical decision-making processes and World Wind facilitates that in unlimited ways. “Real-world visualization” of these functionalities
International Archives of the Photogrammetry, Remote Sensing and Spatial Information Sciences, Volume XL-4/W2, 2013 ISPRS WebMGS 2013 & DMGIS 2013, 11 – 12 November 2013, Xuzhou, Jiangsu, China
supports a myriad of essential information, such as access routes (egress and ingress), drainage patterns for precipitation conditions, disaster response management for storms, earthquakes, etc., traffic patterns evaluation and improvement, measuring impacts of local population and tourism to the cultural sites and neighboring vicinity, etc. All of these considerations are crucial to preserving cultural heritage sites and the quality of the experience in visiting them.
3.1 World Wind extensions
Several relevant examples of collaborative improvements of World Wind are available. Improvements can be carried out directly on the platform engine-core or developing new plugins that extend the functionalities of the virtual globe.
A significant example of the first approach is the project Gaea+ developed by XLAB (http://www.gaeaplus.eu/en/open-source), which extends the World Wind Java core with features crucial for advanced real-time rendering of geospatial information, including optimized render-to-texture capabilities enabling visualization of large vector datasets, GLSL Shader support to make atmospheric effects, cast photo-realistic shadows, render water surface with supplied shaders, custom visual effects, deferred rendering, and a flexible WFS & GML support. Another significant example of World Wind improvement due to its open source paradigm is the GeoJModelBuilder project
(http://sourceforge.net/p/geopw/wiki/home), where
functionalities typically delegated to sophisticated GIS are integrated directly into a virtual globe. It couples geoprocessing Web services and Sensor Web services to support geoprocessing modeling and environmental monitoring. The main goal of GeoJModelBuilder is to bring an easy-to-use tool to the geoscientific community with tools that allow users to integrate various geospatial services to visually generate workflows, and interact with the workflows in a virtual globe environment. It also allows users to audit trails of workflow executions, check the provenance of data products, and support scientific reproducibility.
These two projects are just some of the examples of how it is possible to extend the power of World Wind using its SDK. They are part of the projects developed at the NASA World Wind Europa Challenge, an international competition born to provide sustainable solutions that can serve local, regional, national or international interests of the European community (http://eurochallenge.como.polimi.it).
4. WORLD WIND APPLICATIONS FOSTERING TOURISM AND CULTURAL HERITAGE
The authors have a significant amount of experience in the usage of World Wind virtual globe for applications supporting tourism and cultural heritage. This background is meaningful for properly addressing the complex tasks of the Via Regina project described in Section 5.
World Wind can provide a fully-realistic 4D visualization of cultural heritage sites, thus greatly enhancing tourist experience. Such an application is exemplified by the Web C.A.R.T.E. project (Brovelli et al., 2011; Brovelli et al., 2012a), which provides access to historical cadastral maps dating back up to the XVIII century. Once optimally georeferenced (Brovelli and Minghini, 2012), the maps are rendered on the virtual globe and overlapped to the Italian orthophoto (with pixel resolution of 0.5m) and the local digital elevation model (with ground resolution of 20x20m). Besides the traditional 3D-navigation of maps and the access to the location information (i.e. latitude,
longitude, elevation of the point on the globe and altitude of the point of view), users can also exploit a temporal slidebar to visualize the evolution of the region over time (Brovelli et al., 2012b). In fact, when choosing a historical epoch on the slidebar, all the maps which were existing up to that time are turned on by default in their same temporal order, i.e. a map dating back to the time t+1 lays over a map dating back to the time t (see Figure 1).A second slidebar allows users to adjust map transparency, making it possible to effectively compare historical maps both with each other and with current cartography.
Figure 1. 3D visualization of a historical cadastral map selected through the temporal slidebar
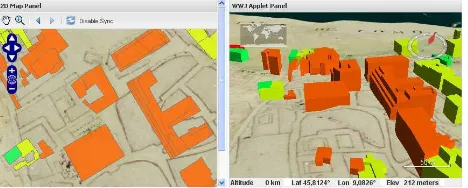
An evolution of the Web C.A.R.T.E. system is represented by a multi-frame and multi-dimensional platform, which allows users to visualize time-varying features on synchronised 2D and 3D panels (Valentini et al., 2012). The application provides access to historical maps of Como city, which are superimposed on the current local orthophoto and the topographic map showing city buildings. A main innovation is represented by the geographic synchronization of the panels, which allows users to look at the same portion of the Earth both on the 2D and the World Wind-based 3D viewers. Available information about the buildings height, year of construction and year of demolition, allows users to both visualize the 3D city model on top of the globe and to filter the buildings visualization according to different criteria. This means the user can visualize all the existing buildings for a certain year, or just the buildings which were built during a specified time span (see Figure 2). A proper customization of World Wind virtual globe has therefore turned it into a fully-working 4D Web viewer.
Figure 2. Synchronised 2D and 3D visualization of time-filtered Como buildings superimposed on a historical map of the city
A recent application named PoliCrowd (http://geomobile.como.polimi.it/policrowd) finally turns the
International Archives of the Photogrammetry, Remote Sensing and Spatial Information Sciences, Volume XL-4/W2, 2013 ISPRS WebMGS 2013 & DMGIS 2013, 11 – 12 November 2013, Xuzhou, Jiangsu, China
World Wind virtual globe into a crowd-sourced platform devoted to tourism and cultural heritage (Brovelli et al., 2013). Using common mobile devices (e.g. smartphones and tablets), users can report Points Of Interest (POIs), e.g. places of worship, points with panoramic view, transport stations and monuments, and visualize them on the virtual globe (see Figure 3). Once registered to the platform, users can also contribute to the POIs characterization by adding comments and multimedia data, i.e. images, videos and audios. PoliCrowd users can even connect to any WMS server and create customized mash-ups. They are also able to export these projects, keeping track not only of the used layers, but also of the position (latitude, longitude and altitude) and the camera orientation of the user point of view on the globe. All WMS layers accessed and projects exported are saved by the application and remain available for the whole PoliCrowd community.
Figure 3. Example of POI 3D visualization and query
5. VIA REGINA PROJECT
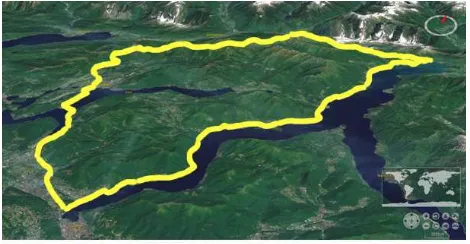
Via Regina, overlooking the West coast of Lake Como in the Northernmost part of Italy (see Figure 4), has been a trade route since the ancient Roman times and an old pilgrim route of cultural exchange between Italy and Switzerland. Nice walking route, along the most well-known Via Francisca and Via Spluga (http://www.viaspluga.com/itinerario.php?l=en&id=16) with which it forms a continuum, it is a fundamental transalpine system of soft mobility links, whose touristic potential has not been adequately grasped so far. The first map depicting Via Regina, from which its historical importance can be deciphered, is the Peutinger Map, whose origin dates back to the fourth or early-fifth century. In Figure 5 a detail of this map is shown, where Via Regina is drawn as a red stepped line.
Figure 4. The area covered by the Via Regina project
The project “The Paths of Via Regina” aims at highlighting the cross-border area covered by the paths themselves starting from
the values of solidarity, hospitality, cooperation between peoples and from the rediscovery of the common European cultural identity through the artistic and cultural heritage. This area has a strong potential for increasing tourism, which has not yet been fully expressed. Main beneficiaries of the project are the local communities, invited to rediscover and enhance the potential of their territories by combining their historical traditions with the innovations and devices made available by geo-information technology, which also promote enriching local knowledge through participation and collaboration. Secondly, the aim of the project is to reconnect this system of pedestrian paths with wider thoroughfares in the great tradition of European cultural routes (for example Via Francigena). The travellers, local and foreign, are encouraged to undertake a safe journey to appreciate the aesthetics and full immersive enjoyment of nature and landscape.
Figure 5. Detail of the Peutinger Map, in which Via Regina is represented as a stepped red line north of the lake
The project was born from the synergy between experts in cultural heritage, landscape designers, local agencies and experts in geomatics. One of the basic ideas is that the knowledge of the territory is fundamental for its promotion and protection and that the modern techniques of Web mapping can help in this regard. Specifically the possibilities of multi-dimensional visualization enrich the perception of immersion in the territory providing a richer experience to the virtual traveller. The most interesting aspect, however, is given by the new Internet participatory GIS: the use of geo-services from any computers or mobile devices is no longer passive, because with the new approach of GeoWeb 2.0 users are given the opportunity to enter their own multimedia georeferenced contents (photos, documents, travel notes), also collected along the route. The crowd-sourced information is then overlaid to the base maps, the aerial orthophotos and the satellite imagery made available, as geo-services, by institutional administrations (INSPIRE Geoportal http://inspire-geoportal.ec.europa.eu,
Italian national Geoportal
http://www.pcn.minambiente.it/GN/index.php?lan=en,
Lombardy Region Geoportal
http://www.cartografia.regione.lombardia.it/geoportale/ptk, Ticino Geoportal http://ww.tigeo.ch). Holding mobile devices, the tourist can discover the territory by walking it physically, while at the same time increasing possibilities for knowledge by means of georeferenced augmented reality instruments through which information about the history and culture of the place are also accessible. At the same time it can also contribute to the local knowledge, adding important aspects or details that had previously escaped the community. These instruments are therefore important not only for navigation, but also for monitoring and safeguarding collective land and its culture. The
International Archives of the Photogrammetry, Remote Sensing and Spatial Information Sciences, Volume XL-4/W2, 2013 ISPRS WebMGS 2013 & DMGIS 2013, 11 – 12 November 2013, Xuzhou, Jiangsu, China
Via Regina and the multiplicity of its related paths can be an important example of the potential of the new multidimensional geospatial technologies.
NASA World Wind, as it can be guessed from the examples in Section 4, is the ideal tool to be considered for setting up the Via Regina geoportal. Many functionalities are already available in the core, the source code released publicly by NASA. Some of these need to be customized and other will be implemented within this project. The connection to the rich geo-services of the public administrations (Lombardy, Ticino, etc.) guarantees an excellent contextualisation of the paths. Moreover, KML files as well as GPS files can be uploaded and displayed. Paths can be interactively drawn over the terrain surface. The terrain itself is represented with high detail due to the possibility to connect to a specific WMS server providing the LiDAR high resolution digital elevation model (2x2m) available in the area. The terrain section (along the Via Regina’s paths or along any profile drawn by the user) can be added as a real-time layer, showing the degree of difficulty of the climb via details such as start and end elevation, slope, etc. In the case of the walking paths other characteristics, such as their level of difficulty, their condition and the length of the footpath are shown. All positions and view angles for the relevant paths are saved into a permanent cookie on the local computer so that NASA World Wind flies to that location when the user double-clicks on one of them in the list of available paths.
The historical maps discussed in Section 4 can be overlaid in order to analyse the evolution in time of the paths and of the surrounding area. Cultural and natural heritage (archaeological sites, historic towns, monuments, buildings both religious and secular, etc.) will be reported in the map at different level of detail from simple marks with balloons up to 3D KML models. Multimedia contents (images, audios, videos, etc.), as previously mentioned in the PoliCrowd example, can also be inserted by users according to the GeoWeb 2.0 paradigm. Besides the natural, cultural and historical description, all the relevant touristic information (e.g. lodgings, restaurants, typical local shops) will be located in the multi-dimensional geoportal, which will be therefore a practical tool to make the discovering of the area easier.
6. CONCLUSIONS
Virtual globes have been changing the way people experience the world. This paper investigated the potential for exploiting this innovative technology to promote tourism and enhance cultural heritage. Virtual globes can be used to greatly increase awareness of the community to the rich cultural history of their local, as well as share this with the larger community and thereby highlight these wonders for tourists and further promote the experience for the casual visitor. Virtual globe technology can also be used to better manage the local resources in order to facilitate tourism and to better preserve these valuable resources in ways that enhance the experience for tourism. This might involve considerations from evaluation of drainage patterns to location of rest stops and ideal viewing areas. Involvement of local communities is crucial and, thanks to the current approach of GeoWeb 2.0, virtual globes easily extend that opportunity for the entire community to continually participate in adding finer detail to the cultural heritage information and be involved in the preservation of this rich historical resource. The paper provided examples of such applications built with the open source NASA World Wind virtual globe, which proved to be a brilliant tool for supporting touristic and cultural experience.
REFERENCES
Brovelli, M.A., Minghini, M., Valentini, L., 2011. Web Services and Historical Cadastral Maps: the first Step in the Implementation of the Web C.A.R.T.E. System. In: Advances in Cartography and GIScience, Volume 2. Springer Berlin Heidelberg, pp. 147-161.
Brovelli, M.A., Minghini 2012. Georeferencing old maps: a polynomial-based approach for Como historical cadastres. e-Perimetron, 7(3), pp. 97-110.
Brovelli, M.A., Zamboni, G., 2012. Virtual globes for 4D environmental analysis. Applied Geomatics, 4, pp. 163-172.
Brovelli, M.A., Minghini, M., Giori, G., Beretta, M., 2012a. Web geoservices and ancient cadastral maps: the Web C.A.R.T.E. project. Transactions in GIS, 16(2), pp. 125-142.
Brovelli, M. A., Minghini, M., Zamboni, G., 2012b. Valorisation of Como historical cadastral maps through modern web geoservices. In: ISPRS Annals of the Photogrammetry, Remote Sensing and Spatial Information Sciences, Volume I-4, XXII ISPRS Congress, Melbourne 25 August - 1 September 2012, pp. 287-292.
Brovelli, M.A., Minghini, M., Zamboni, G., 2013. Participatory GIS: Experimentations for a 3D Social Virtual Globe. In: The International Archives of the Photogrammetry, Remote Sensing
and Spatial Information Sciences, Volume XL-2/W2, ISPRS
8th 3DGeoInfo Conference & WG II/2 Workshop, 27-29 November 2013, Istanbul, Turkey (in press).
Gore, A., 1999. The Digital Earth: understanding our planet in the 21st century. Photogrammetric Engineering and Remote Sensing, 65(5), p. 528.
Harvey, F., 2009. More than Names – Digital Earth and/or Virtual Globes? International Journal of Spatial Data Infrastructures Research, Vol. 4, pp. 111-116.
Neumann, A., 2008. Web Mapping and Web Cartography. In: Shekar, S., Xiong, H. (eds.) Encyclopedia of GIS. Springer, pp. 1261-1270.
Elvidge, C.D., Tuttle, B.T., 2008. How virtual globes are revolutionizing earth observation data access and integration. In: The International Archives of the Photogrammetry, Remote Sensing and Spatial Information Sciences, Vol. XXXVII, Part B6a, Bejing, pp. 137-140.
Valentini, L., Brovelli, M.A., Zamboni, G., 2012. Multi-frame and multi-dimensional historical digital cities: the Como example. International Journal of Digital Earth, iFirst article, ISSN 1753-8947 print ISSN 1753-8955 online, Taylor & Francis, DOI:10.1080/17538947.2012.739662, pp. 1-15.
ACKNOWLEDGMENTS
This research has been partially funded by the INTERREG “I cammini della Regina - Percorsi transfrontalieri legati alla Via Regina (The paths of Regina - Crossborder paths departing from Via Regina)” 2007-2013 project.
International Archives of the Photogrammetry, Remote Sensing and Spatial Information Sciences, Volume XL-4/W2, 2013 ISPRS WebMGS 2013 & DMGIS 2013, 11 – 12 November 2013, Xuzhou, Jiangsu, China