HIGH-PERFORMANCE VISUALIZATION OF UAS SENSOR AND IMAGE DATA WITH
RASTER MAPS AND TOPOGRAPHY IN 3D
Daniel Stødlea,∗, Nj˚al T. Borcha
and Rune Storvolda
a
Norut (Northern Research Institute), Tromsø Science Park, Tromsø, Norway (daniel, njaal, rune.storvold)@norut.no
KEY WORDS:Visualization, 3D, cross-platform, virtual globe, UAV, realtime image mapping
ABSTRACT:
The large amounts of data collected during a typical flight with an unmanned aerial vehicle creates challenges for rapid analysis and inspection. A single two-hour flight can collect about 7200 images if the camera captures at 1 Hz, yielding about 20 GB of data. Additional instruments and sensors all add to the size and complexity of the dataset generated by a flight. Efficient visualization of data is one way to deal with the resulting complexity. This paper presents Norut Geo Viz, a system for visualizing data from unmanned aerial vehicles both in realtime and after landing in 3D on a virtual globe. The system has been developed from the ground up to provide control and customizability of the resulting visualization. The architecture, design and implementation of the system is presented, as well as experiences using the system for visualization in the field during flight campaigns conducted by Norut.
1 INTRODUCTION
Unmanned aerial vehicles (UAVs) can collect potentially large amounts of data from onboard sensors and instruments during flight. While airborne, most of the data is typically stored on-board while a small subset of the data is transmitted to the ground control station over available carriers. Existing ground control stations such as Micropilot’s Horizon or QGroundControl used by ArduPilot offer limited capability for visualizing flights, typi-cally displaying the UAV’s position on a flat map. Further, sup-port for retrieving, verifying and visualizing data from custom onboard instruments is limited or non-existing.
Flight campaigns can be expensive, and it is important for oper-ators to verify that they are acquiring the data they expect. For instance, flying a pattern over an area only to discover that the UAV flew at too high an altitude for a laser distance instrument to receive the reflections needed to estimate distance from the ground, or flying with a camera permanently set out of focus, is frustrating and if not discovered early on can lead to a failed flight mission and wasted time. Further, being able to verify that the on-board instruments cover the desired area during flight is essential to discover if in-flight modifications to the patterns being flown need to made.
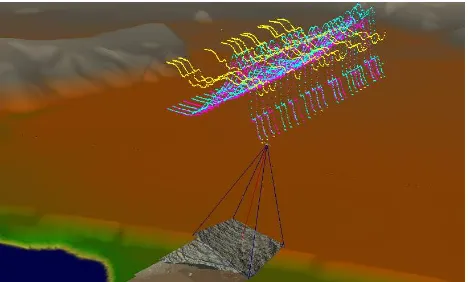
Figure 1: Screenshot from Norut Geo Viz, visualizing a flight conducted near Berlev˚ag, Norway in 2012.
This paper presents Norut Geo Viz (NGV), a cross-platform sys-tem that visualizes sensor and instrument data from UAVs in
combination with different raster maps and topographic data in 3D on a virtual globe. The system enables visualization in real-time during flight and allows for rapid data analysis after land-ing. During flight, NGV fetches a subset of the data collected by the UAV to visualize the UAV’s flight path, images captured by onboard cameras, and other instrument data, such as data from spectrometers or laser distance measurements. It also estimates the area covered by the instruments carried by the UAV.
Figure 1 shows an annotated screenshot from the visualization. The UAV is represented by a 3D model of the aircraft. Trailing the aircraft, one or several graphs can be rendered. These graphs represent various sensor or instrument values. The graph displays the value of an instrument or sensor at the location where the mea-surement was made, optionally interpolating the values between timesteps. In the figure, the visualized value is GPS speed. Im-ages captured by the UAV are mapped to the ground based on the camera’s intrinsic parameters and estimates the extrinsic param-eters from the UAV’s position and attitude at the time of capture. The area covered by the UAV’s camera is visualized as the cam-era view frustum.
2 SYSTEM ARCHITECTURE
The CryoWing fleet of UAVs operated by Norut include aircraft based on the Cruiser 1 and Cruiser 2 airframes1 and the Sky-walker X-8 airframe. The CryoWings share a common system architecture, as illustrated in Figure 2.
The autopilot is treated as a black box. Data to and from the autopilot is relayed through the payload control software, which acts as a proxy between the autopilot and the ground station. This decoupling enables the payload to redirect traffic through the ra-dio link that at any given time is the most reliable.
The payload computer is connected to a range of instruments and sensors. Instruments include cameras, infrared cameras, spec-trometers and lasers, while sensors include an IMU, a GPS, sen-sors for measuring fuel consumption, power draw and engine RPM. During flight, the payload logs data from instruments and sensors, and periodically sends status reports to the ground sta-tion. The payload also manages the available communication links. The links used include Iridium satellite modems, 3G/Edge modems, MicroHard radio and WiFi, with typical flights using
1
Payload Computer
Figure 2: The overall system architecture of Norut’s unmanned systems.
1-3 separate links. In addition, the payload provides a web server that can be accessed from the ground either by operators or soft-ware. This web server serves logs, status, sensor and instrument data upon request. The payload runs Linux on a small form-factor x86 computer in the Cruiser 1 and 2 airframes, and Linux on an Odroid ARM-based computer in the X-8 airframe.
The ground station uses a number of computers to run the neces-sary ground station software with attached communications hard-ware. The software consists of four main components: (i) Ground station control; (ii) a database; (iii) a mission data web server and (iv) autopilot software. The ground station control software ceives data from the aircraft and logs it to the database. It also re-sponds to dial-ins from the various modems and forwards traffic between the autopilot software and the aircraft. The mission data web server provides access to data stored in the database, and also serves as a proxy to the web server running on the aircraft. This enables actions such as requesting images from the aircraft and caching them locally for visualization or other purposes, with-out having to utilize bandwidth to fetch the same image from the UAV more than once. It also isolates ground-based clients, such as Norut Geo Viz, from the details of communicating with the aircraft.
The visualization’s interface to a given flight is through the mis-sion data web server. The mismis-sion data web server serves data from the ground control station during flight, and from data stored in the aircraft’s database after landing. The visualization runs on any number of computers or tablets.
3 THE VISUALIZATION
The visualization is at its core a custom 3D rendering engine tai-lored for rendering georeferenced data of different kinds: Raster maps and elevation data as well as functionality for incorporating, animating and rendering live or stored flight data, 3D models, im-ages and various custom instrument data.
The visualization relies on several different geographic datasets to effectively visualize a flight. The datasets have either global or regional coverage. The base elevation layer consists of one global (U.S. Geological Survey, 1996) and one near-global elevation dataset (U.S. Geological Survey, 2006), with a global raster layer based on the Blue Marble Next Generation dataset (St¨ockl et al., 2005). Additional global or regional raster and elevation layers are supported. In particular, the visualization currently employs high-resolution elevation and raster data covering Norway and Svalbard from the Norwegian Mapping Authority and the Nor-wegian Polar Institute. Additional online raster map sources can also easily be incorporated, as well as custom raster layers based on georeferenced satellite or aerial images. A custom data server
that handles merging and reprojection of elevation and raster data layers has also been developed as part of the visualization system.
0
1
2 Level of detail
Figure 3: The level of detail (LOD) pyramid. Higher LODs cover the same area, but at in-creasingly higher resolutions.
Raster and elevation data is structured as a pyramid with increasingly higher lev-els of detail (LOD) toward the bottom, as illustrated in Figure 3. The rendering engine mimics this struc-ture as a quad-tree scene graph. Each LOD consists of22ntiles, where n is the LOD. As the LOD goes up, the resolution of the asso-ciated LOD increases. For instance, at LOD zero, the Earth can be represented with a single 256x256 pixel image. At LOD 1, the number of image tiles is 4, for a total resolution of 512x512. An overview of level-of-detail approaches can be found in (Luebke et al., 2003).
3.1 Design
Figure 4 shows the visualization’s design. The visualization com-prises a number of threads with different responsibilities. The main thread is the animation, input and rendering thread. It han-dles input from the user that moves the visualization’s view and otherwise enables users to interact with the visualization’s inter-face, animates objects and renders the full scene at a target frame rate of 60. When the visualization’s view changes, new data be-comes visible. To fetch the data, requests are created and passed to the data fetch threads. Once new data is available, the resulting imagery/geometry/flight data is incorporated into the rendering.
The data fetch threads handle requests from other parts of the vi-sualization, typically the main thread. For cacheable data, such as raster map images or elevation data, the request is first checked against a local cache that resides on the filesystem of the com-puter or device running the visualization. If the data isn’t cached or isn’t cacheable, the request is sent to the target server host-ing the original data. Data servers include the mission data web server that serves data from a flight, online map servers and the custom elevation and raster data server.
Data Fetch Threads
HTTP
Mission Data Server
Raster and Elevation Data Cache
Local/Internet Elevation and Raster Data Server Internet
Public Raster Map
Sources HTTP Image decompression
and geometry construction threads
Display
Database
Visualization
Animation, input and rendering
HTTP
Figure 4: The visualization’s design.
into data structures used by the visualization to keep track of the aircraft and its instruments. By handling these tasks on secondary threads, the visualization system avoids blocking the rendering thread for potentially time consuming tasks and thus improves on the visualization’s frame rate.
To reduce memory usage, image and elevation tiles are deallo-cated from memory when they haven’t been used for rendering in the last 0.5-1.5 seconds. The exact threshold varies depend-ing on the target platform. iPads and iPhones have less memory than typical laptops or workstations, and thus require more agres-sive management of data that isn’t currently being used actively by the visualization. The tradeoff is one of network usage and computation versus in-memory caching of already fetched data.
3.2 Implementation
Norut Geo Viz has been developed from scratch in C++ using OpenGL 3.2/OpenGL ES 2 for rendering. At time of writing, NGV runs on Mac OS X 10.8, iOS 6 and Ubuntu Linux 12.04 LTS. Figure 5 shows a photograph of NGV visualizing a flight on an iPad.
Figure 5: Norut Geo Viz running on an iPad.
3.2.1 Flight data Flight data both on the aircraft and on the ground station is logged to two separate MySQL databases. Data is served by the mission data web server, which is a small python script that accepts requests over HTTP and performs queries on the local database tables based on the requests it receives. The query results are serialized as JSON before being sent back to the client. The mission data web server also serves images stored in the local filesystem, potentially requesting the images from the aircraft’s web server during live flights. Images can be scaled
down before transmission, which is important for reducing band-width usage on the link between the aircraft and the ground sta-tion during flight.
The visualizer sends requests to the mission data web server to fetch flight data. The system begins by requesting the available timestamp range for a given flight and assigns its current visu-alized timestamp at the end of the timestamp range. The flight can either be in progress or a stored flight. In either case, the system will poll the mission data web server once per second to determine if the timestamp range has changed. As the visualized timestamp changes, either as a result of user interaction (such as skipping forwards or backwards in the timestamp range) or au-tomatically (following wall-clock time), the system will request data for a time window of±180seconds around the current visu-alized timestamp.
The mission data web server responds with data covering the requested timestamp range, which the system then proceeds to parse and insert into a number of interpolators. An interpolator in this context is a map using the timestamp as key and the sensor value as its value, combined with a function for fetching that sen-sor’s value at a given timestamp. Interpolation is used to report a value for a given visualized timestamp. If interpolation is dis-abled, the closest sensor value for a given timestamp is returned, otherwise linear or cubic interpolation is used.
To map an aerial image to the ground, the visualization gets the aircraft’s position, yaw, pitch and roll at the time when the image was taken from the associated interpolators. These values enable the camera’s extrinsic parameters to be estimated. Combining the extrinsic parameters with the camera’s intrinsic parameters enable construction of a view frustum. Rays from the view frus-tum’s origin2towards the view frustum’s corners are then inter-sected with the terrain meshes to determine the latitude, longitude and elevation of each of the image’s four corners. These coordi-nates are used to render the image at the appropriate location on the ground.
A similar approach to that of mapping images to the ground is used to check laser distance measurements. A ray is cast from the aircraft’s position and rotated according to the aircraft’s yaw, pitch and roll toward the ground. This produces an intersection with one of the terrain meshes and enables calculation of the air-craft’s distance from the ground along the same vector that the laser distance measurement instrument is pointing. Depending on the quality of the underlying elevation data, this enables quick verification of laser distance measurement results.
Figure 6: Spectrometer measurements from Ny- ˚Alesund on Sval-bard.
A rendering of spectrometer data is shown in Figure 6. Spec-trometer data is rendered as a set of points. Measurements are
2
rendered at the location where it was made, tilted and oriented according to the aircraft’s yaw, pitch and roll.
3.2.2 Image mosaics The visualization system can output geo-referenced image mosaics at arbitrary resolution for any given flight. To build image mosaics quickly and without requiring vast computational resources, the system georeferences flight im-ages using the same approach as used for mapping imim-ages to the ground during flight/after landing. The system then uses each im-age’s latitude and longitude corner points to create a 2D bounding box encompassing all images taken during a flight. The user then decides on an output image resolution (in pixels). To create the output image, the system divides the image into 1024x1024 pixel tiles. Each tile is processed in sequence, until the entire image has been constructed. Every image that overlaps a given tile is fetched from the mission data web server, and rendered into an OpenGL framebuffer object (FBO). When a tile is fully rendered, pixels from the tile are read back from the FBO and written to the appropriate part of a tiled TIFF image.
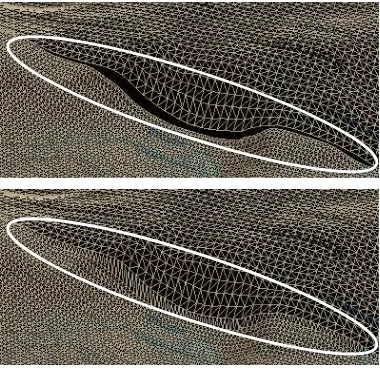
Figure 7: A crop from two image mosaics created using images from the same flight.
During rendering, images can be filtered based on different crite-ria. For instance, images with little color variance can be deemed as being “taken in the clouds” and ignored, or images taken while the aircraft is turning can be ignored based on pitch and roll thresholds. Figure 7 shows a crop from two image mosaics gen-erated during an oil spill exercise conducted near Berlev˚ag, Nor-way. The left mosaic has not been filtered for cloud-images, while in the mosaic on the right most cloud-images have been automatically removed.
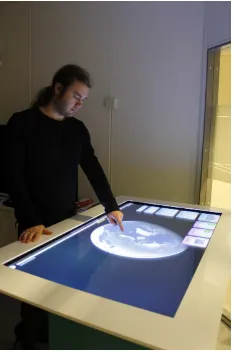
3.2.3 Input and camera control The visualization can be con-trolled either using a mouse and keyboard with “standard” first-person-gaming controls or using multi-touch gestures on either a trackpad, tablet display or table surface. Figure 8 shows the vi-sualization running on a multi-touch table. The table’s operating system is Linux, and uses TUIO (Kaltenbrunner et al., 2005) to route multi-touch input to the visualization.
A virtual camera abstraction is used to control what the visual-ization renders and how the rendering is projected. The result is a clipped-pyramid view frustum, with six sides: A near and far plane, as well as planes for the left, right, top and bottom parts of the display. The camera has a position and perpendicular vectors pointing up, left and along the view direction of the camera.
3.2.4 Culling and selection of LOD The visualization uses view frustum culling and view-dependent level of detail to re-duce the amount of geometry and the number of textures that need to be rendered for a given frame. For each frame, starting at the root of the quad-tree scene graph, the system walks the graph recursively, checking the bounding spheres/boxes of each scene node against the current view frustum. Any node whose bounding sphere/box falls outside the view frustum is culled. All descen-dants of such tiles are also culled, since any child of a scene graph
Figure 8: The visualization running on an Archimedes Exhibi-tions SessionDesk 2.0 multi-touch table.
node must be contained in the parent’s bounding sphere/box. Any nodes that intersect or are fully contained by the view frustum are added to a “render set” if they meet the level of detail criteria; oth-erwise, culling continues another level down in the quad-tree. At the end of this process, a set of tiles to render is produced at their appropriate levels of detail.
The criteria used to select which level of detail to render a partic-ular part of the scene graph at are as follows. First, a minimum level of detail is enforced, ensuring that the Earth appears as a sphere even when viewed from far away. The second criterion tests whether the current camera position is within an enlarged bounding sphere of the tile being evaluated, and if so increases the level of detail. Finally, the distance from the camera to the tile’s center is computed and checked against a look-up table of log-based thresholds indexed by the current node’s level of detail. If the distance is above the threshold, the level of detail for that part of the scene graph is increased. In contrast to for instance Google Earth (Google, Inc., 2005), the level of detail is not se-lected based on the number of pixels a given tile would occupy on screen if rendered. The reason for this is that the pixel-based approach fails when the camera’s view direction is perpendicular to the ground and the camera’s position is close to the ground.
3.2.5 Terrain meshes Figure 9 illustrates a common issue when rendering neighbouring terrain meshes at different levels of detail. Due to the lower LOD used to render the upper mesh, gaps appear between the high-resolution mesh and the low-resolution mesh. A similar issue occurs with meshes at identical LOD, due to precision errors when computing the final position of a given vertex on the GPU.
The visualization handles gaps and cracks in neighbouring meshes after culling, by shifting the positions of edge vertices in the high-resolution mesh to match those of the lower-high-resolution mesh us-ing linear interpolation. For meshes at identical resolution, edge vertices are copied directly from one of the meshes to the other. The results are stored in video memory until a tile is deallocated. The runtime cost of using the technique is sufficiently low to en-able its use even on porten-able devices like iPads or iPhones.
Figure 9: Realtime stitching of terrain meshes at different levels of detail.
for each tile is selected using the main virtual camera. Two addi-tional virtual cameras are created, offset slightly left and right of the main camera. This is done to avoid selecting different levels of detail for textures and terrain meshes for the two viewpoints. The two renderings are done at half the horizontal resolution of the regular viewport, using the virtual cameras for the left and right eye.
Figure 10: Shadow casting in Norut Geo Viz. The model of the bridge is made by Bent Ebeltoft, and is available from the Trimble 3D warehouse. The box buildings are generated based on polygons extracted from the Norwegian Mapping Authority raster map layer.
Given a date and time of day, the visualization can simulate the sun’s position to cast shadows from terrain and objects onto the ground. Objects on the ground can come from custom 3D mod-els, derived from raster map layers or be imported from Collada or KMZ-models3, such as those contributed by users to Trimble’s 3D warehouse and used by Google Earth. Shadow casting hap-pens in realtime using a technique known as Variance Shadow Mapping (Donnelly and Lauritzen, 2006). The scene is rendered twice for each frame, once from the point-of-view of the sun, and the second time from the virtual camera’s viewpoint. A GPU shader uses data from the first rendering pass to do probabilistic tests for whether a given fragment is obscured by a shadow caster. An example of this is shown in Figure 10, where a model of the Tromsø bridge and box building models cast shadows onto the
3
The Collada-parser was developed from scratch, and does not support the full feature set of the Collada standard. KMZ-files are used to embed Collada 3D models and georeference them.
terrain.
4 DISCUSSION AND EXPERIENCES
Norut Geo Viz is a fully custom visualization system implemented from scratch. The motivation for developing the system from scratch rather than relying on already existing visualization sys-tems is control. Developing from scratch gives control over all implementation choices that in turn affect all aspects of the visu-alization. It makes it possible to understand the resulting system’s performance, and make the appropriate tradeoffs for the “special case” of visualizing UAV flights. Knowing the limits and be-haviours of the system is essential when flying missions. This control also translates into simpler ways of tailoring the rendering engine to display different kinds of instrument data. Control of the code and its development also simplified the process of port-ing the system to run on iPads and iOS, a process that took about a week primarily because the main parts of the system were already developed in platform-independent ways using portable APIs and libraries wherever possible. Making changes in the field to sup-port new features or adjust existing features is also enabled by having control and a deep understanding of the code base.
Norut Geo Viz visualizes flights in near realtime. Due to latency introduced by both the communication link to the aircraft and the “once-per-second” polling strategy employed to update times-tamp ranges, the latency between the aircraft actually being at a specific geographical location and the visualization reflecting the aircraft at that location can be up to approximately 5-6 seconds. The majority of this latency stems from the worst case latency of the communication link (assuming no link drops). We have ob-served latencies on Iridium links of up to about five seconds. On alternative links the communication latency is significantly lower (on the order of 30-500 ms). An alternative to the polling strat-egy currently used is to make blocking requests to the mission data web server, that return once new data is available. This is currently future work.
The results of mapping images to the ground can be inaccurate, for two primary reasons. First, the timestamps assigned to images taken during flight are inaccurate. The cameras currently used are commodity DSLRs, with clocks that aren’t synchronized to the payload computer’s clock. This makes selecting which sample(s) to choose from the IMU4challenging. Currently, the images are timestamped with the local time on the payload computer at the moment the image begins transferring from the camera, which doesn’t account for time spent capturing and compressing the im-age on the camera. Second, the result is highly dependent on the aircraft’s position and attitude being accurate. Regardless of timestamp accuracy, drift in the IMU or a badly calibrated IMU can result in less than perfect image-to-ground mappings. How-ever, as an approximation the approach used by the visualization is good enough and can produce surprisingly good mappings. In practice the results are best for images taken during extended pe-riods of level flight in one direction.
The same issues also affect the final quality of the image mo-saics the visualizer can produce. However, for building a high-resolution image mosaic, the speed at which a mosaic can be made offers distinct benefits over more accurate solutions such as Agisoft’s PhotoScan in situations where a rapid result is re-quired – for instance when mapping oil spills and clean-up crews need information on “where to go.”
A further weakness of the current image-to-ground mapping is that the resulting image is mapped onto a single quad. Even though each corner of the quad is mapped accurately to the ground’s
4
elevation model, there may be peaks, valleys or other features in the elevation data set that are not reflected in the resulting mapping. This could be solved at some computational cost by adding additional vertices to the image mapping based on ray-intersections with the terrain meshes, or by draping the image directly over the elevation mesh. These approaches will be ex-plored in the future.
4.0.7 Operational experiences The visualization has been de-ployed in the field for several flight campaigns conducted by Norut. In July-August 2012, the system was used for a month-long cam-paign conducted from Ny- ˚Alesund on Svalbard. On Svalbard, the aircraft mostly used its Iridium satellite link to communicate with the ground station, resulting in very limited bandwidth (200-500 bytes/second) and very high latencies. However, the visualiza-tion still proved useful during flight to observe the aircraft and compare its flight trajectory with the underlying elevation model. After landing the system enabled quick and interactive analysis of data. Missions were flown with GPSs, cameras, spectrometer and laser distance measurement instruments. The combination of a relatively accurate elevation data set and rapid data analysis en-abled verification of laser distance measurements and determin-ing the altitude limits at which the laser distance measurement instrument became ineffective. It also provided a very simple way to compare the accuracy of the different onboard GPSs.
In September 2012, the system was used to visualize flights for an oil spill exercise outside Berlev˚ag, Norway. The ability to create image mosaics was developed during the campaign, highlighting one of the strengths of a fully custom visualization system. Due to a catastrophic failure with the power supply to the main im-age processing computer, the crew was left without the capability to create image mosaics. By doing onsite development, the fea-ture was incorporated into the visualization system and enabled delivery of image products despite the lack of high-performance compute resources. The visualization also served as a good way of communicating flight status to ground-based personell not di-rectly involved in flight operations.
5 RELATED WORK
There exist a number of systems for 3D visualization of geospa-tial data. Google Earth (Google, Inc., 2005) is perhaps the most well-known. Google Earth visualizes the globe using a curated data set consisting of global elevation data, global satellite im-agery and several additional layers (roads, weather, buildings, etc.). However, Google Earth is not a tool developed primarily for visualizing realtime data, and as such it is difficult to integrate with the data generated by a typical UAV flight.
NASA WorldWind (NASA, 2002) is an open-source virtual globe visualization API implemented in Java, and designed to be used by developers to create their own virtual globe visualization sys-tems. WorldWind’s reliance on Java as its implementation lan-guage limits its use to platforms that support Java, which rules out its use on for instance iPhones or iPads without a significant porting effort. gRAID (Jensen, 2009) is a plugin developed for WorldWind. gRAID enables realtime and post-flight overlays of aerial images with imagery rendered by WorldWind, but differs significantly from Norut Geo Viz in that NGV enables visual-ization of any data collected by the UAV, not just images. Fur-ther, gRAID does not make use of the underlying elevation model when projecting images to the ground, whereas NGV utilizes the elevation model when determining image corners in 3D.
WallGlobe (Hagen, 2011) is another system for rendering virtual globes in 3D, developed specifically for high-resolution tiled dis-plays. WallGlobe incorporates some level of realtime data, such
as air traffic. However, the system lacks the specialization re-quired to incorporate the varied data sets produced by unmanned aerial flights. Further, the system is closed and not readily avail-able.
6 CONCLUSION
This paper has presented Norut Geo Viz, a system for realtime and post-landing visualization of flights with unmanned aircraft. The system visualizes flights in 3D on a virtual globe, by com-bining several different raster and elevation map layers with flight and instrument data. The system has been used by Norut for flight campaigns conducted in Ny- ˚Alesund on Svalbard during summer 2012 and in an oil spill exercise near Berlev˚ag, Norway during fall 2012. The system has enabled operators to quickly analyze data collected by instruments such as cameras, spectrometers and lasers, both during flight and after landing. The system efficiently maps images to their approximate location on the ground, and presents additional measurements spatially in the visualization at the location where they were made. The system runs on Mac OS X, Linux and iOS.
7 ACKNOWLEDGEMENTS
This work was supported by the Norwegian Research Council. Map data in screenshots are sourced from the Norwegian Map-ping Authority and the Norwegian Polar Institute.
REFERENCES
Bourke, P., 1999. 3D stereo rendering using OpenGL (and GLUT). http://paulbourke.net/stereographics/stereorender/ (last visited 25. april 2013).
Donnelly, W. and Lauritzen, A., 2006. Variance shadow maps. In: Proceedings of the Symposium on Interactive 3D Graphics and Games 2006, pp. 161–165.
Google, Inc., 2005. Google earth. http://earth.google.com/ (last visited April 24. 2013).
Hagen, T.-M. S., 2011. Interactive Visualization on High-Resolution Tiled Display Walls with Network Accesible Compute- and Display-Resources. University of Tromsø, Nor-way. Ph.D. dissertation.
Jensen, A. M., 2009. gRAID: A Geospatial Real-Time Aerial Im-age Display for a Low-Cost Autonomous Multispectral Remote Sensing. Utah State University, USA. Master thesis.
Kaltenbrunner, M., Bovermann, T., Bencina, R. and Costanza, E., 2005. TUIO - a protocol for table-top tangible user interfaces. In: Proceedings of the 6th International Workshop on Gesture in Human-Computer Interaction and Simulation.
Luebke, D., Reddy, M., Cohen, J. D., Varshney, A., Watson, B. and Huebner, R., 2003. Level of Detail for 3D Graphics. Morgan Kaufmann.
NASA, 2002. WorldWind. http://goworldwind.org/about/ (last visited April 24. 2013).
St¨ockl, R., Vermote, E., Saleous, N., Simmon, R. and Herring, D., 2005. The blue marble next generation - a true color earth dataset including seasonal dynamics from modis. Published by the NASA Earth Observatory.
U.S. Geological Survey, 1996. Global 30-arc-second elevation data (GTOPO30).