www.elsevier.com / locate / livprodsci
Voluntary feed intake and feeding behaviour of group-housed
growing pigs are affected by ambient temperature and body
q
weight
1
*
N. Quiniou , S. Dubois, J. Noblet
Station de Recherches Porcines, Institut National de la Recherche Agronomique, 35590 Saint-Gilles, France
Received 25 September 1998; received in revised form 7 April 1999; accepted 21 June 1999
Abstract
´
The effect of ambient temperature on individual feeding behaviour was studied in six groups of Pietrain3Large White barrows. In experiment 1 (two groups), ambient temperature varied in a cyclic way from 22 to 128C and 12 to 228C with three or four consecutive days at each of the following temperatures: 22, 19, 16, 14 or 128C. Similarly, in experiment 2 (two groups), temperature varied from 19 to 298C and 29 to 198C with three or four consecutive days at 19, 22, 25, 27 or 298C. In both experiments, each group was used over two successive cycles with an initial body weight (BW) of 37 kg at cycle 1 (four pigs per group) and 63 kg at cycle 2 (three pigs per group). During experiment 3, groups of four pigs were exposed to varying temperatures over one cycle either as in experiment 1 (one group) or as in experiment 2 (one group); their initial BW was 45 kg. Photoperiod was fixed to 12 h of light. In experiments 1 and 2, neither the daily number of meals (11) nor the rate of feed intake (37 g / min) were affected by temperature. The daily number of meals was lower at cycle 2 (9 vs. 12 at cycle 1 on average) but their size was higher (305 vs. 181 g / meal at cycle 1). The feeding pattern was mainly diurnal (62%). From individual data obtained at each temperature level and each stage of growth in this study (N5296), an equation to predict the voluntary feed intake (VFI) from temperature (T, ranging between 12 and 298C) and body weight (BW, ranging
2 2
between 30 and 90 kg) is proposed: VFI (g / d)5 212641117T22.40T 173.6BW20.26BW 20.95T3BW (RSD5
329). The present relationship indicates that VFI depends on temperature and body weight with a marked negative effect of high ambient temperatures in heavier pigs. 2000 Elsevier Science B.V. All rights reserved.
Keywords: Pig; Appetite; Temperature; Feeding behaviour
q 1. Introduction
Preliminary results were presented as an abstract at the 32nd Congress of the International Society of Animal Ethology, 21–25
July 1998, Clermont-Ferrand, France. During the growing period, the voluntary feed *Corresponding author. Tel.: 133-2-9928-5049; fax: 133-2- intake (VFI) is influenced by the physiological status
9928-5080. (age, body weight) (Kanis and Koops, 1990) and the
E-mail address: [email protected] (J. Noblet)
1 type of pig (breed, sex) (Fuller et al., 1995; Labroue
On leave from the Institut Technique du Porc, BP 3, 35650 Le
et al., 1995). In addition, environmental factors, such Rheu, France. Tel.: 133-2-9960-9838; fax: 133-2-9960-9355.
E-mail: [email protected]. as temperature, affect VFI. According to studies
available in the literature, the decrease of tempera-ture below the thermoneutral zone is associated with an increase of VFI and body fatness at slaughter (Le Dividich et al., 1985), whereas under warm con-ditions, the VFI is decreased as well as body fatness (Rinaldo and Le Dividich, 1991). However, most of those results were obtained in conventional types of pigs and would not be applicable to lean types of pigs as, for instance, no increase of body fatness under cold temperature was reported recently by Massabie et al. (1996). Furthermore, little infor-mation is available to predict VFI and feeding
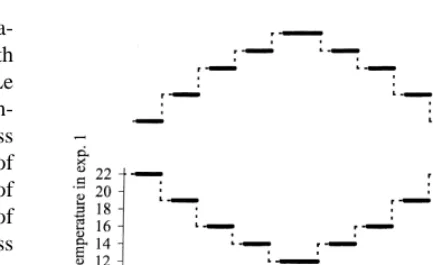
Fig. 1. Cyclic variation of temperature (8C) over each stage of behaviour in pigs exposed to different ambient growth in experiments 1 and 2: - - -, adaptation; ———, measure-temperatures (Nienaber et al., 1990, 1996), especial- ment.
ly in lean types of pigs. As the chemical composition of the body weight (BW) gain depends directly on
the intake of nutrients and their digestive and days at each of the following temperatures: 22, 19, metabolic utilisation by the animals (Whittemore and 16, 14 and 128C. Groups 3 and 4 were used to study Fawcett, 1976), it is of major interest to investigate the effect of hot exposure and then exposed to the way that the ambient temperature affects nutrient ambient temperatures varying from 19 to 298C and utilisation and feeding behaviour in pigs. The aim of from 29 to 198C (experiment 2) with three or four the present study was to characterise the effects of consecutive days at each of the following tempera-exposure to cold or hot temperatures on VFI, feeding tures: 19, 22, 25, 27 and 298C. The 19 and 228C behaviour and energy expenditure of group-housed levels were considered as belonging to the ther-growing pigs over the ther-growing-finishing period. For moneutral zone of group-housed growing pigs. this latter purpose, the pigs were studied in a In the second part of the study (experiment 3), two respiratory chamber with a subsequent limited group- additional groups were studied at an intermediary size. The present paper will focus on VFI and stage of growth and exposed to the same thermic set components of feeding behaviour. as in experiment 1 (group 5) or in experiment 2 (group 6); the initial BW of these pigs was 45 kg on average and the group size was four pigs.
2. Materials and methods
2.2. Animal management 2.1. Experimental design
At weaning (about 28 days of age), five to six pigs In the first part of the study, voluntary feed intake originating from different litters were selected ac-and individual feeding behaviour were measured on cording to their BW and health status. Three weeks
´
four groups of crossbred Pietrain3Large White later, at approximately 15 kg BW, they were gathered barrows studied over two consecutive stages of in a pen. At 25 kg, four of them were moved to the growth. The initial BW was around 37 kg at stage 1 experimental unit. During the whole experiment, the and around 63 kg at stage 2. The corresponding animals were group-housed in a pen (2.331.6 m) on group sizes were four and three pigs, respectively. metal slatted floor upon a small slurry pit. The pen For each group, temperature varied in a cyclic way was equipped with a feed dispenser and a drinking over 28 days (a thermic set) at each stage of growth station and placed into a respiratory chamber (12
3
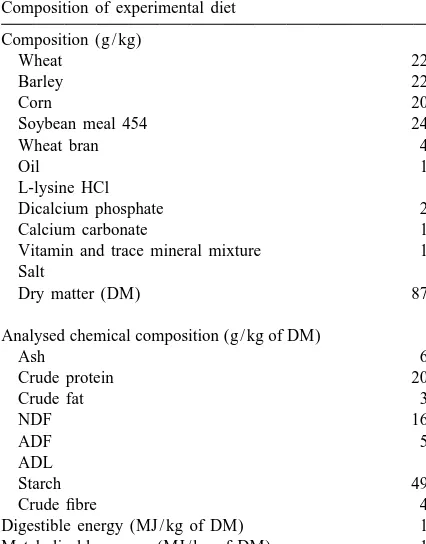
Table 1 electronic identification system (antenna) that was Composition of experimental diet activated by earresponders as the animal entered the
Composition (g / kg) station. The access to the feed was adapted to the
Wheat 220.0 size of animals with a traverse allowing only one
Barley 220.0
animal to enter. The hopper was filled up daily with
Corn 200.0
an amount of feed sufficient to meet the appetite of
Soybean meal 454 244.5
the group of pigs. The trough was continuously
Wheat bran 40.0
Oil 10.0 weighed and when the load cell detected it as L-lysine HCl 0.5 unsteady, it corresponded to a visit. After each visit,
Dicalcium phosphate 20.0
time and amounts of feed at the beginning and at the
Calcium carbonate 10.0
end of the visit were recorded. Feed consumption per Vitamin and trace mineral mixture 10.0
visit was calculated as the difference between the
Salt 5.0
Dry matter (DM) 876.0 amounts recorded just before and after the visit with an accuracy of 10 g. Ingestion time per visit corres-Analysed chemical composition (g / kg of DM)
ponded to the difference between the time at the end
Ash 68
and at the beginning of the visit. If the feeder was
Crude protein 208
detected as unsteady but no difference in feed
Crude fat 35
NDF 167 amount was noted after the visit, it was not recorded. ADF 53 Water was supplied outside the feeder by a nipple
ADL 5
drinker to avoid disturbing the feed weight
measure-Starch 490
ments.
Crude fibre 42
Digestible energy (MJ / kg of DM) 15.73
Metabolizable energy (MJ / kg of DM) 15.07 2.4. Descriptive components of feeding behaviour
a
Net energy (NE) (MJ / kg of DM) 11.24
a
Estimated from digestible energy content (DE, MJ / kg of DM) A single meal can occur in different successive and chemical components (g / kg of DM) according to the relation- visits with short pauses (within-meal intervals) with-ship proposed by Noblet et al. (1994): NE50.7033DE1 in which the computer can detect a steady weight. In
0.00663crude fat10.0023starch20.0413crude protein2
order to allow comparison with the results from other 0.00413crude fibre (RSD50.18).
pigs or other studies carried out under various feeding conditions, successive visits were grouped Animals had free access to water. The experiment into the same meal by using the so-called ‘meal started after one week of adaptation to the respiration criterion’ defined as the maximum length of the chamber environment and the diet. During this within-meal interval between visits. Then, if visits period, the temperature was fixed at 228C (experi- were separated by intervals longer than the ‘meal ment 1 and group 5 in experiment 3) or 198C criterion’, they are considered as different meals. The (experiment 2 and group 6 in experiment 3). The ‘meal criterion’ was assessed from our data using a relative humidity was 70%. The pigs were weighed log survivorship function as described by Bigelow at the beginning and the end of each thermic set and and Houpt (1988). A sample of 183 data obtained on at the beginning of the 168C level (experiment 1 and individual pigs originating from both experiments group 5 in experiment 3) or the 258C level (experi- and exposed to the different temperatures was ran-ment 2 and group 6 in experiran-ment 3). domly chosen to calculate the meal criterion. Ninety-five percent of the individual estimated meal criteria 2.3. Equipment were below 2 min; this value was retained for further
calculations.
meals per day; average feed intake per day (g); The proportion of diurnal feed intake was calculated average total ingestion time per day (min), defined as for each group at each thermic level as the ratio the total duration of all the visits performed during between the mean diurnal and mean total feed intake. the day; average total time of feed consumption The response of VFI to temperature and BW and (min), defined as the sum of ingestion time plus their interaction was studied from the combination of within meal intervals; average rate of feed intake all individual data obtained at each temperature level (g / min), defined as the feed intake per day divided and at each stage of growth in experiment 1 (N5 by the total ingestion time; average feed intake per 120), experiment 2 (N5120) and experiment 3 (N5 meal (g) and the average total ingestion time per 56). A covariance analysis was performed with the meal (min), defined as the total duration of the visits group within stage of growth as a fixed effect and belonging to the same meal. Behavioural criteria temperature, BW and their interaction as covariates. were also estimated over the day and the night
separately. In fact, over the three or four consecutive days at each temperature level, only the individual
3. Results
feeding behaviour calculated over the two or three last ones were used for further analysis of data.
The average daily gain was 980 and 950 g / d in Indeed, during the first day at each temperature, the
experiments 1 (groups 1 and 2) and 2 (groups 3 and ambient temperature decreased or increased by 2 or
4), respectively. A problem occurred during fulfilling 38C over 4 h and this day was dedicated to
adapta-the trough at one of adapta-the 198C levels studied over the tion to the new temperature.
first stage of growth, both in experiments 1 and 2. Consequently, number of observations reported in 2.5. Statistical analysis
Tables 2 and 3 was lower at this temperature. When exposed to 19 and 228C, the VFI of pigs was higher Data from experiments 1 and 2 were used to
in experiment 2 than in experiment 1 (2.40 vs. 2.31 characterise the effects of temperature and BW on
kg / d on average, respectively); the mean BW was the components of feeding behaviour. Results of
also slightly higher in experiment 2. Then, separated experiment 3 (only one intermediary stage of growth
variance analyses were performed on data originating was considered) were introduced in the data set in
from each experiment. order to establish an equation for prediction of VFI
The mean BW over the two stages of growth from temperature and BW: 120, 120 and 56
in-studied was 47 and 74 kg in experiment 1 and 49 and dividual data were obtained in experiments 1, 2 and
76 kg in experiment 2. The increase of BW between 3, respectively.
stages of growth was associated with a decreased Taking into account social facilitation occurring
daily number of meals (23.6 and 22.1 in experi-among group-housed pigs (Hsia and Wood-Gush,
ments 1 and 2, respectively), the sizes of which 1983), components of feeding behaviour were
calcu-increased similarly in both experiments (Tables 2 lated for each group at each temperature level over
and 3). As a consequence, the VFI increased with each stage of growth, as the average of the four
increased BW but to a lesser extent in experiment 1 (stage 1) or three (stage 2) individual values obtained
(10.49 kg / d) than in experiment 2 (10.63 kg / d). at this temperature (ascending or descending). When
At thermoneutrality, i.e. at 19 and 228C, the data of the information was not available for one pig at one
both experiments were used to assess the relationship of the two thermic levels, then its data were not
between VFI (VFI19 – 22, g / d) and BW (kg). The taken into account at this temperature. From the data
covariance analysis indicates that the effect of BW obtained in experiments 1 and 2, 34 mean values
on VFI was not linear: were calculated in each experiment and used to test
the effects of temperature, stage of growth and their 2
VFI19 – 22555.36 BW20.251 BW (RSD5353) interaction through an analysis of variance (GLM,
SAS, 1990). The effect of the group was also
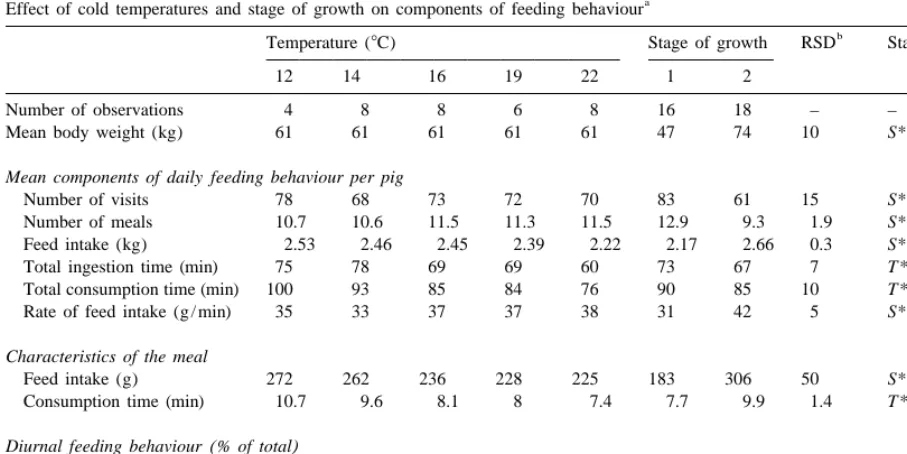
Table 2
a
Effect of cold temperatures and stage of growth on components of feeding behaviour
b c
Temperature (8C) Stage of growth RSD Statistical analysis
12 14 16 19 22 1 2
Number of observations 4 8 8 6 8 16 18 – –
Mean body weight (kg) 61 61 61 61 61 47 74 10 S***
Mean components of daily feeding behaviour per pig
Number of visits 78 68 73 72 70 83 61 15 S***, G***
Number of meals 10.7 10.6 11.5 11.3 11.5 12.9 9.3 1.9 S***
Feed intake (kg) 2.53 2.46 2.45 2.39 2.22 2.17 2.66 0.3 S***
Total ingestion time (min) 75 78 69 69 60 73 67 7 T **, S*, G**
Total consumption time (min) 100 93 85 84 76 90 85 10 T **, G**
Rate of feed intake (g / min) 35 33 37 37 38 31 42 5 S***
Characteristics of the meal
Feed intake (g) 272 262 236 228 225 183 306 50 S***
Consumption time (min) 10.7 9.6 8.1 8 7.4 7.7 9.9 1.4 T **, S***, G***
Diurnal feeding behaviour(% of total)
Number of meals 65 66 65 66 68 66 66 5 G***
Feed intake per day 63 60 59 62 63 61 62 6 G*
Ingestion time 66 64 61 62 65 65 63 8
a
Experiment 1, adjusted means.
b
Residual standard deviation.
c
From analysis of variance with temperature (T ), stage of growth (S ), T3S interaction and group within stage of growth (G) as main effects. Each observation corresponds to the mean of four or three individual values obtained within each group at each stage of growth at each of the two thermic levels (one at 128C) within the experimental scheme designed.
Statistical signification: *** P,0.001, ** P,0.01, * P,0.05.
2 higher at stage 2 than at stage 1 (P,0.001). Taking VFI5 21264173.6BW20.26BW 1117T
2 into account the difference in VFI between stages, it
22.40T 20.95T3BW (RSD5329) resulted in a comparable total ingestion time at both
stages of growth (Tables 2 and 3). The change of
Table 3
a
Effect of hot temperatures and stage of growth on components of feeding behaviour
b b
Temperature (8C) Stage of growth RSD Statistical analysis
19 22 25 27 29 1 2
Number of observations 6 8 8 8 4 16 18 – –
Mean body weight (kg) 63 63 62 62 62 49 76 9 S***
Mean components of daily feeding behaviour per pig
Number of visits 63 66 66 58 50 59 62 7 T **, G***
Number of meals 11.2 11.3 9.8 9.9 10.1 11.5 9.4 1.6 S**, G***
Feed intake (kg) 2.40 2.39 2.30 2.10 1.82 1.89 2.52 0.27 T *, S***, G***
Total ingestion time (min) 64 63 59 55 46 57 58 6 T ***
Total consumption time (min) 81 81 76 68 56 70 75 7 T ***
Rate of feed intake (g / min) 39 38 40 39 40 34 44 4 S***, G***
Characteristics of the meal
Feed intake (g) 248 247 271 241 205 179 306 47 S***
Consumption time (min) 8.5 8.2 8.8 7.6 6.2 6.7 9.0 1.4 S***, G**
Diurnal feeding behaviour (% of total )
Number of meals 69 68 61 55 55 60 63 5 T ***, T3S*
Feed intake per day 65 65 64 60 62 60 66 5 S**, G*
Ingestion time 66 67 65 61 62 61 67 5 S**
a
Experiment 2, adjusted means.
b
See Table 2. Each observation corresponds to the mean of three or four individual values obtained within each group at each stage of growth at each of the two thermic levels (one at 298C) within the experimental scheme designed.
found on the rate of feed intake under hot exposure important during stage 1 (from 68 to 49%) than or under cold exposure. The ingestion time increased during stage 2 (from 70 to 62%).
with decreased temperatures in experiment 1 (60 and 75 min / d at 22 and 128C, respectively, P,0.05) and
it decreased with increased temperatures in experi- 4. Discussion
ment 2 (64 and 46 min / d at 19 and 298C,
respective-ly, P,0.001). The effect of increased ambient temperature on the About 2 / 3 of feed consumption occurred during VFI in growing-finishing pigs has been widely the day (Tables 2 and 3). This proportion was neither studied, and in a recent literature review, Le Dividich affected by temperature or by stage of growth in et al. (1998) reported that the associated decrease of experiment 1. Under warm exposure, the diurnal feed VFI ranged from a minimum value of 40 g /8C / d to a intake was proportionally more important at stage 2 maximum of 80 g /8C / d, which depends on many (66 vs. 60% at stage 1), but no significant effect of factors including breed, BW range, diet and, to the temperature was observed. As presented in Table 3, highest extent, the temperature range. Even if Close the partition of meals between day and night was (1989) proposed a linear relationship between VFI significantly influenced by temperature: 69% of daily and temperature, there is some evidence that VFI meals were performed during the day at 198C but varies quadraticaly with ambient temperature only 55% at 298C. Such a difference was not (Nienaber and Hahn, 1983; the present study), the observed under cold temperatures. In addition, the change in VFI with temperature being as important interaction between temperature and stage of growth as the temperature is high.
average in 60 kg pigs according to the equation suggested by Holmes and Close (1977). From the obtained in the present study or by Nienaber and proposed equation, it can be calculated that the Hahn (1983) and Close (1989), respectively. Apart decreases in VFI between 19 and 298C were 48 and from an eventual effect of genotype on appetite, 77 g / d /8C in 45 and 75 kg pigs, respectively, while Nienaber and Hahn (1983) and Close (1989) used between 22 and 128C, the increases in VFI were 7 data obtained either on individually- or pair-housed and 36 g / d /8C in 45 and 75 kg pigs, respectively. In animals, whereas group-size was four or three pigs in fact, these values indicate the highly detrimental our study. According to Nienaber et al. (1991), four effect of high temperatures on heavier pigs and the pigs per group would be the minimal number of inability of light pigs to increase their VFI at low animals needed to facilitate huddling under cold temperatures, probably because of their limited gut exposure. Then, the effect of low temperatures on capacity.
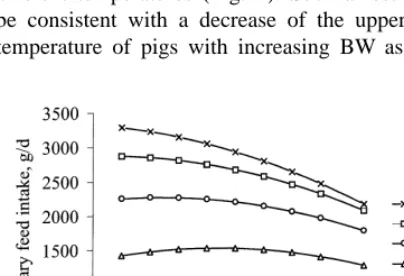
VFI would be markedly increased in smaller group- According to our results, the daily number of size. This hypothesis could explain the differences in meals remained constant under the temperature range slopes between our study and those of Nienaber and studied, whereas meal size seemed to decrease with Hahn (1983) and Close (1989). However, these increased temperature. These results are in agree-slopes are not very far from the decrease in VFI with ment with data obtained in group-housed pigs under increased temperature (17–288C) observed in more hot conditions by Nienaber et al. (1993). However, practical conditions, i.e. 50–40 g /8C / d according to in individually kept pigs, Nienaber et al. (1990) Massabie et al. (1996) in 25–105 kg group-housed showed that increased VFI under cold temperature barrows and gilts, respectively. resulted from an increase of daily number of meals, Through the covariance analysis, our study indi- whereas their size and duration were kept constant. cates a significant interaction between BW and Yet, in individually kept pigs, no huddling behaviour temperature on VFI, which was also reported by can occur to reduce cutaneous heat losses. In such Close (1989). In practical terms, the interaction case, a higher meal frequency is associated with found between temperature and BW means that the higher physical activity that induces a specific heat heavier the pigs are the more they are sensitive to hot production.
ambient temperatures (Fig. 2). Such a result would According to our results, under hot exposure, be consistent with a decrease of the upper critical ingestion time per day was reduced as well as the temperature of pigs with increasing BW as already occupation time of the feeding station. But when ingestion time and consumption time obtained in our study are compared, it appears that the non-eating activity in front of the trough averaged 17 min / d when ambient temperature was below 278C, whereas at 27 and 298C, this activity was reduced to 13 and 10 min, respectively. As physical activity is associ-ated with a high heat production in the pigs (Noblet et al., 1993), the lower duration of non-eating activity under hot exposure could be interpreted as an adaptation to high temperatures.
The increase of BW influenced components of feeding behaviour in experiments 1 and 2 as well. As already reported by Auffray and Marcilloux (1980), Bigelow and Houpt (1988), Nienaber et al. (1990) Fig. 2. Variation of voluntary feed intake (VFI, g / d) with and Labroue et al. (1995) on group-housed or single-temperature (T,8C) and body weight (BW, kg) calculated using housed pigs, the increase of BW was associated with the equation:
a decreased number of meals per day, whereas
2 2 ingestion time remained about constant.
Concomi-VFI5 21264173.6BW20.26BW 1117T22.40T
the rate of feed intake increased, which resulted in a moregulation. Under hot temperatures, decreased higher meal size and an increased total feed intake. VFI is inexorably associated with decreased per-The rate of feed intake was slightly higher in formance. The decrease or increase in feed intake experiment 2 than in experiment 1, which would be under hot or cold exposure, respectively, occurs in agreement with Nienaber et al. (1991) who mainly through changes in meal size rather than in observed a lower rate of feed intake when tempera- daily number of meals. Then, the question arises on ture was 128C below than 48C above the lower the mechanisms implied in determination of meal critical temperature. Such a difference could be size. It could be limited by short-term thermic effect explained by a decrease in the rate of feed intake of feed under hot exposure as internal heat expendi-during the last visits belonging to the same meal ture is reduced in such conditions. Under cold when its size increased markedly and almost reached exposure, meal size would rather be determined by the maximum gut capacity of the pig. stomach capacity than by heat dissipation. However, The feeding behaviour of confined pigs studied in metabolic control of voluntary feed intake is com-the present experiment was mainly diurnal as more plex and more knowledge is required to characterise than 62% of feed intake occurred during the day. the effect of ambient temperature on the metabolic This partition is close to the value obtained by pathways involved in feeding behaviour.
Auffray and Marcilloux (1980) and by Bigelow and Houpt (1988) in individually kept pigs (64%). In
group-housed pigs, Labroue et al. (1995) reported a Acknowledgements
higher proportion of VFI during the day (75%).
Opposing those studies but in agreement with The authors gratefully acknowledge A. Roger, F. ¨
Nienaber et al. (1990), our results show that the Le Gouevec and S. Daniel for their technical assis-average proportion of diurnal feed intake did not tance.
increase markedly with BW. However, the low number of pigs per group may contribute to the
constancy of the diurnal partition of VFI. Indeed, it References
could be supposed that the housing conditions in the
´ present study induced social facilitation as defined by Auffray, P., Marcilloux, J.C., 1980. Analyse de la sequence
` ´
alimentaire du porc, du sevrage a l’etat adulte. Reprod. Nutr. Hsia and Wood-Gush (1983) with or without mild
Develop. 20 (5B), 1625–1632. competition, whereas there was competition in the
Bigelow, J.A., Houpt, T.R., 1988. Feeding and drinking patterns study carried out by Labroue et al. (1995). In in young pigs. Physiology and Behavior 43, 99–109. addition, the effect of BW on diurnal partition of Close, W.H., 1989. The influence of the thermal environment on feed intake seemed to depend on the temperature. the voluntary food intake of pigs. In: Forbes, J.M., Varley, M.A., Lawrence, T.L.J. (Eds.), The Voluntary Food Intake of Indeed, a higher increase of the proportion of diurnal
Pigs. Occasional Publication no. 13-BSAP, pp. 87–96. feed intake was observed between stages 1 and 2
Fuller, M.F., Franklin, M.F., McWilliam, R., Pennie, K., 1995. under hot exposure rather than under cold conditions. The response of growing pigs, of different sex and genotype, to
dietary energy and protein. Anim. Sci. 60, 291–298. Holmes, C.W., Close, W.H., 1977. The influence of climatic
variables on energy metabolism and associated aspects of
5. Conclusion
productivity in the pig. In: Swan, H., Lewis, D. (Eds.), Nutrition and Climatic Environment, pp. 51–74.
The present study clearly indicates that voluntary Hsia, L.C., Wood-Gush, D.G.M., 1983. The temporal patterns of feed intake depends on body weight and temperature food intake and allometric food intake and allomimetic feeding with a marked negative effect of high temperatures by pigs of different ages. Appl. Anim. Ethol. 11, 271–282.
Kanis, E., Koops, W.J., 1990. Daily gain, food intake and food in heavier pigs. Under cold temperature, feed intake
efficiency in pigs during the growing periods. Anim. Prod. 50, increased but it seems that light pigs have limited
353–364.
ability to increase VFI when exposed to cold tem- Labroue, F., Gueblez, R., Meunier-Salaun, M.-C., Sellier, P., 1995.´ ¨ peratures. Consequently, extra feed intake does not Influence de la race sur le comportement alimentaire de porcs
´ ´ ´
´ ´
comparaison Large White-Pietrain. Journees Rech. Porcine Fr. Group feeding behavior of swine. Trans. ASAE 34 (1), 289–
27, 175–182. 294.
Le Dividich, J., Desmoulin, B., Dourmad, J.-Y., 1985. Influence de Nienaber, J.A., Hahn, G.L., Korthals, R.L., McDonald, T.P., 1993. ´
la temperature ambiante sur les performances du porc en Eating behavior of swine influenced by environmental tempera-croissance-finition en relation avec le niveau alimentaire. ture. Trans. ASAE 36 (1), 937–944.
´
Journees Rech. Porcine Fr. 17, 275–282. Nienaber, J.A., Hahn, G.L., McDonald, T.P., Korthals, R.L., 1996. Le Dividich, J., Noblet, J., Herpin, P., van Milgen, J., Quiniou, N., Feeding patterns and swine performance in hot environments.
1998. Thermoregulation. In: Wiseman, J., Varley, M.A., Chad- Trans. ASAE 39 (1), 195–202.
wick, J.P. (Eds.), Proc. of the 58th Easter School in Agricultur- Noblet, J., Shi, X.S., Dubois, S., 1993. Energy cost of standing al Science, Progress in Pig Science, Nottingham University activity in sows. Livest. Prod. Sci. 34, 127–136.
Press, pp. 229–264. Noblet, J., Fortune, H., Shi, X.S., Dubois, S., 1994. Prediction of Massabie, P., Granier, R., Le Dividich, J., 1996. Influence de la net energy value of feeds for growing pigs. J. Anim. Sci. 72,
´
temperature ambiante sur les performances zootechniques du 344–354.
` ´ ´
porc a l’engrais alimente ad libitum. Journees Rech. Porcine Fr. Rinaldo, D., Le Dividich, J., 1991. Assessment of optimal 28, 189–194. temperature for performance and chemical body composition Nienaber, J.A., Hahn, G.L. 1983. Performance of growing-finish- of growing pigs. Livest. Prod. Sci. 29, 61–75.
ing swine in response to the thermal environment. ASAE Oral S.A.S., 1990. S.A.S. / STAT User’s Guide: statistics, Statistical presentation MCR 83-137, St-Joseph, MI, 12 pp. Analysis Systems Institute, Cary, NC (Release 6.07). Nienaber, J.A., McDonald, T.P., Hahn, G.L., Chen, Y.R., 1990. Whittemore, C.T., Fawcett, R.H., 1976. Theoretical aspects of a
Eating dynamics of growing finishing swine. Trans. ASAE 33 flexible model to simulate protein and lipid growth in pigs.
(6), 2011–2018. Anim. Prod. 22, 87–96.