This content has been downloaded from IOPscience. Please scroll down to see the full text.
Download details:
IP Address: 103.9.183.251
This content was downloaded on 22/06/2017 at 08:29 Please note that terms and conditions apply.
View the table of contents for this issue, or go to the journal homepage for more
Inflation data clustering of some cities in Indonesia
Adi Setiawan, Bambang Susanto, and Tundjung Mahatma
Department of Mathematics, Faculty of Science and Mathematics Universitas Kristen Satya Wacana, Indonesia.
E-mail: [email protected]
ABSTRACT. In this paper, it is presented how to cluster inflation data of cities in Indonesia by using k-means cluster method and fuzzy c-means method. The data that are used is limited to the monthly inflation data from 15 cities across Indonesia which have highest weight of donations and is supplemented with 5 cities used in the calculation of inflation in Indonesia. When they are applied into two clusters with k= 2 for k-means cluster method and c= 2, w = 1.25 for fuzzy c-means cluster method, Ambon, Manado and Jayapura tend to become one cluster (high inflation) meanwhile other cities tend to become members of other cluster (low inflation). However, if they are applied into two clusters with c=2, w=1.5, Surabaya, Medan, Makasar, Samarinda, Makasar, Manado, Ambon dan Jayapura tend to become one cluster (high inflation) meanwhile other cities tend to become members of other cluster (low inflation). Furthermore, when we use two clusters with k=3 for k-means cluster method and c=3, w= 1.25 for fuzzy c-means cluster method, Ambon tends to become member of first cluster (high inflation), Manado and Jayapura tend to become member of second cluster (moderate inflation), other cities tend to become members of third cluster (low inflation). If it is applied c=3, w = 1.5, Ambon, Manado and Jayapura tend to become member of first cluster (high inflation), Surabaya, Bandung, Medan, Makasar, Banyuwangi, Denpasar, Samarinda dan Mataram tend to become members of second cluster (moderate inflation), meanwhile other cities tend to become members of third cluster (low inflation). Similarly, interpretation can be made to the results of applying 5 clusters.
1. Introduction
Monthly Consumer Price Index (CPI) of commodities in 82 cities across Indonesia is calculated and used to determine the monthly inflation of the cities and also nation-wide by the Central Statistics Agency (BPS). Each city has its own weighting based on the interests of the city. Jakarta, Surabaya, Bandung, Bekasi and Tangerang have the largest weight contribution i.e. 19.23%, 5.65%, 4.87%, 4.78% and 3.75%, respectively. In July 2016 monthly inflation rate is 0.69 per cent, while the inflation rate of the calendar year (January to July 2016) is amounted to 1.76 percent and the inflation rate year-on-year (July 2016 to July 2015) is 3.21 percent [1].
2 2. Literature Review
The methods employed in this research –the k-means and fuzzy c-means clustering methods– are presented as follows.
The k-means algorithm is composed of the following steps:
1. Place k points into the space represented by the objects that are being clustered. These points represent initial group centers.
2. Assign each object to the group that has the closest centers.
3. When all objects have been assigned, recalculate the positions of the k centers.
4. Repeat steps 2 and 3 until the centers no longer move. This procedure a separation of the objects into groups from which the metric to be minimized can be calculated [2].
This algorithm aims at minimizing an objective function, in this case a squared error function i.e.
kj n
i
j j
i
c
x
J
1 1
2 ) (
where
2 ) (
j j
i
c
x
is a chosen distance measure between a data pointx
i(j) and the cluster centercj, is an indicator of the distance of the n data points their respective cluster center.
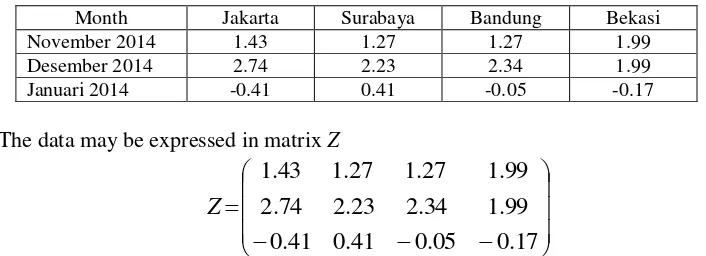
The implementation of the k-means method using a small sample data is illustrated as follows. Suppose we have the monthly inflation data of Jakarta, Surabaya, Bandung and Bekasi as presented in Table 1.
Table 1. Table of monthly inflation of cities in Indonesia : Jakarta, Surabaya, Bandung and Bekasi.
Month Jakarta Surabaya Bandung Bekasi
November 2014 1.43 1.27 1.27 1.99
Desember 2014 2.74 2.23 2.34 1.99
Januari 2014 -0.41 0.41 -0.05 -0.17
The data may be expressed in matrix Z
17
.
0
05
.
0
41
.
0
41
.
0
99
.
1
34
.
2
23
.
2
74
.
2
99
.
1
27
.
1
27
.
1
43
.
1
Z
and based on the k-means algorithm we obtain the center matrix, which consists of the first two points i.e.
,
41
.
0
41
.
0
23
.
2
74
.
2
27
.
1
43
.
1
V
having the distance matrix
9552
.
0
4730
.
0
0
9788
.
0
9663
.
0
5614
.
0
9788
.
0
0
D
so that an objective function of 1.1361 is obtained. Furthermore, a clustering matrix can be expressed as
.
1
1
1
0
0
0
0
1
U
This means that the monthly inflation data of Jakarta is in a separate cluster, while the monthly inflation data of Surabaya, Bandung and Bekasi in another cluster. By using the clustering matrix U
.
063
.
0
41
.
0
187
.
2
74
.
2
510
.
1
430
.
1
V
In this case, the first column is the first point and the second column is the average of the second, third and fourth points. The distance matrix of each point to the corresponding centre can expressed by:
5688
.
0
3065
.
0
4239
.
0
7325
.
0
9663
.
0
5614
.
0
9788
.
0
0
D
and an objective function of 0.5971. Other clustering matrices are then selected until the objective function value is not changed. The final result of this algorithm is the clustering matrix:
,
0
1
1
1
1
0
0
0
U
the center matrix:
,
1700
.
0
0167
.
0
9900
.
1
4367
.
2
9900
.
1
3233
.
1
V
a distance matrix:
8170
.
0
1153
.
0
4771
.
0
5080
.
0
0
8095
.
0
9552
.
0
966
.
0
D
,and an objective function of 0.4990.
Fuzzy c-means (FCM) is an algorithm to cluster data, in which the membership of each data point in the cluster is determined by its probability value. In k-means clustering method, in contrast, each point may only be a member of a cluster and not of any other cluster. Fuzzy c-means clustering is used to find the degree of membership in a cluster if the number of clusters c and the weight w are given, as in the examples found in [2], [3] and [4].
The algorithm of FCM may be described as follows [5] :
1. Suppose we have the data to be clustered in matrix Z with the ordo K × N, where K = the number of variables/attributes/criteria, and N = the number of sample points that will be clustered. Matrix Z can be presented as follows
.
...
...
...
...
...
...
...
2 1 2 22 21 1 12 11
KN K K N Nz
z
z
z
z
z
z
z
z
Z
2. The partition matrix or decision matrix U depends on : a. The number of clusters c, where N > c ≥ 2.
b. The weight parameter w that is used in clustering (as a rule, w > 1).
c. Stopping criteria i.e. the threshold , a positive small number. Eg. = 10-1; 10-3; 10-6, and so on. A maximum iteration may also be used, eg. an iteration of 100, 1000, or 10.000. d. Initial objective value (P0).
4
cN c c N Nu
u
u
u
u
u
u
u
u
U
...
...
...
...
...
...
...
2 1 2 22 21 1 12 11having
1
1
c i iju
for j= 1, 2, …., N.4. The cluster centre matrix V is one with the ordo of K × c, applying the formula:
N j w ij N j j w ij iu
z
u
v
1 1)
(
where vi is the i-th center of cluster for i= 1, 2, …., c.
5. The objective value is obtained by using
N j c i ij w ijn
u
d
P
1 1 2)
(
)
(
where dij= the function of Eucledian distance of the i-th cluster center and the j-th data, which
is
.
)
(
)
,
(
2 / 1 1 2
K k ki kj i jij
d
z
v
z
v
d
6. The partition matrix U is modified so that each membership degree of the entry becomes Un
whichfollows
.
1 1 ) 1 /( 2
ch w hj ij ij
d
d
u
7. The iteration is stopped when the partition matrix does not change, i.e. || Un–Un-1 || <
or the objective function does not change, i.e. | Pn – Pn-1 | < or when the iteration limit is reached.
8. The final results are the partition matrix U* (each entry of which represents the degree of membership), and the cluster center matrix V*.
The above algorithm may be described by employing a small data sample. Suppose we want to do clustering of data by using c = 2 cluster. Based on Table 1, the data can be expressed in matrix Z. With the number of cluster c =2, the weight parameter w = 2, and epsilon = 10-3, then the initial partition matrix U is as follows:
.
5
.
0
3
.
0
6
.
0
2
.
0
5
.
0
7
.
0
4
.
0
8
.
0
U
cluster. In this case –following the principle of fuzzy membership that uses the degree of membership– such that no data point is definite to become a member of the first cluster nor definite to become a member of the second cluster. The cluster centers based on the matrix Z and partition matrix
U above is the matrix V with ordo 3 × 2 as follows
.
1138
.
0
1713
.
0
1898
.
2
4380
.
2
5219
.
1
4534
.
1
V
The related objective function obtained is 0.4856. The next step is fixing U to become a new matrix U1:
.
5900
.
0
3393
.
0
7308
.
0
2026
.
0
4100
.
0
6607
.
0
2692
.
0
7974
.
0
1
U
The interpretation of the new partition matrix U1 is analogous to the initial matrix U as given above. By using the 8 steps to gain the final objective function of 0.4387, we get the final partition matrix U* as follows:
.
5662
.
0
7125
.
0
8911
.
0
0542
.
0
4338
.
0
2875
.
0
1089
.
0
9458
.
0
*
U
That means that for c = 2, w = 2 and = 10-3, the monthly inflation data of Jakarta tends to become a member of the first cluster with a probability of 0.9458. The monthly inflation data of Surabaya, Bandung and Bekasi tends to become members of the second cluster with the probability of 0.8911, 0.7125 and 0.5662, respectively. The cluster center V* related to the final partition matrix U* may be expressed as follows:
1504
.
0
3381
.
0
2179
.
2
5869
.
2
4123
.
1
5067
.
1
*
V
.By using the cluster center V*, the Euclidean matrix D* is:
.
6988
.
0
2744
.
0
2963
.
0
7661
.
0
7862
.
0
4472
.
0
8620
.
0
1857
.
0
*
D
where Dij presents the distance between the i-th cluster center and the j-th data point. It appears that
the greater the Euclidean distance, the less likely it is to become a member of the cluster.
Similarly, using c = 2, = 10-3, with w = 3 and w = 4, the partition matrices will be respectively as follows:
,
5234
.
0
5736
.
0
7258
.
0
2367
.
0
4766
.
0
4264
.
0
2742
.
0
7633
.
0
*
2
U
and
5190
.
0
5335
.
0
6447
.
0
3255
.
0
4810
.
0
4665
.
0
3553
.
0
6745
.
0
*
3U
.6
0001
.
0
7179
.
0
9261
.
0
0005
.
0
9998
.
0
0887
.
0
0374
.
0
0003
.
0
0001
.
0
1934
.
0
0364
.
0
9992
.
0
*
U
.It needs 10 steps, and the objective function is 0.0910. This means that when using three clusters, the monthly inflation data of Jakarta tends to become a member of the first cluster, while the monthly inflation data in Surabaya and Bandung tend to become members of the second cluster, and the data of Bekasi’s tends to be in the third cluster.
3. Methods
The data used is the monthly inflation data of 15 cities across Indonesia. Jakarta, Surabaya, Bandung, Bekasi, Tangerang, Medan, Depok, Palembang, Makassar, Batam, Jember, Bogor, Banyuwangi, Denpasar, Pekanbaru give the highest contribution to the whole inflation in Indonesia. Five cities represent the regions in Indonesia, namely Samarinda, Mataram, Manado, Ambon and Jayapura. The data are taken at the beginning of Joko Widodo Administration, from November 2014 to July 2016. Clustering is performed by using the k-means and fuzzy c-means clustering methods, where k = c = 2, 3 and 5.
4. Results and Discussion
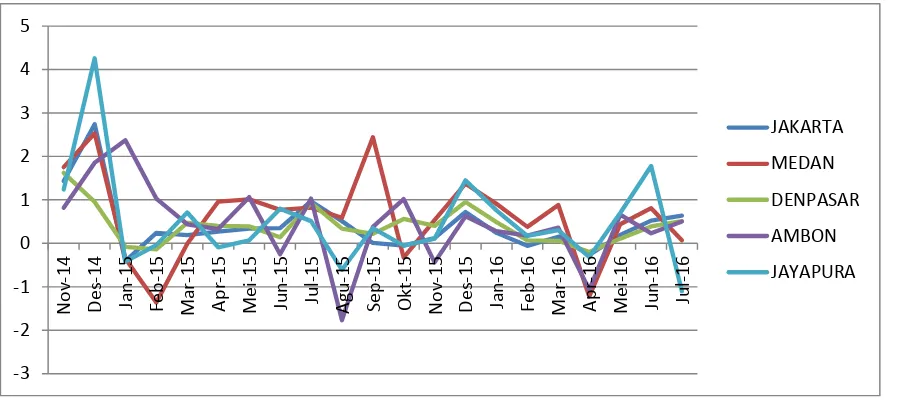
During the period of November 2014 to July 2016, the lowest average monthly inflation is achieved by Palembang, and the highest average is Medan. The lowest median is achieved by Bekasi and the highest median is Medan. The lowest standard deviation is achieved by Denpasar, while the highest is Jayapura. The lowest range is achieved by Denpasar, while the highest range is Jayapura. Fig. 1 presents the line diagram of the monthly inflation data for Jakarta, Medan, Denpasar, Ambon and Jayapura. Denpasar appears to have stable commodity prices as shown by the relatively small standard deviation compared to other cities. Contrarily, commodity prices in Jayapura are likely to fluctuate as shown by a relatively large standard deviation compared to other cities, and also supported by a relatively larger range.
Fig. 1. Line diagram of monthly inflation for the period of November 2014 to July 2016 in Jakarta, Medan, Denpasar, Ambon and Jayapura.
Employing the k-means clustering method with k = 2 clusters, Manado, Ambon and Jayapura appear to become one cluster of high inflation rates, and other cities are in the other cluster of lower inflation rate. When using k = 3 clusters, Ambon is clustered by herself as having a high inflation rate,
-3 -2 -1 0 1 2 3 4 5
N
ov
-14
De
s-14
Jan
-15
Fe
b
-15
Ma
r-15
Ap
r-15
Me
i-1
5
Ju
n
-15
Ju
l-15
Agu
-15
Se
p
-15
Okt-1
5
N
o
v
-15
De
s-15
Jan
-16
Fe
b
-16
Ma
r-16
Ap
r-16
Me
i-1
6
Ju
n
-16
Ju
l-16
JAKARTA
MEDAN
DENPASAR
AMBON
Manado and Jayapura are in one cluster of a moderate inflationrate, and other cities are in another cluster of lower inflation rate. With k = 5 clusters, Ambon is in the very high inflation cluster, Manado and Jayapura in the high inflation cluster, Medan in the medium inflation cluster. Jakarta, Surabaya, Bandung, Bekasi, Makasar, Jember, Banyuwangi, Denpasar, Samarinda and Mataram are in the lower inflation cluster, while other cities become one cluster of very low inflation rates.
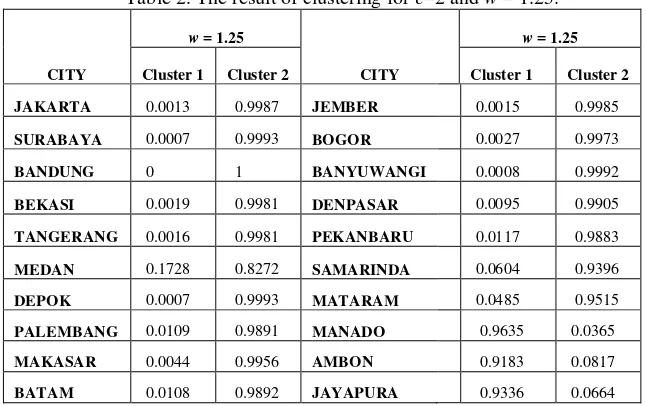
Table 2. The result of clustering for c=2 and w = 1.25.
CITY
w = 1.25
CITY
w = 1.25
Cluster 1 Cluster 2 Cluster 1 Cluster 2
JAKARTA 0.0013 0.9987 JEMBER 0.0015 0.9985
SURABAYA 0.0007 0.9993 BOGOR 0.0027 0.9973
BANDUNG 0 1 BANYUWANGI 0.0008 0.9992
BEKASI 0.0019 0.9981 DENPASAR 0.0095 0.9905
TANGERANG 0.0016 0.9981 PEKANBARU 0.0117 0.9883
MEDAN 0.1728 0.8272 SAMARINDA 0.0604 0.9396
DEPOK 0.0007 0.9993 MATARAM 0.0485 0.9515
PALEMBANG 0.0109 0.9891 MANADO 0.9635 0.0365
MAKASAR 0.0044 0.9956 AMBON 0.9183 0.0817
BATAM 0.0108 0.9892 JAYAPURA 0.9336 0.0664
Table 3. The result of clustering for c=2 and w = 1.50.
CITY
w = 1.50
CITY
w = 1.50
Cluster 1 Cluster 2 Cluster 1 Cluster 2
JAKARTA 0.3886 0.6114 JEMBER 0.3896 0.6104
SURABAYA 0.5013 0.4987 BOGOR 0.3222 0.6778
BANDUNG 0.2910 0.7090 BANYUWANGI 0.4514 0.5486
BEKASI 0.3587 0.6413 DENPASAR 0.4579 0.5421
TANGERANG 0.3449 0.6551 PEKANBARU 0.4098 0.5902
MEDAN 0.5111 0.4889 SAMARINDA 0.6639 0.3361
DEPOK 0.2519 0.7481 MATARAM 0.6206 0.3794
PALEMBANG 0.3418 0.6582 MANADO 0.5694 0.4306
MAKASAR 0.5060 0.4940 AMBON 0.5917 0.4083
BATAM 0.4009 0.5991 JAYAPURA 0.5589 0.4411
Employing the fuzzy c-means method with the parameter w = 1.25 to create c=2 clusters, Manado, Ambon and Jayapura tend to become one cluster of high inflation rates, and other cities in the other cluster of low inflation rates. The clustering only yields cities which tend to form one cluster with the probabilities between 0 and 1. With the parameter w = 1.50, and c = 2, Manado, Ambon, Jayapura, Samarinda, Mataram, Surabaya, Medan and Makasar tend to be in one cluster, and the other cities tend in the other cluster.
[image:8.595.129.449.431.633.2]8
parameter w = 1.5 and c = 3, Manado, Ambon and Jayapura tend to become one cluster of high inflation. Surabaya, Bandung, Medan, Makasar, Banyuwangi, Denpasar, Samarinda and Mataram tend to form a medium inflation cluster, and other cities in a lower inflation cluster.
With the parameter w = 1.25 and c = 5, Ambon tends to form a very high inflation cluster. Jayapura and Manado in a high inflation cluster, Medan in a medium inflation cluster, and Jakarta, Surabaya, Bandung, Bekasi, Makasar, Jember, Banyuwangi, Denpasar, Samarinda and Mataram in a low inflation cluster, and the rest are in a very low inflation cluster. With the parameter w = 1.5 and c
= 5, Ambon tends to form a very high inflation cluster. Manado and Jayapura tend to be in a high cluster, Surabaya, Bandung, Makasar, Samarinda and Mataram in a cluster. Tangerang, Medan, Batam, Bogor and Samarinda tend to be in a low inflation cluster, and the rest of the cities tend to be in a very low inflation cluster.
The fuzzy c-means method in this research is applied using the Eucledian distance, while the Mahalanobis distance can also be used as in paper [5]. There is another paper about fuzzy c-means clustering is [7], while ours also compares the results to those obtained by the k-means clustering method. It also cover wider geographical area of Indonesia. Fuzzy c-means method is also used in the paper [4], meanwhile k-means clustering method is also used in [8]. The comparison of the two methods may be found in the paper [2].
5. Conclusion
This paper has discussed the clustering of inflation data by using the k-means method and the fuzzy c -means method. This research may be extended by applying other clustering methods and longer periods of data.
References
[1] BPS, 2016, Berita Resmi Statistik No. 67/08 Tahun XIX, 01 Agustus 2016, Badan Pusat Statistik, Jakarta.
[2] Sheshayee, A. & P. Sharmila, 2014, Comparative Study of Fuzzy C-Means and K-Means Algorithm for requirements Clustering, Indian Journal of Science and Technology, Vol 7 (6) page 853-857.
[3] Sanmorino, A., 2012, Clustering Batik Images using Fuzzy C-means Algorithm Based on Log-Average Luminance, Journal of Computer Engineering and Applications Vol. 1, No. 1.
[4] Rustempasic, I. & M. Can, 2013, Diagnosis of Parkinson’s Disease using Fuzzy C-Means Clustering and Pattern Recognition, Southeast Europe Journal of Soft Computing.
[5] Liu, Hsiang-Chuan, Bai-Cheng Jeng, Jeng-Ming Yih, Yen-Kuei Yu, 2009, Fuzzy c-means Algorthm Based on Standard Mahalanobis Distances, Proceedings of the 2009 International Symposium on Information Processing.
[6] Suganya, R., R. Shanthi, 2012, Fuzzy C-Means Algorithm A Review, International Journal of Scientific and Research Publications Vol. 2 Issue 11.
[7] Setiawan, A. & B. Susanto, 2016, Inflation data clustering of some cities in eastern Indonesia, it was presented in Asian Mathematical Conference, Denpasar, Bali 25-29 July 2016.
[8] Salman, Raied, V. Kecman, Q. Li, R. Strack, E. Test, Fast K-means Algorithm Clustering,