This content has been downloaded from IOPscience. Please scroll down to see the full text.
Download details:
IP Address: 103.9.183.251
This content was downloaded on 29/03/2016 at 09:47
Please note that terms and conditions apply.
Using computer aided system to determine the maximum depth of visualization of B-Mode
diagnostic ultrasound image
View the table of contents for this issue, or go to the journal homepage for more
Using computer aided system to determine the maximum
depth of visualization of B-Mode diagnostic ultrasound image
G Maslebu1, K Adi2 and Suryono2
1 Physics Department, Satya Wacana Christian University, 52-60 Diponegoro Street, Salatiga 50711, Indonesia
2 Instrumentation and Electronics Laboratory, Faculty of Science and Mathematics, Diponegoro University, Professor Haji Soedharto Street,Semarang 50275, Indonesia
E-mail: [email protected]
Abstract. In the service unit of radiology, ultrasound modality is widely used because it has advantages over other modalities, such as relatively inexpensive, non-invasive, does not use ionizing radiation, and portable. Until now, the method for determining the depth visualization on quality control program is through the visual observation of ultrasound image on the monitor. The purpose of this study is to develop a computer-aided system to determine maximum depth of visualization. Data acquisition was done by using B-Mode Diagnostic Ultrasound machine and Multi-purpose Multi-tissue Ultrasound Phantom model 040GSE. Phantom was scanned at fixed frequency of 1,8 MHz, 2,2 MHz, 3,6 MHz and 5,0 MHz with a gain variation of 30 dB, 45 dB, and 60 dB. Global thresholding and Euclidean distance method were used to determine maximum visualization depth. From this study, it is proved that the visualization depth using computer aided provide deeper visualization than visual interpretation. The differences between expert verification and the result of image processing are < 6%. Thus, computer aided system can be used for the purpose of quality control in determining maximum visualization depth of B-Mode diagnostic ultrasound image.
1. Introduction
In the service unit of radiology, ultrasound modality is widely used because it has advantages over other modalities, such as relatively inexpensive, non-invasive, non-ionizing radiation, and portable [1]. It has been reported that in 2000 there were 5 million ultrasound scanning around the world per week [2].
Quality Control (QC) is part of the Quality Assurance (QA) activities that emphasize its program on the techniques needed on supervision, maintenance, keeping the technical elements of radiography and imaging equipment system that affects image quality. Quality control is needed in radiology to convince a radiology specialist doctor that the used modality is in the best condition for reading (interpretation) the image [3]. In order to provide maximum service quality, then the quality assurance of ultrasound modality should be done within a certain period of time continuously [4]. In an effort to maintain the quality of ultrasound modality, the medical physicist is in charge of designing and implementing QA. Basic QA for the phantom tests are the visual evaluation of image uniformity, accuracy of quantitative evaluation of vertical distance, horizontal distance accuracy and maximum penetration depth [5].
Recent studies for the quality control of ultrasound has shown that the use of a computer for ultrasound image analysis ultrasound has advantages or the potentially increase its usefulness. Computer aided system can be used for distance measurement [6] and determining the image uniformity on the ultrasound quality control [7].
One of the QC parameters for ultrasound is the depth of visualization. Until now, the method for determining the depth visualization is through the visual observation of ultrasound image on the monitor [8].
Based on the problem above, a computer aided system was developed to analyse the visualization depth of ultrasound image for better quantification using a parameter of frequency and gain. It is expected to provide contributions for the QC program that impact on improving the quality of health services to society.
2. Methods
This study used B Mode medical ultrasound, multifrequency transducer, Curved Array Transducer CH5-2, Multi-purpose Multi-tissue Ultrasound Phantom to test the functionality and quality using ultrasound phantom CIRS brand 040GSE models, and computers equipped with software for image processing. During scanning of the phantom, coupling gel was applied to the surface of phantom or transducer as a medium that allows the energy coupling of ultrasonic waves to travel freely between the surface of the phantom and transducer. In this study, the frequency is set at a fixed value of 1.8 MHz, 2.2 MHz, 3.6 MHz and 5 MHz, while the gain variation in the value of 30 dB, 45 dB, and 60 dB. For the data analysis process, there are three main procedures, namely:
1. Making of Graphical User Interface (GUI) for image processing in the following order:
1.1. Reading image from data acquisition on a computer using software developed for image processing.
1.2. The region of interest (ROI) selection with ultrasound image cropping techniques for the determination of ROI as an area to be analyzed further.
1.3. Image segmentation to separate the object from the background image based on intensity. Segmentation of ROI in this study is conducted by global thresholding method.
1.4. Determination of the maximum visualization depth is determined according to Euclidean distance method, i.e. the distance between the surfaces to the deepest phantom object from segmentation results.
2. Maximum depth of visualization was determined by the expert.
Maximum depth of visualization was compared between computational result and expert’s visual interpretation.
3. Results and discussion
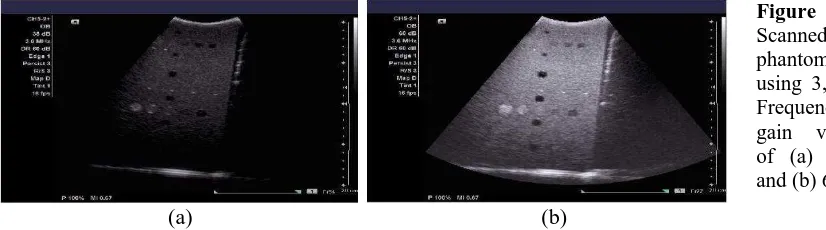
Figure 1 shows the results of a scanned phantom image with anechoic test target object using a transducer with a frequency of 3.6 MHz and gain of 45 dB and 60 dB. From those images, visually, increase in gain causes the image brighter so that objects that are far from the surface of the phantom can be observed [9]. It also occurs in the image of the scanned phantom with another frequency and gain variation.
13th South-East Asian Congress of Medical Physics 2015 (SEACOMP) IOP Publishing Journal of Physics: Conference Series694(2016) 012052 doi:10.1088/1742-6596/694/1/012052
An image is defined in 2-dimensional function f(x,y), where x and y are the spatial coordinate and amplitude of f in certain (x,y) is called gray level. In image processing, this image is represented by a pixel (picture element) matrix M x N with the coordinate system is shown in figure 2 [10].
, =
[
, , … , −
, , … , −
− , − , … − , − ]
Figure 2. Pixel coordinates system.
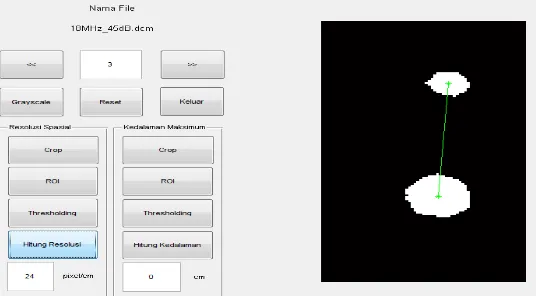
The spatial resolution is an indicator of the number of pixels per unit length [11]. Spatial resolution measurement is done by counting the number of pixels that exist between the center (centroid) of the two nearest objects. For the 8-bit image, the gray value of each pixel ranges from 0-255. A value of 0 means black and 255 means white. Determination of the centroid of the two nearest object using global thresholding method from the Region of Interest (ROI) and resulted in the object of 8 bits are converted into binary (black and white). Anechoic objects that are further analyzed in the form of a white object. The next two nearest object will be selected to analyze the value of spatial resolution, which is the number of pixels divided by the distance between the center (centroid) of the second object. Illustration of determining the spatial resolution is shown in figure 3.
Figure 3. Determination of spatial resolution using computer aided system.
The spatial resolution has a constant value of 24 pixel/cm. Determination of maximum depth of visualization based on the Euclidean distance vertically position of the furthest object from the surface of the phantom image. Pixel coordinate of the phantom’s surface and the deepest object are (x1,y1) and (x2, y2), respectively. Thus, the number of pixels determined by using Euclidean distance formula [12]
� = √ − + − (1)
The distance in cm unit is determined using equation (2) and (3):
� � = �� � � (2)
�� = � �
� � � /
(3)
of the visualizations depth with image processing techniques is <6%. Smaller percentage error means the better value of the visualization depth determination.
Table 1. Percentage error of visualization depth result from computer aided system
Depth of Visualization (cm) The difference (cm) Percentage error
aa bb b-a − × %
aMaximum depth of visualization from an expert.
bMaximum depth of visualization from computer aided system adjusting with the expert.
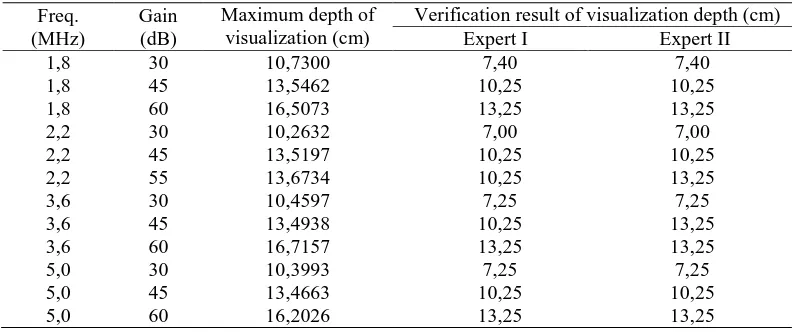
Table 2. Comparison between computer aided system and expert observing result of depth of visualization than the human eye's ability to see objects on ultrasound phantom image. Two different experts determined the same value of visualization depth for almost all data, but still there are differences in using 2,2 MHz of the frequency with 55 dB of gain and using 3,6 MHz of the frequency with 45 dB of gain. It means that visual interpretation is possibly different among observers. Thus, it can be said that the computer as a tool to study images for maximum depth of visualization purposes has advantages in determining the farthest objects that are difficult to distinguish by the normal eyes so that it can be used for quality control purposes.
4. Conclusion
Based on a study that has been done, it can be concluded that computer aided system can be used for quality control purposes in determining maximum depth of visualization with thresholding method for segmentation of objects from the background image and Euclidean distance for determining the distance. In this case, maximum depth of visualization using computer aided system is deeper than the 13th South-East Asian Congress of Medical Physics 2015 (SEACOMP) IOP Publishing Journal of Physics: Conference Series694(2016) 012052 doi:10.1088/1742-6596/694/1/012052
visual observations. The difference between the results of the expert verification and developed computer aided system is <6%.
References
[1] Tyovenda A A, Aiyohuyin E O and Akaagerger N B 2013 Diagnostic ultrasound quality assurance by means of machine output parameters Int. J. Sci. Technol. 3 287-90
[2] Szabo T L 2004 Diagnostic ultrasound imaging: Inside out (UK: Elsevier Academic Press) [3] Bushong S C 2001 Radiologic science for technologists physics, biology and protection,
Seventh Edition (St Louis: Mosby Inc)
[4] Dudley N J, Griffith K, Houldsworth G, Holloway M, and Dunn M A 2001 A Review of two alternative ultrasound quality assurance programmes European. J. of Ultrasound 12233-45
[5] Tradup D J, Hangiandreou N J and Taubel J P 2003 Comparison of ultrasound quality assurance phantom measurements from matched and mixed scanner-transducer combination J. App.Clin. Med. Phys 4 239-47
[6] Fallo F, Adi K and Suryono 2014 Perancangan Model Pengukuran Jarak Menggunakan Computer-Aided pada Kontrol Kualitas Ultrasonografi Berkala Fisika 17 13-20
[7] Sudarsih K, Budi W S and Suryono 2014 Analisis keseragaman citra pada pesawat ultrasonografi (USG) Berkala Fisika 17 33-8
[8] Choi J I, Jung S E, Kim P N, Cha S H, Jun J K, Lee H Y and Park E C 2014 quality assurance in ultrasound screening for Hepatocellular Carcinoma using a standardized phantom and standard clinical images: A 3-year national investigation in Korea, J. Ultrasound Med. 33
985-95
[9] Thijssen J M, Weijers G and De Korte L C 2006 Objective performance testing and quality assurance of medical ultrasound equipment Ultrasound and Med. & Biol., 33460-71
[10] Prasetyo E 2011 Pengolahan citra digital dan aplikasinya menggunakan MATLAB (Yogyakarta: Penerbit ANDI)
[11] Aksoy P and DeNardis L 2008 Information technology in theory (Vancouver: Thomson Learning.Inc)
[12] Maslebu G, Adi K and Suryono 2015 Effect of gain changing to maximum visualization depth on diagnostic ultrasound B-mode image Int. J. App. Eng. Research ISSN 0973-4562 10
33449-52