Combined use of SAR and optical data for environmental assessments
around refugee camps in semiarid landscapes
A. Braun a, *, V. Hochschild a a
Institute for Geography, University of Tübingen, 72070, Tübingen, Germany – [email protected] a
Institute for Geography, University of Tübingen, 72070, Tübingen, Germany – [email protected]
KEY WORDS: SAR, refugee camps, landscape capacity, biomass, machine learning
ABSTRACT:
Over 15 million people were officially considered as refugees in the year 2012 and another 28 million as internally displaced people (IDPs). Natural disasters, climatic and environmental changes, violent regional conflicts and population growth force people to migrate in all parts of this world. This trend is likely to continue in the near future, as political instabilities increase and land degradation progresses.
EO4HumEn aims at developing operational services to support humanitarian operations during crisis situations by means of dedicated geo-spatial information products derived from Earth observation and GIS data. The goal is to develop robust, automated methods of image analysis routines for population estimation, identification of potential groundwater extraction sites and monitoring the environmental impact of refugee/IDP camps.
This study investigates the combination of satellite SAR data with optical sensors and elevation information for the assessment of the environmental conditions around refugee camps. In order to estimate their impact on land degradation, land cover classifications are required which target dynamic landscapes. We performed a land use / land cover classification based on a random forest algorithm and 39 input prediction rasters based on Landsat 8 data and additional layers generated from radar texture and elevation information. The overall accuracy was 92.9 %, while optical data had the highest impact on the final classification. By analysing all combinations of the three input datasets we additionally estimated their impact on single classification outcomes and land cover classes.
* Corresponding author.
1. INTRODUCTION
2013 was the first year in which over 50 million people were reported by the United Nations High Commissioner for Refugees which were forced to leave their homes (UNHCR, 20131). The reasons are environmental changes at various levels, such as floods, droughts, bad harvests, forest fires or natural disasters as well as social and political causes like civil wars, terrorism, political instabilities or poverty. These people often gather in spontaneously arising camps without any central control. When humanitarian operatives arrive at these locations they frequently struggle with the organization of the camp and lack of information. Most important is information about the current population and structure of the camp as well as the distribution of ground water in the vicinity of the settlement. However, information about the environment and the impacts of the refugee camps on the surrounding resources have found to be important as well to both the people working in the camps (Füreder et al., 2014) and regarding the prevention of further migrations (Hagenlocher, 2011). Satellite remote sensing can deliver fast and reliable information and is especially helpful in regions where field measurements and extensive mapping campaigns are not possible due to security regions. They can assist planning and decision-making by authorities or governments in order to achieve a long-term management of land use and resources. This study investigates the potential of the combined use of optical and synthetic aperture radar (SAR) data as well as elevation information for land cover assessments in refugee
area regions. The following points have to be incorporated when talking about humanitarian operations:
Operationalization: The method should be automatable or at least be conducted within a short time in order to provide valuable information the case of emergency.
Transferability: As refugee camps are distributed all over the world, the developed method should not target particular climates or ecosystems.
Data availability and processing: We placed interest in the utilization of freely available datasets and software.
Our study therefore addresses the effective integration of various data sources and how a work flow must be designed in order to fulfill the criteria mentioned above.
Additionally, we try to estimate the percentage of each input data’s contribution to the final result. The benefit of SAR data is of peculiar interest as many refugee camps lie within regions with difficult climatic conditions such as thick cloud cover and haze, which can be penetrated by microwaves (van Zyl & Kim, 2011).
2. STUDY AREA AND DATA SETS
2.1 Study area
originally designed for 40.000 refugees but in the meanwhile hosts a number of over 52.000 persons (UNHCR, 20142).
Figure 1. Location of the study area
The climate is characterized as hot-summer Mediterranean climate (Csa) according to the Koeppen-Geiger classification with a rainy season from October to May and drought between June and September. The annual precipitation lies around 600 mm. Surrounding landscapes are characterized by extensive agricultural use, shrub vegetation and open ground with sandy soils or bare rocks.
Due to the increasing impact on the natural resources environmental assessments are needed to develop long-term strategies of sustainable land use. However, agricultural patterns are difficult to detect by optical sensors alone, especially the distinction between cropland of different intensities and pasture is a problem.
2.2 Input data and method
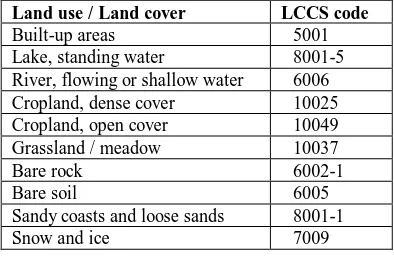
Table 1 summarizes the input data sets used in this study. Landsat OLI/TIRS (L8) was launched in early 2013 and offers 8 bands with a spatial resolution of 30 meters. We did not include the panchromatic (15 meters) nor the thermal infrared bands (100 meters) in our analyses in order to grant spatial consistency. Sentinel-1 (S1) is a C-band radar satellite and was launched within the GMES program by the European Space Agency (ESA) in April 2014 (Torres et al. 2014). The data was purchased as a Level-1 product in Interferometric Wide Swath mode (IW) and has a spatial resolution of 10 meters. It was
Data Date Description Source
Landsat 8 19.01.2015 VV and VH USGS 2015 Sentinel-1 20.01.2015 Level-1B ESA 2015
SRTM - 3 ArcSecond Jarvis 2008 to treat the input datasets individually searching for patterns (Breimanet al., 2001). Random Forests use the principle of Classification And Regression Trees (CARTs, Breiman et al. 1984). A CART tries to segment a predictor space into a number of homogenous regions which can then be predicted by a generated rule set based on the input data. Random Forests generate a multitude of CARTs based on different selections of the input data sets which are later summed up to one final result. This result can be a map which is represented by pixels of the smallest spatial resolution in the training data, in our classes used for our study area.
Land use / Land cover LCCS code
Built-up areas 5001
Lake, standing water 8001-5 River, flowing or shallow water 6006 Cropland, dense cover 10025
Cropland, open cover 10049
Grassland / meadow 10037
Bare rock 6002-1
Bare soil 6005
Sandy coasts and loose sands 8001-1
Snow and ice 7009 occurrence matrix (GLCM), which is an acknowledged method in order to retrieve second order textures. The following parameters were calculated for both polarizations with window sizes of 3, 5 and 9 pixels: Contrast, Correlation, Energy and Heterogeneity. An example is given in Figure 2. This resulted in a total of 24 texture layers. These, however, underlie a considerable degree of redundancy and therefore we conducted a principal component analysis (PCA), resulting in 8 combined texture layers.
Additionally, a digital terrain analysis was performed on the SRTM data calculating the following parameters: Elevation, slope, profile curvature, northness and eastness. Again, different window sizes (3, 5, 25, and 45 pixels) were applied, resulting in a total of 20 terrain parameters.
Figure 2. Example for S1 textures: Raw VH image, homogeneity size 9, contrast size 5
Figure 3. Example for SRTM terrain parameters: Elevation, curvature size 9, slope size 25, northness size 45
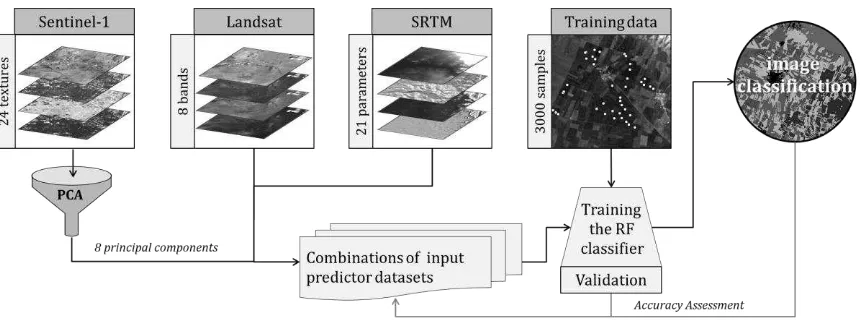
Figure 4. Workflow of the study
Figure 4 illustrates the workflow designed for this study. First, all input layers get pre-processed and textures and terrain parameters are calculated at different scales. Subsequently, the RF classifier gets trained with various input subsets in order to estimate each dataset’s contribution to the classification. Accuracy assessments are performed for each subset. The final classification is performed with all 39 prediction layers.
3.2 Training and Classification
Training a random forest classifier requires knowledge of several parameters which are explained in the following (Values in brackets were used for this study):
Number of trees (500): The number iterations calculating rulesets based on input layer subsets.
Maximum features (6, as a square root of all input layers): The number of randomly chosen input layers per iteration. Minimum samples per split (2): The minimum number of
samples required to split an internal node.
Maximum depth (none): The maximum number of splits for each tree. None means, that nodes are expanded until all leaves are pure or contain less than given in Minimum samples per split.
Bootstrap (yes): If bootstrap (Efron, 1978) samples are used for the building of the trees or not or not.
The training has been performed by 2200 manually digitized sample points (200-300 per class) and another 800 for the validation process which will be showed in the following chapter.
3.3 Post-processing
4. RESULTS
4.1 Accuracy Assessment
Including all 39 predictor rasters we achieved an overall accuracy of 92.74 % and a kappa accuracy of 91.93 %. Table 3 shows the result of the accuracy assessment performed on the data. It can be seen that all classes reveal very high classification accuracies, while dense cropland, bare rocks, sandy areas and snow are classified best. Lowest values are shown by open cropland and bare soil.
Class UA PA
Table 3. User’s accuracy (UA) and producer’s accuracy (PA) for each class (incl. standard errors)
Table 4 shows the classification errors of the output map and
Table 4. Errors of commission and omission for each class (Standard error)
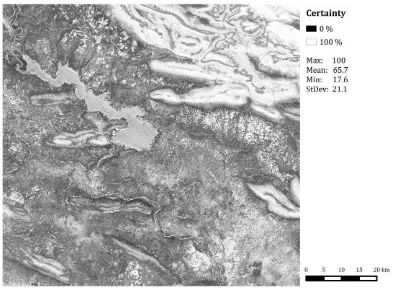
A map of the certainty based on the class probabilities generated by the RF is shown in Figure 6 (Appendix). It reveals the areas which are most sensitive for modelling, namely the edges of snow-covered areas, vegetated ridges and grassland partly covered by shrubs. In turn, water areas, dense croplands, bare rocks and areas with thick layers of snow have high classification certainties.
4.2 Map output
A map of the final classification is shown in Figure 5 (Appendix). It has a spatial resolution of 10 meters and gives a good overview over the spatial distribution of land use / land cover classes in the study area. Two large cities can be seen:
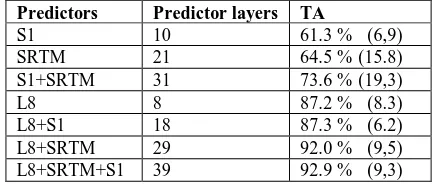
Dohuk (500000 inhabitants) in the north and Mosul (nearly 3 million inhabitants) in the Southwest. Several smaller towns, villages and single buildings are scattered throughout the whole study area. The pattern of dense and open agricultural land as well as grasslands or pasture showed best results in the Northwest and Southwest. Large bodies of bare mountain planes and ridges extend in the Northeast. As the date if image acquisition was in January, some of them are covered in snow. The Tigris River reaches from Northwest to Southeast and classification process, we performed a 10-fold cross validation for every classifier and different combinations of input datasets. Table 4 summarizes the training accuracies (TA) of the classifier and demonstrates how well the RF matched the trained data based on various predictor layers. It can be observed that S1 or SRTM data alone are not suitable for a classification. Even though they provide more predictor layers their TAs are noticeable below the one of the L8-only classification. As many classes show a variety of reflectance within the L8 spectrum, it unsurprisingly turns out to have the largest impact on classification. We can also conclude that the number of input layers is not necessarily linked to the training accuracy. It furthermore shows that a substantial increase of the TA can be achieved by combining complementary datasets.
Predictors Predictor layers TA
Table 4. Training accuracies with various inputs
In order to investigate the suitability of different input datasets for the classification of different land use / land cover types we also performed accuracy assessments for the different combinations of input data. Table 5 lists the classes which achieved the highest and lowest accuracy for each possible combination of input data. It shows that classes which are related to certain topography (Snow, water) can be derived from the SRTM quite well, but not local patterns (agriculture). In turn, classes which generate a typical backscatter (Built-up areas, different types of water) are recognized in SAR data.
Predictors Class with highest / lowest accuracy
S1 Built-up area (82.2) / Cropland, open (35.6) SRTM Snow / ice (100.0) / Cropland, dense (19,7) S1+SRTM Snow / ice (100.0) / Cropland, dense (21,0) L8 Sandy coasts (100.0) / Bare soil (60.1) L8+S1 Cropland, dense (100.0) / / Bare soil (58.7) L8+SRTM Snow / ice (100.0) / Cropland, open (77.1)
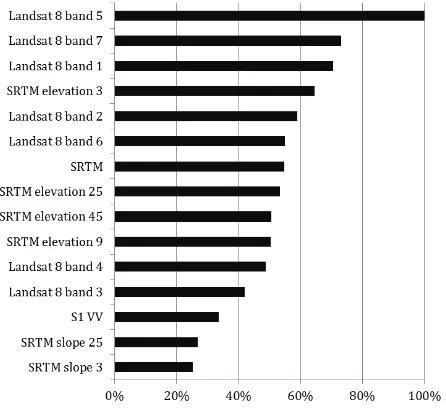
Figure 5 lists the feature importance of the 15 most valuable predictor layers. It determines how often a predictor layer was used in the split points of each tree. It is therefore a measure for the contribution of each raster layer to the final classification. The importance of Landsat 8 data can be clearly seen, especially of the near-infrared band. It is furthermore demonstrated that the elevation information is the most important terrain parameter based on the SRTM and the fewest averaged elevation is slightly more valuable than the original data. Sentinel-1 seems to plays an underpart in this list. The fact that only one predictor layer among the first 15 is from Sentinel-1, can be explained by different area proportions of the outcome classes: While S1 data was important to discriminate flowing and standing water for example, classes with larger area proportions in the map (snow, bare soils and rocks) are mainly classified by L8.
Figure 5. Feature importance of the 15 most important prediction layers.
5. CONCLUSIONS & OUTLOOK
This study gave an example on the integrated use of datasets from different origins for an assessment of environmentally relevant land use / land cover classes. These are notably helpful in situations where dynamics arise from uncontrollable origins. Remote sensing can assist information provision and support decisions of planners, politicians or humanitarian forces in areas where no field campaigns are possible or situations require fast action.
This study is a first approach to a long-term monitoring of natural resources within the area around the refugee camp of Domeez. The identified classes are standardized and non-overlapping so future studies can build on this classification. A change analysis could not yet be performed due to the fact that Sentinel-1 operates since late 2014. However, multi-temporal analyses are planned in order to carry on the approach. The random forest algorithm turned out to be a good foundation for the study as it incorporates the different spatial resolutions of the input datasets. It furthermore selects the resulting map. The calculation of texture parameters enriched the feature space by the factor of 10 and therefore helped to train the RF classifier.
ACKNOWLEDGEMENTS
This work was supported by the Austrian Research Promotion Agency (FFG) under the Austrian Space Applications Programme (ASAP 9, Nr. 840081).
REFERENCES
Breiman, L., 2001. Random Forests. Machine Learning 45 (1), 5–32.
Breiman, L., Friedman, J.H., Olshen, R.A., Stone, C.J., 1984. Classification and Regression Trees,. Belmont, Wadsworth.
Di Gregorio, A., 2005. Land cover classification system. Classification concepts and user manual, Rev. Food and Agriculture Organization of the United Nations, Rome.
Efron, B., 1979. Bootstrap Methods: Another Look at the Jackknife. The Annals of Statistics 7 (1), 1–26.
Füreder, P., Wendt, L., Hagenlocher, M., Rogenhofer, E., Lang, S., 2014. Results of online survey "User requirements for geospatial information products". Issue 1.1. Internal document of the project "EO4HumEn".
Hagenlocher, M., Lang, S., Tiede, D., 2012. Integrated assessment of the environmental impact of an IDP camp in Sudan based on very high resolution multi-temporal satellite imagery. Remote Sensing of Environment 126, 27–38.
Jarvis, A., Reuter, H.I., Nelson, A., Guevara, E., 2008. Hole-filled SRTM 90m Digital Elevation Data.
Loew, A., Mauser, W., 2007. Generation of geometrically and radiometrically terrain corrected SAR image products. Remote Sensing of Environment 106 (3), 337–349.
Malas, N., 2015. Mosul Dam's Takeover by ISIS Raises Risk of Flooding. Constant Maintenance Needed to Avoid Catastrophic Failure of Dam's Structure. The Wall Street Journal 2015.
2014. U.S. Releases Enhanced Shuttle Land Elevation Data. National Aeronautics and Space Administration. 08.10.2014.
Torres, R., Snoeij, P., Geudtner, D., Bibby, D., Davidson, M., Attema, E., Potin, P., Rommen, B., Floury, N., Brown, M., Traver, I.N., Deghaye, P., Duesmann, B., Rosich, B., Miranda, N., Bruno, C., L'Abbate, M., Croci, R., Pietropaolo, A., Huchler, M., Rostan, F., 2012. GMES Sentinel-1 mission. Remote Sensing of Environment 120, 9–24.
UNHCR. Domiz Camp Profile, December 2014.
UNHCR, 2014. Global Trends 2013, www.unhcr.org/statistics. (Accessed 27.12.14).
APPENDIX
Figure 5. Final classification