ESTIMATION OF GEOGRAPHICAL DATABASES CAPTURE SCALE BASED ON
INTER-VERTICES DISTANCES EXPLORATION
J-F. Girres ab
a UMR GRED, Université Paul Valéry Montpellier 3, 34199 Montpellier, France - [email protected] b
COGIT-IGN, Université Paris Est, 94165 Saint-Mandé, France
Commission II, WG II/4
KEY WORDS: Geographical databases, Imprecision, Level of detail, Capture scale, Digitizing error
ABSTRACT:
This article presents a method to estimate the capture scale of a geographical database based on the characterization of its level of detail. This contribution fits in a larger research, dealing with the development of a general model to estimate the imprecision of length and area measurements computed from the geometry of objects of weakly informed geographical databases. In order to parameterize automatically a digitizing error simulation model, the characteristic capture scale is required. Thus, after a definition of the different notions of scales in geographical databases, the proposed method is presented. The goal of the method is to model the relation between the level of detail of a geographical database, by exploring inter-vertices distances, and its characteristic capture scale. To calibrate the model, a digitizing test experiment is provided, showing a clear relation between median inter-vertices distance and characteristic capture scale. The proposed knowledge extraction method proves to be the usefull in order to parameterize the measurement imprecision estimation model, and more generally to inform the database user when the capture scale is unknown. Nevertheless, further experiments need to be provided to improve the method, and model the relation between level of detail and capture scale with more efficiency.
1. INTRODUCTION
1.1 Context of the study
Despite a large number of contributions during the last decades (Devillers et al., 2010), or range of indicators proposed by standardization organizations (ISO 19157, 2013), the communication of the impact of spatial data quality to the final user remains a major issue. Concerning more particularly the geometrical quality of vector data, if indicators are proposed to inform the user on the positionning of objects, the estimation of the imprecision of geometric measurements (i.e. length and area computed from the geometry of vector objects) is still a difficult task to realize.
Indeed, the estimation of geometric measurements imprecision requires to identify all the potential causes affecting geometric measurements, and model their impacts. In this context, the goal of this research deals with the development of a general model to allow a user of geographical data to estimate the imprecision of geometric measurements computed from weakly informed databases, without any reference data (Girres, 2011b). It supposes to (a) identify all the potential causes affecting geometric measurements, (b) develop models to estimate these impacts on measurements, (c) communicate measurement imprecision to the final user.
To ensure the operational efficiency of the proposed model, an appropriate parameterization needs to be performed. As a consequence, various information are collected according to the causes of measurement error and the characteristics of the assessed database. But the avalaibility of these information is not systematic, espacially when the database is poorly informed (e.g. absence of metadata).
As proposed in this paper, some of these information can be extracted directly from the data using exploratory methods, in a strategy of self-characterization of the data.
1.2 Causes of measurement error
As mentioned previously, the first step of this research is to identify all the potential causes of measurement error on geographical data, and to develop appropriate models in order to estimate their respective impacts. Then, a conceptual framework is proposed, dividing causes of measurement error in two categories: the representation rules and the production processes of the data (see Girres, 2011b and Girres, 2012).
In the representation rules of geographical data, three potential impacts on measurements have been identified: cartographic projection (Chrisman and Girres, 2013), not taking account of the terrain, and polygonal approximation of curves (when real world entities are curves). Concerning the impacts of the production processes of the data, two processes have been studied: the impact of the digitizing error of the operator, and the impact of cartographic generalization (when data is created using map sources). The impact of Global Navigation Satellite System (GNSS) error has not be integrated in the general model, because of the difficulty to parameterize all the potential sources of error (e.g. environmental context). Morevover, data captured using GNSS devices are rarely integrated rawly in a geographical database. They are generally controled and modified by an operator. As a consequence, the final error can be finally associated to digitizing error.
1.3 Digitizing error simulation model
The modeling of digitizing error has already been widely studied in the field of spatial data quality, about its impact on the positionning of geographical objects (Keefer et al., 1988; Bolstad et al., 1990; Hunter and Goodchild, 1996), or on geometric measurements (Chrisman and Yandell, 1988; Griffith, 1989; Goodchild, 2004). As proposed by Goodchild et al. (1999), models based on Monte-Carlo simulations can be used to estimate the impact of digitizing error on length and area measurements. This strategy supposes to simulate digitizing error by generating random errors (i.e. a noise following a normal distribution) on the vertices of the geometry. Using a large number of simulations, the sensibility of geometric measurement computed from simulated objects can be studied in order to estimate its imprecision.
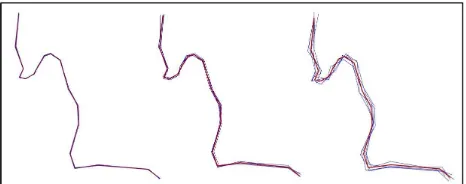
In this research, a model based on Monte-Carlo simulations is proposed to assess the impact of digitizing error on geometric measurements. The developed model integrates a set of constraints (see Girres, 2012) in order to preserve the realism of simulated objects, or to integrate a correlation of errors between successive vertices, as proposed by De Bruin (2008) or De Bruin et al. (2008). The principal limitation of this method deals with the parameterization of the amplitude of the noise affected on the vertices of simulated objects.
Figure 1. Simulations of digitizing error using different amplitudes of the random noise.
As exposed in Figure 1, the amplitude of the noise directly impacts the simulated measurement imprecision. Thus, in the context of a “user friendly” model developed for non-specialist users, its parameterization needs to be performed automatically. In this context, the development of exploratory methods to automatically characterize the database is proposed.
1.4 Parameterization of digitizing error
To parameterize the noise amplitude affected on each vertex of the simulated geometry, we followed the recommendations in the field of photogrammetry. Chandelier (2011) estimates the precision of planimetric restitution according to the average scale 1/E and a constant σc, as defined in Equation 1.
σp2 = σx2 + σy2 = E * σc0,5 (1)
where σp is planimetric precision σc is a digitizing precision constant E is the average scale
In standard conditions, according to Chandelier (2011), σc is equal to 0,2 μm, which means that:
σp2 = E * 0.2 mm (2)
This estimation of planimetric precision is also mentioned by data producers. For instance in the technical notice of the database Histolit-v2.0 (IGN-SHOM, 1992), the dataset TC250000 (shoreline at the scale 1:25.000) is described with “a digitizing precision estimated better than 0.2 mm” and “a geometric precision estimated at 0.3 mm, corresponding as a ground truth of 12 m.”. This example shows that the planimetric precision, used to parameterize the digitizing error simulation model, can be formalized according to the average scale of the objects of the geographical database.
In this context, to allow the parameterization of the model used to estimate the impact of digitizing error on geometric measurements, the average capture scale of the database needs to be defined. Unfortunately, this information is rarely mentioned. Thus, this article proposes a method to estimate the capture scale of a database when this information is absent.
The next section will present the notion of scale in geographical databases. Then, we will present in section 3 the proposed method, based on inter-vertices distances
The notion of scale in geographical databases is supposed to be a simple notion. The scale is defined as the relation between a distance measured on a map and its value on the ground (Ruas, 2002). But if a map has a fixed scale, this is not the case for geographical databases.
2.1 Representation scale
Ruas and Mustière (2002) agree to tell that geographical databases do not have a scale, but are produced to be used in a scale-range. For instance, the BDTOPO database can be used from a scale of about 1:5.000 to a scale of about 1:50.000 (IGN, 2011a) and the BDCARTO database (IGN, 2011b) from a scale of about 1:50.000 to a scale of about 1:250.000. Then, we talk about the representation scale-range of the database. Nevertheless, we generally accept that the characteristic representation scale is the most appropriate scale used to represent the data. It is about the scale 1:10.000 for the BDTOPO and the scale 1:50.000 for the BDCARTO.
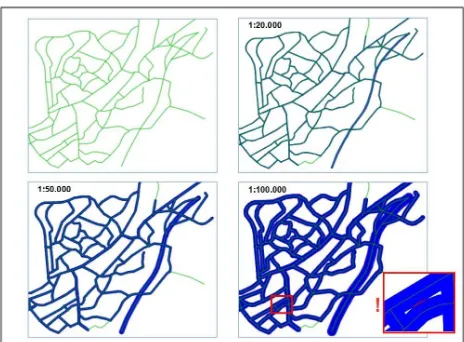
Figure 2. An iterative method to estimate the characteristic representation scale of a cartographic database road network
2.2 Capture scale
The notion of scale-range is not limited to representation scale. It can also be applied to the capture scale of the database, i.e. the scale at which the data source is displayed to allow the capture of the objects. Indeed, geographical databases are produced with ther own level of detail. It supposes the mobilization of production processes and data sources allowing the representation of real world entities at a given scale, in order to be reliable in the specifed representation scale-range. But we know that heterogeneous processes can be used to capture the geometry of geographical objects. In this context, we can consider that the capture scale of a database is not fixed. For instance, an operator of photogrammetric restitution regularely changes the vizualisation scale (i.e. zoom in/out) in order to capture specific details of the geometry of the objects. This example shows that we can not only consider a single and unique capture scale of a database, but a capture scale-range. But in order to avoid misuses, we assume that the minimum capture scale should correspond at least with the maximum representation scale, as exposed in the figure 3.
Figure 3. Capture scale-range and representation scale-range
Then, we can consider that the capture scale-range of BDTOPO objects goes from a scale of about 1:200 to a scale of about 1:5.000 and its representation scale-range goes from a scale of about 1:5.000 to a scale of about 1:50.000.
In this work, our goal is to estimate the average capture scale, as exposed by Chandelier (2011). The average capture scale, or characteristic capture scale, can be defined as the scale at which the data source is displayed, to allow the capture of objects with the appropriate level of detail desired for their representation. It means that the characteristic capture scale is necessarly larger than the expected representation scale-range.
Thus, we will present in the following section a method, based on the exploration of the level of detail of a geographical database, in order to estimate its characteristic capture scale.
3. EXPLORING INTER-VERTICES DISTANCES TO
ESTIMATE CAPTURE SCALE 3.1 Level of detail and granularity
The level of detail of geographical objects can be characterized using the granularity of the objects. The granularity defines the size of the smallest geometrical forms in a database, as proposed by Ruas (2002). The granularity can be easely computed in a geographical database, by measuring the minimal distance between two successive vertices of the geometry. We can then obviously imagine that a relation exists between the capture scale and the level of detail of the objects. Indeed, the smaller the capture scale is, the longer the distance between two successive vertices should be. Thus, we consider that the analysis of inter-vertices distances can allow us to determinate the characteristic capture scale of a geographical database, in order to extract knowledge to parameterize the digitizing error simulation model. Such an approach has already been proposed by Dutton (1999a; 1999b) in his work on a global referencing scheme - called the Quaternary Triangular Mesh (QTM) - to show how segment length can be used to estimate the scale of datasets with unkown scales.
3.2 Exploring inter-vertices distances
As we know the distances between successive vertices of objects' geometry are not constant (according to their structure or the details of their shapes), we won't focus only on the minimum distance between vertices (i.e. the granularity) but on the distribution of all distances between successive vertices.
Figure 4. Distribution of inter-vertices distances extracted from the BDTOPO road network of Pyrénées-Atlantiques
Figure 4 shows the distribution of inter-vertices distances on the entire road network of the BDTOPO database in the department of Pyrénées-Atlantiques (France). This distribution, as we could expect, presents an asymmetrical shape. We can see that the majority of inter-vertices distances are under a value of 20 m., but some of them can reach hundreds of meters. The average and median inter-vertices distances are respectively 15.6 m. and 11.25 m.
3.3 Relation between capture scale and level of detail To study the relation between median inter-vertices distance and characteristic capture scale, three object classes (road network, hydrographic network, and administrative units) extracted from the BDTOPO and the BDCARTO databases in the department of Pyrénées-Atlantiques have been used. If different data sources and technics are used to digitize the objects of the two databases (photogrammetric restitution of aerial photography for BDTOPO and digitizing of 1:50k maps for BDCARTO), objects are in both cases captured manually by an operator, which allows comparisons. Table 1 shows the median inter-vertices distances computed.
Median inter-vertices distances Road
network
Hydrographic network
Administrative units
BDTOPO 11.26 m. 9.4 m. 12.03 m.
BDCARTO 55.32 m. 52.4 m. 65 m.
Table 1. Median inter-vertices distances of three objects classes extracted from BDTOPO and BDCARTO databases Results presented in Table 1 show a close relation between median inter-vertices distances and the characteristic representation scales of the databases. Indeed, all object classes merged, the median inter-vertices distances are of about 10.9 m. for the BDTOPO and 57.7 m. for the BDCARTO. But these results also show an important variability according to the object class studied. Indeed, we can easely observe that the level of detail of administrative units is smaller than the two other object classes experimented.
If we consider that the characteristic representation scale is about 1:10.000 for the BDTOPO (IGN, 2011a), and 1:50.000 for the BDCARTO (IGN, 2011b), we can approximatively see a relation of 1 to 1.000 between median inter-vertices distances and characteristic representation scales. But in the framework of the development of a digitizing error simulation model, the estimation of the characteristic capture scale is needed.
As evocated before, the minimum capture scale should correspond with the maximum representation scale, in order to avoid misuses. Assuming a linear relation between median inter-vertices distance and characteristic capture scale, we can propose a general formula to estimate the characteristic capture scale Ec using Equation 3:
Ec = Dm * a (3)
where Ec is the estimated characteristic scale Dm is the median inter-vertices distance a is a multiplying factor
Using Equation 3 and a value of the multiplying factor a equal to 500 on the three object classes experimented previously, the characteristic capture scale estimated is about 1:5.450 for BDTOPO and 1:28.850 for BDCARTO, which can be considered as realistic. Even if this relation between median inter-vertices distance and characteristic capture scale remains approximative, it already provides and interesting information for the database user, and finally assists him to parameterize automatically the digitizing error simulation model. Thus, to validate the proposed method and calibrate the model, an experiment is provided in the following section.
4. EXPERIMENTS AND DISCUSSIONS
4.1 Presentation of the experiment
The experiment proposed in this section deals with the manual capture of a road by a sample of subjects at two different fixed scales. Initial goals of this experiment are multiple (study of measurements imprecision, digitizing error, estimation of capture scale...), but we will only focus in this paper on the calibration of the model proposed to estimate the characteristic capture scale of a database.
The experiment was realized on a mountainous road (the D112) extracted from the BDTOPO database in the area of Grenoble (France). The subjects had to capture this road at two different fixed scales – the scale 1:10.000 and the scale 1:25.000 – without any possibility of zooming in or out. Each capture had to be performed in one time, using the QGIS software (QGIS Development Team, 2009). As exposed in Figure 5, a section of the road is homologous in the two scales experimented, which allows comparisons in order to assess the impact of scale capture reduction on the level of detail.
Figure 5. A same road represented at two different scales in the digitizing test experiment
The sample was composed of 20 subjects, all members of the COGIT laboratory at this period. This sample is globally composed of subjects who have a good knowledge of geographical data, but majoritarely who capture geographical data occasionnaly (for 75% of them).
4.2 Results and discussions
The study of inter-vertices distances in this experiment gave the opportunity to validate the proposed method, and to quantify the effect of capture scale reduction on the level of detail of geographical objects, in order to calibrate the model. The two following figures present the distributions of inter-vertices distances on the homologous road sections, captured at the scales 1:10.000 and 1:25.000.
Figure 7. Inter-vertices distances of the road captured at the scale 1:25.000.
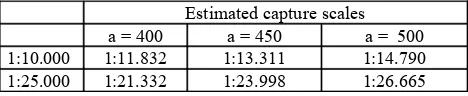
To assess the impact of capture scale reduction on the level of detail of the road, the granularity is firstly used. For the road captured at the scale 1:10.000, the smallest distance observed is 5.29 m. by comparison with 6.61 m. at the scale 1:25.000. These results already show that the reduction of the capture scale directly affects its granularity. Median inter-vertices distances are respectively of 29.58 m. at the scale 1:10.000 and 53.33 m. at the scale 1:25.000. Then, as proposed in Equation 3, the estimated scales are computed using different values of the multiplying factors a, as exposed in Table 2.
Estimated capture scales
a = 400 a = 450 a = 500
1:10.000 1:11.832 1:13.311 1:14.790
1:25.000 1:21.332 1:23.998 1:26.665
Table 2. Estimated capture scales using three different values of the multiplying factor a
Results show that the multiplying factor that minimizes globally the estimated scale capture error is about a = 450, with an underestimation of the capture scale 1:10.000, and an overestimation of the capture scale 1:25.000.
These results also underline that the relation between characteristic capture scale and median inter-vertices distance should not be linear. But further experiments are required in order to define the appropriate function to model the relation between level of detail and capture scale.
Finally, even if this estimation remains an approximation, it already provides a precious information for the final user, in order to parameterize the digitizing error simulation model, and more generally to extract knowledge from the data. Thus, this method was integrated in the model developed by Girres (2012), using the multiplying factor a = 500. This value proved to be appropriate for geographical databases represented at medium scales, which are the major concerns of the model.
5. CONCLUSION AND FURTHER WORK
This article proposed a method to estimate the characteristic capture scale of a geographical database, in order to parameterize automatically a digitizing error simulation model used to assess the imprecision of measurements computed from the geometry of vector objects. This contribution follows a precedent work (Girres, 2011a) in the field of automatic characterization of geographical databases, where a method to estimate the characteristic representation scale of cartographic databases was proposed.
The objective of the method exposed in this article is to elaborate a relation between the level of detail of the database (using the median inter-vertices distance) and its characteristic capture scale, in order to extract automatically knowledge on the geographical database, without external data. An experiment, based on a digitizing test, was realized to validate the proposed method and calibrate the model.
If the results of the experiment show a clear relation between median inter-vertices distance and characteristic capture scale, following researches need to be realized in order to model this relation with a higher degree of efficiency. Morevover, further experiments should take into account the type of real world entities captured in the database, and their impact on the level of detail of the objects. Finally, this type of exploratory methods for the automatic characterization of geographical data can also be derived to other production contexts, as for instance in a VGI context, in order to facilitate the integration of weakly informed vector objects captured by contributors in a collaborative geographical database.
6. ACKNOWLEDGEMENTS
I acknowledge IGN-COGIT and Université Paris-Est for the support of my PhD research, which allowed the realization of this work.
REFERENCES
Bolstad, P.V., Gessler, P., Lillesand, T.M., 1990. Positional uncertainty in manually digitized map data. International Journal of Geographical Information Systems, 4(4):399-412.
Chandelier, L., 2011. La prise de vues photogrammétriques. École Nationale des Sciences Géographiques - Département Imagerie Aérienne et Spatiale.
Chrisman, N.R. and Yandell, B.S., 1988. Effects of point error on area calculations: a statistical model. Surveying and Mapping, 48:241-246.
Chrisman, N.R. and Girres, JF., 2013. First, do no harm: eliminating systematic errors in analytical results of GIS applications. In Proceedings of 8th International Symposium on Spatial Data Quality (ISSDQ'13), Hong-Kong, China.
De Bruin, S., 2008. Modelling positional uncertainty of line features by accounting for stochastic deviations from straight line segments. Transactions in GIS, 12(2):165-177.
De Bruin, S., Heuvelink, G.B.M., Brown, J.D., 2008. Propagation of positional measurement errors to agricultural field boundaries and associated costs. Computers and Electronics in Agriculture, 63(2):245-256.
Devillers, R., Stein, A., Bédard, Y., Chrisman, N.R., Fisher, P., Shi, W., 2010. Thirty years of research on spatial data quality: achievements, failures, and opportunities. Transactions in GIS, 14(4):387-400.
Dutton, G., 1999b. Scale, sinuosity and point selection in digital line generalization. Cartography and Geographic Information Science, 26(1), 33-53.
Girres, JF., 2011a. An evaluation of the impact of cartographic generalisation on length measurement computed from linear vector databases. In Proceedings of the 25th
International Cartographic Conference (ICC'11), Paris, France.
Girres, JF., 2011b. A model to estimate length measurements uncertainty in vector databases. In Proceedings of the 7th International Symposium on Spatial Data Quality, pages 83-88, Coimbra, Portugal.
Girres, JF., 2012, Modèle d'estimation de l'imprécision des mesures géométriques de données géographiques – application aux mesures de longueur et de surface, PhD Thesis, Université Paris-Est.
Goodchild, M., Shortridge, A., Fohl., P, 1999. Encapsulating simulation models with geospatial data sets. In Lowell, K. and Jaton, A., ed.: Spatial Accuracy Assessment: Land Information Uncertainty in Natural Resources, pages 123-129. Ann Arbor Press.
Goodchild, M.F., 2004. A general framework for error analysis in measurement-based GIS. Journal of Geographical Systems, 6(4):323-324.
Griffith, D.A., 1989. Distance calculations and errors in geographic databases. In Goodchild, M. F. and Gopal, S., ed.: The Accuracy Of Spatial Databases, pages 81-90. Taylor & Francis.
Hunter, G.J. and Goodchild, M.F., 1996. A new model for handling vector data uncertainty in geographic information systems. URISA Journal, 8(1):51-57.
IGN, 2011a. BDTOPO version 2.1 - Descriptif de contenu. Technical notice, Institut Géographique National, France.
IGN, 2011b. BDCARTO version 3.1 - descriptif de contenu. Technical notice, Institut Géographique National, France.
IGN-SHOM, 1992. Trait de côte histolitt verison 2.0. Technical notice, Institut Géographique National - Service Hydrographique et Océanographique de la Marine, France.
ISO 19157, 2013. Geographic Information – Data Quality, Technical notice, International Organization for Standardization (ISO).
Keefer, B., Smith, J., Gregoire, T., 1988. Simulating manual digitizing error with statistical models. In Proceedings of GIS/LIS'88 Conference, pages 475-483.
QGIS Development Team, 2009. QGIS Geographic Information System. Open Source Geospatial Foundation. URL: http://qgis.osgeo.org
Ruas, A., 2002. Echelle et niveau de détail. In Ruas, A., ed.: Généralisation et représentation multiple, chapitre Echelle et niveau de détail, pages 26-44. Hermes, Lavoisier, Paris.