MEASURING LAND USES ACCESSIBILITY BY USING FUZZY MAJORITY
GIS-BASED MULTICRITERIA DECISION ANALYSIS
CASE STUDY: MALAYER CITY
A. Taravat a, *, A. Yari b, M. Rajaei c, R. Mousavian d
a Remote Sensing & Environmental Modelling Lab, Kiel University, Germany - [email protected] b Dept. of Geography, University of Mohaghegh Ardabili, Iran - [email protected]
c Geo-information Science and RS Lab, Wageningen University, The Netherlands - [email protected] d Faculty Of Engineering, Putra University, Malaysia - [email protected]
KEY WORDS: Accessibility, Land Use, Fuzzy, GIS, Multicriteria Decision Making
ABSTRACT:
Public spaces accessibility has become one of the important factors in urban planning. Therefore, considerable attention has been given to measure accessibility to public spaces on the UK, US and Canada, but there are few studies outside the anglophone world especially in developing countries such as Iran. In this study an attempt has been made to measure objective accessibility to public spaces (parks, school, library and administrative) using fuzzy majority GIS-based multicriteria decision analysis. This method is for defining the priority for distribution of urban facilities and utilities as the first step towards elimination of social justice. In order to test and demonstrate the presented model, the comprehensive plan of Malayer city has been considered for ranking in three objectives and properties in view of index per capital (Green space, sport facilities and major cultural centers like library and access index). The results can be used to inform the local planning process and the GIS approach can be expanded into other local authority domains. The results shows that the distribution of facilities in Malayer city has followed on the base of cost benefit law and the human aspect of resource allocation programming of facilities (from centre to suburbs of the city).
* Corresponding author.
1. INTRODUCTION
This study analyses the accessibility to urban facilities in Malayer (a city in the north-west part of Iran). Planning is carried out within the brand framework of government policy making and has its general objectives set out in legislation urban planning and are concerned with the management of urban change (Ambrosini and Routhier, 2004; Cullingworth and Nadin, 2002; Raco and Imrie, 2000). Also the desire to improve the quality of life (QOL) in a particular place is an important focus of attention for planers (Massam, 2002; Santos and Martins, 2007). The enterprise of planning as a public activity is strongly motivated and justified in terms of its potential contributions to citizen QOL (Lotfi and Koohsari, 2009b; Massam, 2002).
The location of most public spaces from a policy and planning perspective is determined by the spatial distribution of public services and facilities. Moreover, this is the area where social can be mitigated or at least offset by compensatory distribution (Talen and Anselin, 1998; Witten et al., 2003). On the other hand, equity and efficiency considerations and local body conventions are also considered for determination of public space locations. Urban public spaces influence the quality of life and the welfare people both directly and indirectly implicit in the public provision of amenities such as parks, recreational facilities and social and cultural services in a belief that they are beneficial to wellbeing of residents (Guagliardo, 2004; Witten et al., 2003).
Accessibility is in turn an important factor which impacts all aspects of public space in both direct and indirect ways (Guagliardo, 2004). Public facilities can be linked to
accessibility and thus residential proximity to facilities can be used as contributing to health and wellbeing in a number of ways. In addition to easier and more direct access to public places, it confers opportunities by reducing the time and financial costs of access which in turn frees individual and house hold resources for use elsewhere (Lotfi and Koohsari, 2009b; Pearce et al., 2006).
2. LITERATURE REVIEW
There are many studies of public space, from neighbourhood units (Pearce et al., 2007; Pearce et al., 2008a; Santos and Martins, 2007; Witten et al., 2008; Witten et al., 2011) to the national level (Apparicio et al., 2007; Pearce et al., 2008b; Witten et al., 2011) which include a broad range of public spaces including access to green space (Coombes et al., 2010; Hillsdon et al., 2006; Lee and Maheswaran, 2011), access to health services (McGrail and Humphreys, 2009; Yang et al., 2006), and access to open spaces (Sugiyama et al., 2010; Witten et al., 2008).
The four measures most commonly used in accessibility studies are gravity potential, average distance between each origin and all facilities, and minimum distance (the distance from an origin to the nearest facility). Four types of distance can be used to calculate these four measures of accessibility: Euclidian distance (straight line), Manhattan distance (distance along two sides of a right-angled triangle, the base of which is the Euclidian distance), shortest network distance and shortest network time (Ambrosini and Routhier, 2004).
In 2004 Liu and Zhu have developed an integrated GIS approaches to accessibility analysis, which provides a general framework for using GIS and travel impedance. S. Nicholls (2001) measured accessibility to parks by using ‘radius’ and ‘network analysis’ methods. Yang et al., (2006) used kernel density method to measure spatial accessibility to health services. Short network distance method has been used by Apparicio, P., et al. (2007) in order to measure the accessibility of facilities for public housing in Montreal. Comber et al., measure the accessibility is based on GIS-Based multicriteria decision analysis model called as fuzzy majority approach which considers being very competitive model in terms of accuracy and speed for classification problems.
3. BACKGROUND 3.1 Measuring accessibility
Accessibility is a frequently used concept but there is no consensus about its definition. It is common term experienced by diverse individuals (i.e. characterized by different needs, abilities and opportunities) at any place and moment of the day which results in considerable variation in components included in its measurement and in how it is formulated (Lotfi and Koohsari, 2009b).
Accessibility has been defined according to purpose of the research, but it has commonly been defined as some measure of spatial separation of human activities (Talen and Anselin, 1998) or as the case a certain system of transport (Gregory et al., 2009; Kearns and Moon, 2002; Lotfi and Koohsari, 2009a). neighborhood unit), Coverage (e.g. the number of kindergartens in 800m from residential), Minimum Distance (e.g. the distance from neighborhood units centre to the nearest park), and Service Area (e.g. all areas within 800m from kindergartens) (Lotfi and Koohsari, 2009b). Another methodological issue is calculation of per-capita. Wiliest measuring per-capita for land uses has received considerable attention on the US, UK and Canada and it has been calculated from the division ratio of area and population (Esmneel, 1995).
The use of public facilities can be linked to accessibility, and thus residential proximity to facilities and services can be theorized as contributing to health and wellbeing in a number of
ways. In addition, it confers opportunities by reducing the time and financial costs of access (Pearce et al., 2006).
In all of studies in the field of public spaces, the authors have addressed different methods for analysing the accessibility to public spaces (Fortney et al., 2000; Yang et al., 2006) or presenting a new method for measuring accessibility with respect to the previous methods (Apparicio et al., 2007; Pearce et al., 2008b; Witten et al., 2003). Almost all of the presented models in the related literature are based on the traditional Boolean logic, which is crisp, deterministic, and precise in nature and gives no room for human decision making processes. Sharp boundaries are imposed to create categories in the thematic attribute and a spatial entity can either belong to or not belong to a set. However, the traditional cartographic modeling technique has proved to be quite awkward in some GIS applications where imprecision and vagueness prevails, because not all the entities in the spatial database can be uniquely defined, either in the set of attributes or in their spatial delineation (Leung, 1989).
As an alternative to Boolean logic, Zadeh's fuzzy set theory has been proposed as the new logical foundation for GIS design (Robinson, 1988). The potential applications of fuzzy logic in spatial data collection, representation, retrieval and display have been discussed in literature (Boroushaki and Malczewski, 2010). A fuzzy information representation scheme and its implementation in conventional GIS software were developed at the University of Guelph (Roman, 1990) reported a formal fuzzy logic-based specification framework for geographic information, in which rules of reasoning about time, space and accuracy have been stated in a subset of second-order calculus (Boroushaki and Malczewski, 2010).
3.2 GIS-Based MultiCriteria Decision Analysis (GIS– MCDA)
GIS–MCDA is defined as a process that transforms and combines geographical data to obtain appropriate information for decision making. GIS–MCDA is in the context of the capabilities of GIS and MCDA which can observe the benefits for advancing theoretical and applied research on the integration of MCDA and GIS (Boroushaki and Malczewski, 2010; Feick and Hall, 1999; Kwaku Kyem, 2004).
voting schemes in relation to the combination process (Boroushaki and Malczewski, 2010; Pasi and Yager, 2006).
Under the mentioned circumstances, GIS–MCDA involves problem definition and structuring; selection of the evaluation criteria; criterion weighting (the procedure for entering the preferences on the importance of the criteria by each individual decision-maker); determination of individual preferences; combination of the individual judgments into a single collective preference; sensitivity analysis with respect to the set of evaluation criteria and alternatives; and final ordering of alternatives so that a compromise alternative can be selected. For more information please see (Boroushaki and Malczewski, 2010; Jankowski et al., 1997; Limayem and DeSanctis, 2000; Malczewski, 2006b).
4. METHODOLOGY
The outline research method used to develop the mapping model including the field work, design and data analyses. The primary steps towards any research work are the data used and the methods employed. The research’s questions will determine whether the secondary data sources can suffice or primary data collection for the parameters used in the study is required. The methodology of this case study contains 3 phases which are: data collection, data preparation, and data analysis.
4.1 Data Collection
The whole Malayer City is divided into 52 blocks. Out of these 52 blocks, 25 blocks contain the residential part of the city. In this research 7 layers (which have been georeferenced into the UTM projection with the WGS84 as datum) have been used. These layers are containing information about location of Kindergarten, Primary School, Secondary School, High School, Hygienic, Administration and Sport Facilities. The locations of these facility layers in the data have been represented by polygon geometry. GPS technique has been used for collecting the accurate attributes and after that by using ArcGIS 9.2 the updated attributes have been attached to the concerned layers.
4.2 Data Preparation
Data preparation phase contains four steps: 1. Creating the road network for network analysis
a. Road Network
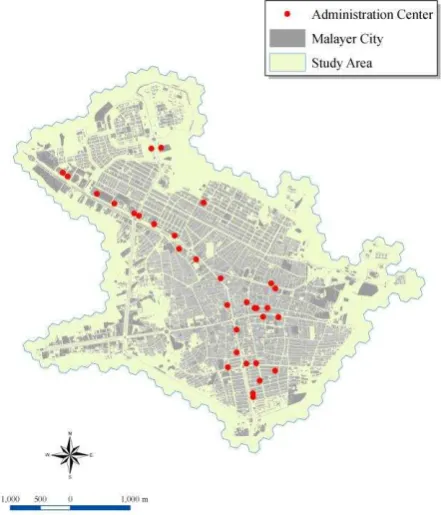
b. Creating the hexagonal point layer as incidents c. Creating Point Feature Class as facilities (e.g. Fig. 1) 2. Extracting the closest distance from the center of hexagon
to each attribute layer (e.g. Fig. 2) a. Modeling & Automation (Fig. 3) 3. Merging the tables by SPSS
4. Merging the attributes & create the final hexagonal layer a. Software Customization for automation of the process.
Fig. 1. The centers of administration on the hexagonal layer of Malayer city (updated 2009)
In this research, in order to automatize the extracting process of .dbf of the closest distances, a model has been created. In the model, “Make Closest Facility” tools has been used for calculating the closest facility distance for each hexagon centre, then by “Select Data” tools, route layer from network analyst has been chosen. In the last step by “Table Select” tools .dbf file has been extracted. After extracting the .dbf file for each layer, they should be merged in order to have a final .dbf for the next step. The final result after merging is a layer which contains the closest distance from each hexagon’s centre to facilities and it will be the layers that are used in the analysing phase.
The analysis phase is concerned with developing a framework for GIS-based multicriteria group decision-making using the fuzzy majority approach (For more information about the model please see (Boroushaki and Malczewski, 2010; Taravat, 2013)). The procedure for solving a spatial group decision-making problem involves two stages. First, each decision-maker solves the problem individually. Second, the individual solutions are aggregated to obtain a group solution.
Fig. 3. The model for extracting the distance to closest facility for each hexagon
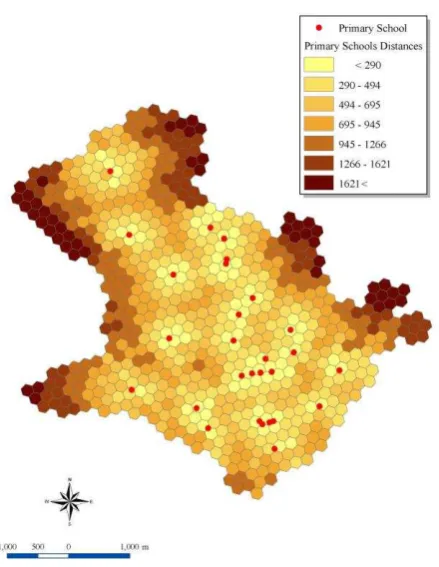
Fig. 2. The map of distances from primary schools to the hexagon’s centers
5. RESULTS
The final layer is a hexagonal map of Malayer city that contains the distances of all facilities from the centre of that hexagonal to the closest facility. Therefore, the shortest path from each facility to hexagon’s centers was calculated (Table 1). Figure 2 shows the shortest path from primary schools to hexagon’s centers.
Table 1: shortest and longest paths from each facility to hexagon’s centres
Facility Shortest (m) Longest (m) Kindergartens <536 >2851 Primary School <290 >1621 Secondary School <356 >2035
High School <306 >1982
Hygienic <358 >1997
Sport <405 >2483
Administration < 407 > 2732
6. DISCUSSION AND CONCLUSION
In this paper an attempt has been made to present a methodology to calculate the land evaluation base on distance for reaching activity places. A series of “subjective” measures of accessibility based on distances made by road network was built for Malayer City. Furthermore, the distribution of distances was summarized using fuzzy logic in order to qualify each type of layers and for each Hexagon, the suitability of every service point located in the GIS and to build perceptual accessibility indices.
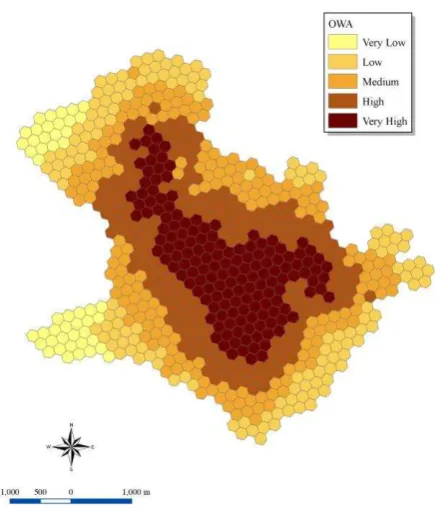
The study presented the fuzzy majority approach using OWA procedure for GIS-based multi-criteria decision-making and its implementation in the ArcGIS environment. Fuzzy logic facilitates the challenges of converting human language into the mathematical formulation, which in turn paves the way for fuzzy weighting methods, quantifier-guided OWA and fuzzy majority procedures. Without doubt there are disadvantages in using Boolean logic, especially it is not possible to be precise regarding the role played by specific land properties and there are errors in the data as a result of spatial variability. In this study it has been tried to demonstrate the advantage of fuzzy method in multicriteria decision making.
The results can be used to inform the local planning process and the GIS approach can be expanded into other local authority domains. The results shows that the distribution of facilities in Malayer city has followed on the base of cost benefit law and the human aspect of resource allocation programming of facilities (from centre to suburbs of the city).
Fig 4. The map of relative accessibility base on administration, sport and hygienic facilities distances
REFERENCES
Ambrosini, C., Routhier, J.L., 2004. Objectives, methods and results of surveys carried out in the field of urban freight transport: an international comparison. Transport Reviews 24, 57-77.
Apparicio, P., Cloutier, M.-S., Shearmur, R., 2007. The case of Montreal's missing food deserts: evaluation of accessibility to food supermarkets. International journal of health geographics 6, 4.
Boroushaki, S., Malczewski, J., 2010. Using the fuzzy majority approach for GIS-based multicriteria group decision-making. Computers & Geosciences 36, 302-312.
Coombes, E., Jones, A.P., Hillsdon, M., 2010. The relationship of physical activity and overweight to objectively measured green space accessibility and use. Social science & medicine 70, 816-822.
Cullingworth, J.B., Nadin, V., 2002. Town and Country Planning in the UK. Psychology Press.
Esmneel, S., 1995. An Introduction on Urban Planning in Iran. Science and industry Publication 172.
Feick, R.D., Hall, G.B., 1999. Consensus-building in a multi-participant spatial decision support system. URISA journal 11, 17-23.
Fortney, J., Rost, K., Warren, J., 2000. Comparing alternative methods of measuring geographic access to health services. Health Services and Outcomes Research Methodology 1, 173-184.
Gregory, D., Johnston, R., Pratt, G., Watts, M., Whatmore, S., 2009. The dictionary of human geography. John Wiley & Sons.
Guagliardo, M.F., 2004. Spatial accessibility of primary care: concepts, methods and challenges. International journal of health geographics 3, 3.
Hillsdon, M., Panter, J., Foster, C., Jones, A., 2006. The relationship between access and quality of urban green space with population physical activity. Public health 120, 1127-1132.
Jankowski, P., Nyerges, T.L., Smith, A., Moore, T., Horvath, E., 1997. Spatial group choice: a SDSS tool for collaborative spatial decisionmaking. International Journal of Geographical Information Science 11, 577-602.
Kearns, R., Moon, G., 2002. From medical to health geography: novelty, place and theory after a decade of change. Progress in Human Geography 26, 605-625.
Kwaku Kyem, P.A., 2004. Of intractable conflicts and participatory GIS applications: The search for consensus amidst competing claims and institutional demands. Annals of the Association of American Geographers 94, 37-57.
Lee, A., Maheswaran, R., 2011. The health benefits of urban green spaces: a review of the evidence. Journal of Public Health 33, 212-222.
IGARSS'89. 12th Canadian Symposium on Remote Sensing. 1989 International. IEEE, pp. 47-50.
Limayem, M., DeSanctis, G., 2000. Providing decisional guidance for multicriteria decision making in groups. Information Systems Research 11, 386-401.
Lotfi, S., Koohsari, M., 2009a. Analyzing accessibility dimension of urban quality of life: Where urban designers face duality between subjective and objective reading of place. Social indicators research 94, 417-435.
Lotfi, S., Koohsari, M.J., 2009b. Measuring objective accessibility to neighborhood facilities in the city (A case study: Zone 6 in Tehran, Iran). Cities 26, 133-140.
Malczewski, J., 2006a. GIS‐based multicriteria decision analysis: a survey of the literature. International Journal of Geographical Information Science 20, 703-726.
Malczewski, J., 2006b. Ordered weighted averaging with fuzzy quantifiers: GIS-based multicriteria evaluation for land-use suitability analysis. International Journal of Applied Earth Observation and Geoinformation 8, 270-277.
Massam, B.H., 2002. Quality of life: public planning and private living. Progress in Planning 58, 141-227.
McGrail, M.R., Humphreys, J.S., 2009. Measuring spatial accessibility to primary care in rural areas: improving the effectiveness of the two-step floating catchment area method. Applied Geography 29, 533-541.
Nicholls, S., 2001. Measuring the accessibility and equity of public parks: a case study using GIS. Managing Leisure 6, 201-219.
O'Sullivan, D., Morrison, A., Shearer, J., 2000. Using desktop GIS for the investigation of accessibility by public transport: an isochrone approach. International Journal of Geographical Information Science 14, 85-104.
Pasi, G., Yager, R.R., 2006. Modeling the concept of majority opinion in group decision making. Information Sciences 176, 390-414.
Pearce, J., Blakely, T., Witten, K., Bartie, P., 2007. Neighborhood deprivation and access to fast-food retailing: a national study. American journal of preventive medicine 32, 375-382.
Pearce, J., Day, P., Witten, K., 2008a. Neighbourhood provision of food and alcohol retailing and social deprivation in urban New Zealand. Urban Policy and Research 26, 213-227.
Pearce, J., Witten, K., Bartie, P., 2006. Neighbourhoods and health: a GIS approach to measuring community resource accessibility. Journal of epidemiology and community health 60, 389-395.
Pearce, J., Witten, K., Hiscock, R., Blakely, T., 2008b. Regional and urban-rural variations in the association of neighbourhood deprivation with community resource access: a national study. Environment and planning. A 40, 2469.
Raco, M., Imrie, R., 2000. Governmentality and rights and responsibilities in urban policy. Environment and Planning A 32, 2187-2204.
Robinson, V.B., 1988. Some implications of fuzzy set theory applied to geographic databases. Computers, Environment and Urban Systems 12, 89-97.
Roman, G., 1990. Formal specification of geographic data processing requirements. Knowledge and Data Engineering, IEEE Transactions on 2, 370-380.
Santos, L.D., Martins, I., 2007. Monitoring urban quality of life: The Porto experience. Social Indicators Research 80, 411-425.
Sugiyama, T., Francis, J., Middleton, N.J., Owen, N., Giles-Corti, B., 2010. Associations between recreational walking and attractiveness, size, and proximity of neighborhood open spaces. American Journal of Public Health 100.
Talen, E., Anselin, L., 1998. Assessing spatial equity: an evaluation of measures of accessibility to public playgrounds. Environment and Planning a 30, 595-613.
Taravat, A., 2013. GIS-based multicriteria decision analysis for land evaluation:case study. LAP LAMBERT Academic.
Witten, K., Exeter, D., Field, A., 2003. The quality of urban environments: Mapping variation in access to community resources. Urban Studies 40, 161-177.
Witten, K., Hiscock, R., Pearce, J., Blakely, T., 2008. Neighbourhood access to open spaces and the physical activity of residents: a national study. Preventive medicine 47, 299-303.
Witten, K., Pearce, J., Day, P., 2011. Neighbourhood Destination Accessibility Index: a GIS tool for measuring infrastructure support for neighbourhood physical activity. Environment and Planning-Part A 43, 205.