GIS ASSESSMENT OF THE PM
10, PM
2.5AND PM
1.0CONCENTRATIONS IN URBAN
AREA OF TEHRAN IN WARM AND COLD SEASONS
F. Halek a, *, A. Kavousi-rahima
a Materials and Energy Research Center (merc), P. O. Box 14155-4777, Tehran, Iran – [email protected]
KEY WORDS: GIS, Air pollution, Particulate matter, Seasonal pollution, Tehran air pollution
ABSTRACT:
In recent years, atmospheric models, such as GIS, are used for environmental analysis and the related management for supporting the environmental decision makers in different countries. In this study, concentrations of PM10, PM2.5 and PM1.0 are found in urban areas of Tehran in warm and cold seasons and the data applied in the related modelling, using Arc-GIS. For this purpose, samples were collected from 42 sites in an 18 km2 region located in the west and central parts of Tehran. The mean concentrations of PM1.0, PM2.5 and PM10 are found to be 13.14 g/m3, 22.67 g/m3 and 95.72 g/m3 in the warm season; and 50.12 µg/m3, 70.72 µg/m3 and 193.86 µg/m3 in the cold season respectively. In this paper, with the aid of GIS, concentrations of the suspended particles were measured in 22 major hospitals, the patients in which are in contact with these pollutants. It was found the concentrations of the suspended particles were much higher in the cold season.
* Corresponding author.
1. INTRODUCTION
Pollution can be defined as an undesirable change in the physical, chemical or biological characteristics of the air, water or land that can affect health, survival or activities of humans or other organisms (Smith, 1996; WHO, 1997; Patel and Raiyani, 1995; Anu et al., 2002; anthony et al., 2007; Minsi et al., 2007; Marilena & Elias, 2008). Among the major air pollutants released to the atmosphere, suspended particulate air pollution are considered as one of the major health impact and therefore a large number of related studies have been undertaken in developing countries in the last decade (Cautreels & Van, 1978; Zhu et al., 2002; Douglas et al., 2002; Alam et al., 2003; Gramotnev & Ristovski, 2004; Silibello et al., 2007).
The most important environmental problem Iran currently faces is air pollution, especially in the capital city of Tehran. The problem is very serious for the city which considered one of the most polluted cities in the world. Cars are chiefly to blame for
Tehran’s heavy pollution, because most of the city’s more than
2 million cars are at least 20 years old and do not have catalytic
converters to reduce pollutants. Unfortunately the city’s
geographical position is not helping the reduction of pollutants. The city is hammed by the tall Alborz Mountains to the north and therefore trap the pollutants over the city (Halek et al., 2004).
Particulate matter is considered one of the main sources of air pollution problems in Tehran. The role, size distribution of
particulate matter in the city’s air pollution and also the effect of
motor vehicles and trend of air borne particulate, have been the subject of extensive studies (Nabi and Halek, 2007).
In air pollution studies, the air quality models are used to predict and estimate concentration of one or more species in space and time as related to the dependent variables. Modelling provides the ability to assess the current and also future air creating, managing and analyzing graphic and attribute data, but also is a decision supporting system (DSS). In fact, GIS can support managers, planner and decisions maker. Therefore, these days we will face big problems in big cities if we don ُ t use such systems (Pirmoradi, 2008).
The rise of GIS technology and its use in a wide range of disciplines provides transportation and air quality modelers with a powerful tool for developing new analysis capability (Goodchild et al., 1996; Burrouigh and McDonald, 1998; Appleton and Lovett, 2003; Tolga, 2004; Duanping et al., 2006; Younes et al., 2008). The organization of data by location allows data from a variety of sources to be easily combined in a uniform framework (Wilfred and Gerald, 2005; Mauro and Lorenzo, 2006).
A Comparison and case study conducted to apply the satellite data and GIS for producing maps of amounts of CO, O3, NO2
and SO2 in Tehran’s atmosphere (Sohrabinia and
Khorshiddoust, 2007). With the help of GIS, concentrations of each of these pollutants were estimated to be much higher than standard values and forecasted that to go still higher. The results of such a study and other air pollution case studies in different countries not only could help the local, but the global environmental pollution experts and decision makers to set environmental politics.
It should be pointed out that the wind speed and direction is an important factor affecting particulate pollution concentrations and its source apportionment. The yearly mean wind speeds in Tehran is reported to be between 4 and 5 m/s for eleven years (1995-2005) and the highest wind speeds were seen in March, April and May. The most probable wind direction in Tehran is on the west (Keyhani et al., 2010).
used data extracted from 42 stations located in different parts of the region. Special attention is made to estimate the concentrations of particulate matter near 22 hospitals in this region, some of which are located in the so-called “Tehran’s
Traffic Zone”. With the help of this modeling, one could
estimate the concentrations of PM10, PM2.5 and PM1.0 in such important areas in this region where setting a sampling station is impossible.
2. EXPERIMENTAL
2.1 Study area and sampling in Tehran
A region of 18.2 km2 was selected as our study area, because
many important general hospitals, including “Tehran heart
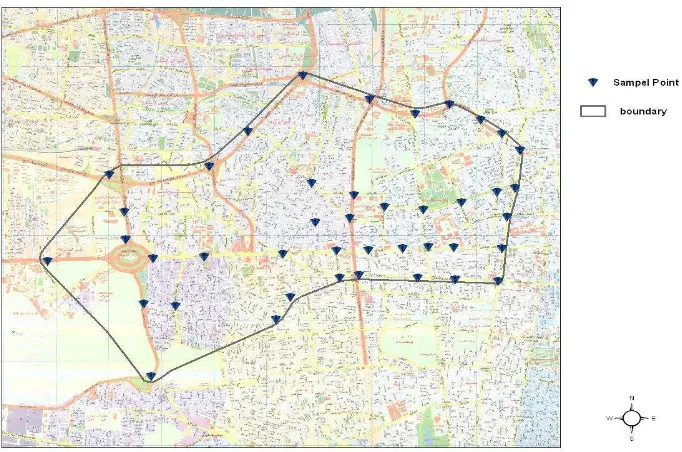
center”, “Imam Khomeini”, “Shariati”, “Arya”, “Sasan”, “Sajad”, “Pars”, “Mustafa Khomeini”, “Toos” and “Rasoul Akram” are located in this area. Also in this area, a so-called "Traffic Zone" has been set up since 2000, covering the city center during peak traffic hours. Entering and driving inside this zone is only allowed with the special permit. Figure 1 shows this region in Tehran. 42 sampling sites were set to collect the air samples according to the standard sampling procedures. The names of the sampling sites and their related geographical coordinates in Tehran are listed in Table 1.
The mean temperature in the sampling sites was measured to be between 29-35 C in the summer 2010 and 1-23 C in the following winter.
Figure 1. The borderline of the sampling points
2.2 Sampling Program
In this study, simultaneous measurements of mass concentrations of PM10, PM2.5 and PM1.0, in the sampling stations were done in the warm season (July, August and September 2010), followed by the cold season (January, February and March 2011). The samples were collected once a week, covering each day of the week to be sure that all the days of the week were included. Daily samplings were done in two consecutive seasons, starting 8.0 AM (the morning rush hour) to 4.0 PM (the afternoon rush hour). During every sampling day, samples from all of 42 sites were taken, assigning about 10 min for each sampling site. It should be pointed out that, to avoid the error arising from the fluctuation of particulate concentrations in different times of the day, daily samplings were done in different order of the sites. In other word, each daily sampling began at different site than previous sampling day and finished at different site consequently.
2.3 Instrumentation
A portable particle size analyzer-dust monitor Model Grimm-1.108 (made in Germany), was used for continuous measurement of the particles. This instrument was able to measure the size distribution of the particulate matter, including
PM10, PM2.5 and PM1.0. The instrument uses a light-scattering technology for single-particle detection, whereby a semiconductor-laser serves as the light source. A 47 m PTFE filter is used for collecting the samples. The air flow was set at 1.2 lit/min. In order to measure the real exposure to the concentration of the particulate matter by human being as close as possible, all samples were collected at the height of 1.65 meter, which is defined as the average height of Iranian population (Haghdoost et al. 2008).
Instrument calibration was done according to procedure adopted by Grimm instrumental company, and therefore a correction factor of Cf = 1.05 is incorporated into all of the calculations. A GPS (Global Positioning System) instrument (Model eTrex Vista) was used for geographical position (X and Y in table 1) determination of sampling schools.
2.4 Software and Modeling
In order to build a “Surface Model” for PM10, PM2.5 and PM1.0, different algorithms should be applied to interpolate the data from those obtained for the known sites and extend the results
to the “surface”. For this purpose mean concentrations of PM10, PM2.5 and PM1.0, in each sampling site for June, July and August, were calculated, interpolated and extended to the
using ArcGIS9.2. To examine the precision of the surface
models, the “Root Mean Square” method was applied.
After building the surface models for each month in the summer, the concentration of each particulate matter could be estimated in all the points in the district and consequently, the related distribution of the particles and their concentration could be evaluated and categorized. Also with the aid of
“Mathematics Overlay”, the models for the months could be
overlaid and the final results for the particles could be evaluated for each of the seasons.
Site No. Sampling Site Location: X Y
1 Karaj Road – Airport Entrance 52 92' 08" 39 50' 73" 2 Saeedi Highway - Dampezeshki
Intersection
53 07' 59" 39 49' 96"
3 Fath Square 53 08' 81" 39 48' 62"
4 Hashemi St.- Jeyhoon Intersection 53 29' 09" 39 49' 67" 5 Dampezeshki St.- Karoon Intersection 53 31' 49" 39 50' 08" 6 Dampezeshki St.- Moeen Intersection 53 12' 81" 39 49' 92" 7 Azadi Square 53 09' 13" 39 50' 79" 8 Azadi St.- Sharif University 53 17' 50" 39 50' 82" 9 Azadi St.- Azarbaijan Intersection 53 30' 26" 39 50' 87" 10 Azarbaijan St.- Roudaki Intersection 53 39' 49" 39 50' 43" 11 Jomhouri Square 53 42' 59" 39 50' 48" 12 Jomhouri St.- Jamalzadeh Intersection 53 52' 17" 39 50' 44" 13 Jomhouri St.- Fakhre-Razi Intersection 53 58' 18" 39 50' 40" 14 Jomhouri St.- Valii Asr Intersection 53 65' 18" 39 50' 37" 15 Valii Asr Junction 53 65' 85" 39 50' 97" 16 Enghelab St.- Tehran University 53 58' 02" 39 50' 99" 17 Enghelab Square 53 53' 83" 39 51' 00" 18 Azadi St.- Kaveh Parking 53 49' 75" 39 50' 97" 19 Azadi St.- Eskandari Intersection 53 44' 16" 39 50' 94" 20 Azadi St.- Roudaki Intersection 53 38' 99" 39 50' 93" 21 Khosh St.- Nosrat Intersection 53 35' 56" 39 51' 44" 22 Sattar Khan St.- Behbudi Intersection 53 34' 86" 39 52' 16"
23 Touhid Square 53 42' 00" 39 51' 53"
24 Chamran Highway - Bagher Khan Intersection
53 41' 76" 39 51' 95"
25 Keshavarz Blv.- Imam Hospital 53 46' 72" 39 51' 73"
26 Keshavarz Blv.- Kargar Intersection 53 53' 07" 39 51' 68"
27 Keshavarz Blv.- Hejab Intersection 53 59' 24" 39 51' 81"
28 Keshavarz Blv.- Felestin Intersection 53 65' 05" 39 52' 01"
29 Valii Asr St.- Taleghani Intersection 53 66' 58" 39 51' 55"
30 Valii Asr Square 53 67' 91" 39 52' 07"
31 Valii Asr St.- Zartosht Intersection 53 68' 79" 39 52' 77"
32 Fatemi Square 53 65' 79" 39 53' 06"
33 Golha Square 53 62' 40" 39 53' 32"
34 Gomnam Highway- Kurdistan Intersection 53 57' 31" 39 53' 60"
35 Gomnam Highway- Kargar Intersection 53 51' 69" 39 53' 44"
36 Gomnam Highway- Chamran Intersection 53 44' 36" 39 53' 70"
37 Jalal Highway- Sheik Fazlollah Intersection
53 33' 49" 39 54' 13"
38 Sheik Fazlollah Highway- Sattar Khan Bridge
53 24' 59" 39 53' 10"
40 Sheik Fazlollah Highway- Jenah Intersection
53 02' 09" 39 52' 31"
41 Jenah Highway- Fuel Pump Station 53 04' 52" 39 51' 64"
42 Azadi Square- Bus Terminal 53 04' 68" 39 51' 13"
Table 1. The names of the sampling sites and their related geographical coordinates in Tehran
3. RESULTS AND DISCUSSION
The mean concentrations of particulate matter in 42 sampling stations in summer 2010 are shown in figure 2. The higher
values belong to those crowded places like city squares and street intersections.
Figure 2. Mean concentrations of particulate matter in the warm season
As it is shown in figure 2, the concentration of PM10 is much higher than the other particles. During warm season, the percent ratios of different particulate matters are found from figure 2 to be, 73 % (PM10), 17 % (PM2.5) and 10 % (PM1.0).
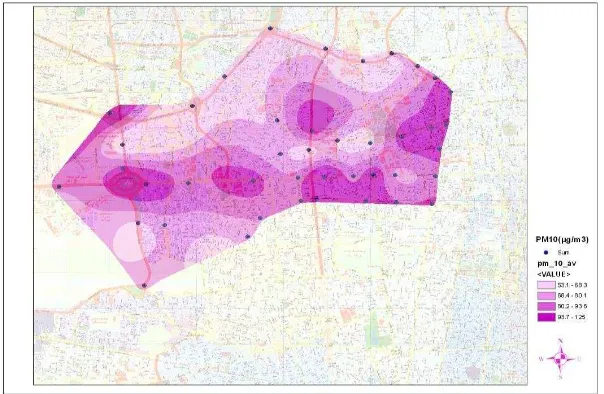
The concentrations of PM10 in the selected district, along with the locations of the stations in the warm season, are shown in the related distribution map in figure 4. The darker the regions in this figure, the higher the concentration of the particulate matter. The mean value of particulate concentration is calculated from the model to be 79.49 for the corresponding summer, with standard deviation of 13.63. It could be deduced from this figure that the highest concentration of PM10 (123.19
g/m3) belongs to the intersection of “Sheik Fazlollah” and
“Jenah” expressways, and the least value (63.76 g/m3) belongs
to the intersection of “Saeedi” and “Hashemi” expressways.
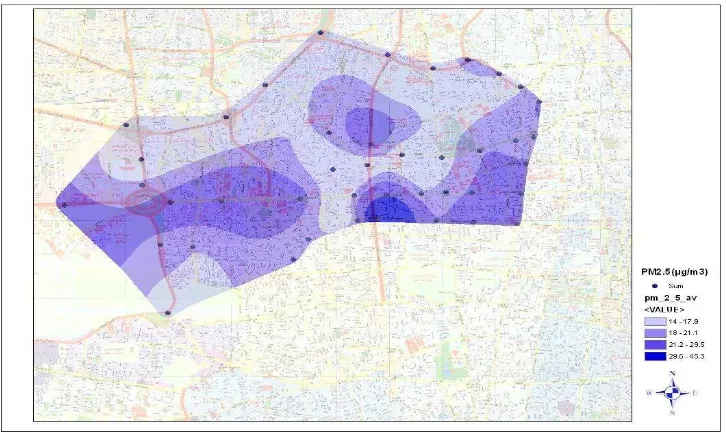
Similarly, the mean values of concentration of PM2.5 and PM1.0 are shown in figures. 5 and 6 respectively. As shown in figure 5, the mean value of concentration of PM2.5 is recorded to be 19.20 g/m3, corresponding to the highest value of 45.30 g/m3 and the lowest of 14.00 g/m3. The standard deviation of the concentration of PM2.5 is calculated to be 3.39. PM1.0 concentration, as shown in figure 6, has the highest value of 34.80 g/m3 and the least value of 6.67 g/m3. The mean value for the concentration of PM10 is calculated to be 10.80 with the standard deviation of 2.44.
Figure 3. The distribution of mean concentration of PM10 in the selected region (warm season).
Figure 4. The distribution of mean concentration of PM2.5 in the selected region (warm season).
Figure 5. The distribution of mean concentration of PM1.0 in the selected region (warm season).
Figure 6. Mean concentrations of particulate matter in the cold season
g/
m
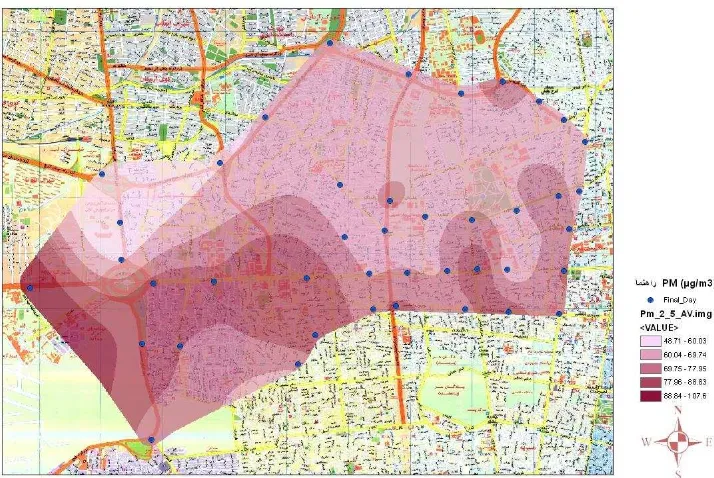
As it is shown in figure 6, the concentrations of PM10, PM2.5 and PM1.0 in the cold season (Jan, Feb and March 2011) are much higher compared to the warm season. The average value of PM10 within 42 sites found to be 194 µg/m3, while at the sites 9 (Azadi St. - Azarbaijan intersection) and 13 (Jomhouri St. - Fakhre-Razi intersection) the concentrations of PM10 were higher and estimated to be 266 µg/m3 and 256 µg/m3 respectively. Sites 40 (Sheik Fazlollah Highway - Jenah intersection) and 41 (Jenah Highway - Fuel Pump Station), have lower concentrations of PM10 during the cold season which estimated to be 134 µg/m3 and 146 µg/m3 respectively. Unfortunately the mean value of PM10 concentration in the winter season is higher than 24hr standard level of this pollutant (150 µg/m3).
The average value of PM2.5 within 42 sites in the cold season estimated to be 71 µg/m3, while its daily standard level is 65 µg/m3. However, sites 1 (Karaj Road) and 2 (Saeedi Highway -
Dampezeshki intersection) have the higher concentrations of PM2.5, which estimated to be 97 µg/m3 and 85 µg/m3 respectively.
Higher concentrations of PM1.0, belong to the sites 1 (Karaj Road) and 2 (Saeedi Highway - Dampezeshki intersection) with the values of 74 µg/m3 and 63 µg/m3 respectively. Sites 41 (Jenah Highway - Fuel Pump Station) and 40 (Sheik Fazlollah Highway - Jenah intersection), have the lower concentrations of PM1.0 during the sampling period with the values of 35 µg/m3 and 33 µg/m3 respectively.
In the cold season, the percent ratios of different sizes of particulate matter are found to be, 62 % (PM10), 22 % (PM2.5) and 16 % (PM1.0). A comparison between the data for the two seasons (figures 2 and 6) indicates that the smaller particles (PM1.0 and PM2.5) have much higher concentrations than for the warm season.
Figure 7. The distribution of mean concentration of PM10 in the selected region (cold season).
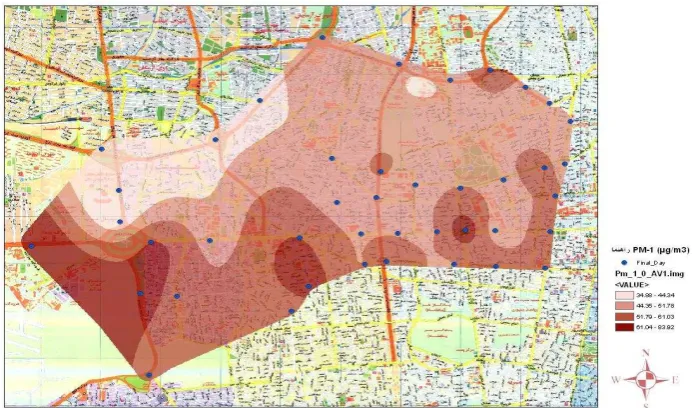
Figure 9. The distribution of mean concentration of PM1.0 in the selected region (cold season).
As it is deduced from the mean concentration of PM, Tehran, like many big cities, suffers from severe air pollution and therefore the city is often covered by smog, making breathing difficult and causing widespread pulmonary illnesses. Unfortunately most of the hospitals in Tehran are located in the selected district, instead of being placed in the non-polluted areas.
Figure 1 shows the geographical position of the selected district in Tehran. From the aid of GIS database, the concentrations of particulate matter in any selected points, especially those for hospitals located in this district could be estimated.
The names and places of the 22 hospitals in the selected district with their mean concentrations of PM10 are listed in Table 2. As
the mean concentrations of PM10 in cold season indicate, none of the hospitals meet the required international standard PM10 annual level (150 g/m3) in the cold season. The extracted estimated values from GIS modelling in the cold season revealed that the concentration of PM10 for “Meymanat”,
“Azadi” and “Sasan” hospitals are the worst, estimated from the model to be 306.2 g/m3, 264.2 g/m3 and 252.7 g/m3 respectively. It is noted from the data listed in Table 2 that the highest concentration of PM10 (119.4 g/m3) in the warm
season belongs to the “Ravan Pezeshki” hospital.
Hospital Name Location PM concentrations (µg/m3) Warm Season
PM concentrations (µg/m3) Cold Season PM10 PM2.5 PM1.0 PM10 PM2.5 PM1.0
1 Aria Vesal St. 99.6 67.2 32.1 200.3 67.1 49.7
2 Artesh (501) Fatemi St. 73.0 43.2 28.1 184.8 68.0 50.7
3 Artesh (503) Ostad Moeen St. 83.7 68.2 48.2 245.8 81.6 59.2
4 Azadi Azadi Sq. 95.8 78.2 53.8 264.2 81.7 57.5
5 Albourz Vesal St. 82.3 62.3 44.2 170.8 68.1 49.2
6 Imam Khomeini Keshavarz Blvd. 78.1 57.6 38.2 205.2 68.3 49.3 7 Cancer Institute Keshavarz Blvd. 74.8 58.4 36.3 222.3 67.9 48.7
8 Pars Keshavarz Blvd. 99.6 70.5 56.2 223.4 71.1 51.6
9 Rasoul Akram Sattarkhan St. 70.3 48.2 38.3 212.1 64.2 46.5
10 Ravan Pezeshki Jenah Highway 119.4 92.8 67.2 137.2 49.2 35.4
11 Sasan Keshavarz Blvd. 96.8 70.2 51.3 252.7 74.3 54.1
12 Central 1 Bagherkhan St. 75.5 58.2 34.2 180.7 69.7 52.2
13 Sajjad Fatemi Sq. 93.2 76.5 52.3 180.3 61.4 44.3
14 Shriati Kargar St. 62.4 46.8 39.1 204.1 62.8 44.1
15 Firouzgar Taleghani St. 97.3 79.2 53.4 212.9 70.4 48.8
16 Ghalb Kargar St. 65.8 50.3 38.2 200.2 63.4 44.9
17 Kudakan Taleghani St. 107.1 86.2 69.3 194.9 68.8 52.8
18 UT Health Center Enghelab St. 90.7 73.2 54.6 170.7 75.9 58.5 19 Tebbi Kudakan Dr. Ghareeb St. 77.6 53.6 41.3 222.3 67.5 48.3 20 Mustafa Khomeini Italia St. 101.1 71.1 58.3 221.5 71.5 51.9
21 Mehr Zartosht St. 92.7 65.8 33.8 197.5 62.7 48.6
22 Meymanat Azadi Sq. 98.2 69.2 48.3 306.2 82.7 55.3
4. CONCLUSION
GIS modeling for an 18.2 km2 selected district in Tehran has been developed to assess the critical state of particulate matter concentration in an important part of Tehran, where the
so-called “Traffic Zone” is located and also many main Tehran`s hospitals, like “Imam Khomeini”, “Ravan Pezeshki” and “Kudakan” are continuing their daily activities during warm and
cold seasons.
The annual average concentration of PM10 and PM2.5 in all the 42 sites and also in any point within the selected district exceed the National air Quality Standard (NAQS) values which set to be 50 g/m3 and 15 g/m3 respectively. Also in the cold season, daily average concentration of particles exceed the standard values of 150 µg/m3 (24hr standard limit for PM10) and 65 µg/m3 (24hr standard limit for PM2.5).
In comparison with the warm season, the concentrations of suspended particles in this district are much higher in the winter time. The mean concentrations of PM1.0, PM2.5 and PM10 have been found to be 13.14 g/m3, 22.67 g/m3 and 95.72 g/m3 in the warm season. The concentrations of particulate matter increase in the winter time. For example mean concentrations of PM10, PM2.5 and PM1.0 have been measured to be 50.12 µg/m3, 70.72 µg/m3 and 193.86 µg/m3 in the cold season respectively. In the warm season, highest concentration of PM10, which comes up to 529.24 g/m3, belongs to “Valii Asr” square, but it is the worst place with respect to PM2.5 (105.88 g/m3). The highest concentration of PM1.0, (89.87 g/m3) has been found
for “Jomhouri Square” in Tehran. In the winter time, highest concentrations of PM10, PM2.5 and PM1.0 have been measured to be 166.22 µg/m3 (Karaj Road – Airport Entrance), 209.21 Reducing the healthcare costs of urban air pollution: The South Africa experience. Journal of Environmental Management, 84, pp. 27-37. rural landscapes: defining sufficient realization for environmental decission-making. Landscape & Urban Planning, 65, pp. 117-131.
Bruckman, L., Dickson, R. J. and Wilkosen, J. G., 1992. Use of GIS software in the development of emissions inventories and emission modeling. Proceedings of the Air & Waste Management Association, Pittsberg, PA, USA.
Burrouigh, P. A. and McDonald, R. A., 1998. Principles of geographical information systems. Oxford University Press, pp 333, Oxford.
Cautreels, W. and Van Cauwenberghe, K., 1978. Experiments on the distribution of organic pollutants between airborne particulate matter and the corresponding gas phase. Atmospheric Environment, 12, pp. 1133-1141.
Douglas, W. D., Joel, S. and John, D. S., 2002. Air Pollution and Daily mortality: Associations with particulates and acid aerosols. Environmental Research,69,pp. 362-373.
Duanping, L., Donna, P., Yinkang, D., Eric, W., Jianwei, D. Richard, S., Hung-mo, L., Jiu, C. and Gerardo, H., 2006. GIS approaches for the estimation of residential-level ambient PM concentrations. Environmental Health Perspectives, 114, pp. 1374-1380.
Gavin, C., Gareth, J., Malkolm, H. and Stephen, D., 2007. Predictive uncertainty in environmental modeling. Neural Networks, 20, pp. 537-549.
Goodchild, M. F. et al., 1996. GIS and environmental modeling. Progress and research issues, Fort Collins, CO; GIS World Book, pp 486.
Gramotnev, G. and Ristovski, Z., 2004. Experimental investigation of ultra fine particle size distribution near a busy road. Atmospheric Environment, 38, pp. 1767-1777.
Halek, F., Kavousi, A. and Montahaie, H., 2004. Role of motor-vehicles and trend of air borne particulate in the Great Tehran area, Iran. International Journal of Environmental Health Research, 14, pp. 301-307.
Haghdoost, A. A., Mirzazadeh, A., Alikhani, S., 2008. Secular Trend of Height Variations in Iranian Population Born between 1940 and 1984. Iranian J. Public Health, 37, pp. 1-7.
Keyhani, A., Ghasemi-Varnamkhasti, M., Khanali, M. and Abbaszadeh, R., 2010. An assessment of wind energy potential as a power generation source in the capital of Iran, Tehran. assessment of particulate air pollution in urban areas of Beijing in 2000-2004. Science of the Total Environment, 376, pp. 100-108.
Nabi Bidhendi, G. R. and Halek, F., 2007. Aerosol Size
Segregated of Tehran’s atmosphere in Iran. International Journal of Environmental Research, 1, pp. 58-65.
Patel, T. S. and Raiyani, C. V., 1995. Indoor air quality: problems and perspectives. In: Energy Strategies and Green House Gas Mitigation. Ed. P. R. Shukla, New Delhi, p72.
Silibello, C., Calori, G., Brusasca, G., Giudici, A., Angelino, E., Fossati, G., Oeroni, E. and Buganza, E., 2007. Modeling of PM10 concentrations over Milano urban area using two aerosol modules. Environmental Modeling & Software, xx, pp. 1-11.
Smith, K. R., 1996. Indoor air pollution in developing countries: Growing evidence of its role in the global disease burden. In: Indoor Air 96, proceedings of 7th international conference on Indoor Air and Climate. Ed. K. Ikeda and I Iwata. Institute of Public Health, Tokyo, p 33.
Sohrabinia, M. and Khorshiddoust, A. M., 2007. Application of satellite data and GIS in studying air pollutants in Tehran. Habitat International, 31, pp. 268-275.
Tolga, E., 2004. A GIS based decision support system for estimation, visualization and analysis of air pollution for large Turkish cities, Atmospheric Environment, 38, pp. 4509-4517.
Wilfred, W. and Gerald, S., 2005. Environmental software systems for emission inventories. Environmental Modeling & Software, 20, pp. 1469-1477.
World Health Organization European, 1997. Regional office for Europe, Copenhagen. Air Quality Guidelines for Europe, Series no 23.
Younes, N., Ryuichi, I., Hikari, F. and Toshiaka, T., 2008. GIS integration model for geothermal exploration and well siting. Geothermics, 37, pp. 107-131.
Yuqiong, L., Hoshin, G., Everett, S. and Thorsten, W., 2008. Linking science with environmental decision making: Experiences from an integrated modeling approach to supporting sustainable water resources management. Environmental Modeling & Software, 23, pp. 846-858.
Zhou, P., Ang, B. W. and Poh, K. L., 2006. Decision analysis in energy and environmental modeling: An update. Energy, 31, pp. 2604-2622.