Analysis Physical Characteristics...(Miardini et al.)
Available online at http://Journals.ums.ac.id/index.php/fg/article/view/1131
Analysis Physical Characteristics of Land for Estimated Runoff
Coefficient as Flood Control Effort in Comal Watershed, Central
Java
Arina Miardini1 and Pranatasari Dyah Susanti
Institute of Technology Forestry Watershed Management Research Surakarta (Balai Penelitian Teknologi Kehutanan Pengelolaan DAS Surakarta)
Jl. A. Yani–Pabelan, Kartasuro PO BOX 295 Surakarta 57102 Telp. (0271) 716709, Fax (0271) 716959
1Corresponding author (email: [email protected])
Abstract
The vast area of critical land was evidenced to be a serious threat for watershed carrying capacity which eventually affected the hydrology imbalance in the watershed area. The purpose of this study is to identify
the physical characteristics of Comal watershed which have significant influence in determining the runoff and calculating the runoff coefficient by taking into account the parameters of watershed’s physical
characteristics. The method used in this analysis is Cook method, unit of analysis in this study is land mapping unit. Peak discharge determination is performed by using the Rational method. The analysis
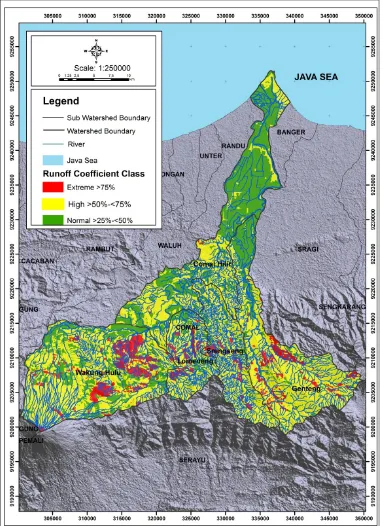
showed that runoff coefficient of Comal watershed is 61.63%, which can be categorized as high. The runoff coefficients and peak discharge calculations of each sub watershed, respectively, Comal Hilir of 52.65%
with peak discharge 505.68 m3/sec, Genteng of 65.04% with peak discharge 542.44 m3/sec, Lomeneng of 64.00% with peak discharge 194.23 m3/sec, Srengseng of 64.10% with peak discharge 270.46 m3/sec, and Wakung Hulu of 62.34% with peak discharge 686.64 m3/ sec. Comal watershed flood control priority on increasing the rate of infiltration, slope management, increasing vegetation cover and management of
drainage density.
Keywords: watershed characteristic, land, runoff coefficient, flood, Comal watershed
Abstrak
Luas lahan kritis yang makin meningkat mengancam keseimbangan hidrologi dalam DAS. Salah satu DAS yang memiliki lahan kritis dan memerlukan prioritas penanganan adalah DAS Comal. Tujuan penelitian ini adalah mengidentifikasi karakteristik fisik DAS Comal yang berpengaruh dalam penentuan koefisien aliran serta menghitung koefisien aliran dengan mempertimbangkan parameter karakteristik fisik DAS. Metode penelitian yang digunakan untuk mengetahui karakteristik fisik DAS menggunakan metode Cook. Unit analisis yang digunakan dalam penelitian ini adalah satuan lahan. Penentuan debit banjir dilakukan menggunakan metode rasional. Hasil analisis menunjukkan bahwa nilai koefisien DAS Comal yaitu 61,63% yang termasuk kategori tinggi. Nilai koefisien aliran dan perhitungan debit pada masing masing sub DAS yaitu Comal hilir 52,65% dengan debit sebesar 505,68 m3/dtk, Genteng 65,04% dengan debit sebesar
542,44 m3/dtk, Lomeneng 64,00% dengan debit sebesar 194,23 m3/dtk, Srengseng 64,10% dengan debit
sebesar 270,46 m3/dtk, dan Wakung hulu 62,34% dengan debit sebesar 686,64 m3/dtk. Pengendalian banjir
di DAS Comal diprioritaskan pada peningkatan laju infiltrasi, pengelolaan kemiringan lereng, peningkatan tutupan vegetasi dan pengelolaan kerapatan aliran.
Kata kunci: karakteristik DAS, DAS Comal, banjir limpasan, koefisien aliran. metode cook, rasional
Introduction
Numerous watersheds in Indonesia are enduring the impact of degradation due to exploitative land use and environmental carrying capacity. Based on Direktorat Jenderal Bina Pengelolaan Daerah Aliran SungaiandPerhutanan Sosial in Buku Statistik Kehutanan (2006 and 2011), it is mentioned
the impacts of hydrology imbalances in the
watershed is flood. Sinukaban (2007) also suggests that flood is an obvious indicator of
watershed dysfunction caused by the decline
of infiltration as the result of eliminated
vegetation cover and inappropriate land use. The ignorance of this damage will just add the long list of critical watersheds in Indonesia. Flooding will be discussed in this paper is
the flood derived from land or known as the overland flow. Type flood that comes from
surface runoff before entering the river system.
Rencana Pembangunan Jangka Menengah/ RPJM) 2010-2014 explicitly states a number of 108 watershed in Indonesia are included in critical condition and watershed priority (The Ministry of Forestry has issued Decree No. SK.328/Menhut-II/2009). Comal watershed is one among Priority I watersheds. Comal watershed has an essential function especially for its raw water supply for numbers of daily needs such as irrigation, households, and industry for 5 districts. The categorization
of Comal watershed as Priority I is mainly
caused by its flood intensity. For instance,
based on the data from Badan Nasional
Penanggulangan Bencana/BNPB, flood took
place in Bodeh, Comal, Ulujami, Ampel, Gading, Taman, Petarukan, and Pemalang on 4 March 2014. The condition is worsened by the increasing population density and intensive natural resources exploitation, resulting in the massive watershed conditions such as
landslides, erosion, sedimentation, flood,
drought (Suharyono et al., 2015).
Watershed’s response to the waters system is
strongly affected by the physical characteristics
of watershed. The characteristics can be defined as specific illustration of watershed adduced
by the parameters related to morphometry, topography, soils, geology, vegetation, land use system, hydrology, and human activity (Seyhan, 1977). According to Supangat
(2012), the watershed’s condition relied upon
the nature as well as on land use system as
human involvement. In flood control efforts,
an inquiry on land physical characteristics which affect the amount of runoff is required so as to formulate recommendations for
flood control in a given watershed in the
context of upstream to downstream watershed management efforts. The magnitude of the
flood is strongly influenced by the intensity
of the rainfall, watershed area and runoff
coefficient. Static factors such as rainfall and
watershed area is a natural factor, whereas a
more dynamic runoff coefficient so that the flood control can be done by managing the runoff coefficient.
The aim of the study is to identify the physical characteristics of Comal watershed which
influence the runoff determination and to calculate the runoff coefficient by examining
the parameters of watershed physical characteristics. The yield of the inquiry will
be the basis of flood control recommendation
in Comal watershed, particularly in sub
watersheds with flood vulnerability as the
efforts to uphold upstream to downstream watershed management.
Method
Study was carried out in Comal watershed (DSA) in September to November 2015. Total area of Comal watershed is 82140.30 ha with 212.99 km in perimeter. The main river of Comal watershed is Kali Comal of 104.14 km in length. Materials used in this study consist of: Map of Comal watershed, data of daily precipation data of 10-year series (2005-2014) from 12 rain stations (Randudongkal, Sipedang, Sumubkidul, Banjardawa, Warungpring, Bongas, Moga, Brondong, Ponolawen, Kaliwadas, Sokowati, and Klayeran), digital data of Landsat 8 Imagery of 2014 Path/row 120/66 spatial resolution of 30 x 30 m, RBI Digital Map scale 1:25000, Soil Type Map scale 1:250000, and Forest area map. The tools used in this study include
Notebook ASUS Core i3 with capacity of 6
GB in RAM and harddisk 500 GB, Software
Arc GIS 10.1, Software Ms.Word, and Ms.
The physical characteristics of watershed
was analyzed by using Cook’s method in
accordance to Chow (1964) and Meijerink
(1970). In this method, the estimation of runoff
was carried out through runoff coefficient by examining the wathershed’s characteristics of slope, inflitration, vegetation cover, and
drainage density. The analysis unit in the study was land mapping unit. Meijerink (1970) in Gunawan (1991) affirms that land mapping
unit is a preferred interpretation unit and landscape visual mapping unit in association with hydrology process. The step of the study is illustrated in Figure 1.
Figure 1. Research Flowchart
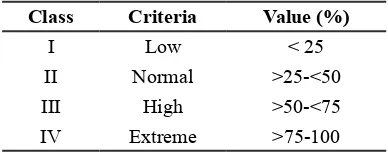
The value of runoff coefficient, subsequently, was classified based on Cook’s method which
was divided into 4 (four) classes with detail
categorization as follows:
Table 2 Runoff Coefficient Classification
Class Criteria Value (%)
I Low < 25
II Normal >25-<50
III High >50-<75
IV Extreme >75-100
Source: Meijerink (1970)
Results and Discussion
The Physical Characteristics of Study Area
The analysis indicates there is a total of 247 land mapping units in Comal which consists of 2353 poligons. The amount of runoff in each land mapping unit is calculated by considering the characteristics factors of watershed in
parameters, furthermore, are classified and proportionally scored based on their influence on runoff coefficient (Gunawan, 1991). The
result of analysis is presented in Table 2.
Slope is included in the factor affecting the amount of rainfall will eventually surge as runoff. Goro (2008) and Suhardiman (2012) that the slope will affect the runoff and the water possibility to seep into the ground will be smaller so that it will increase the potential
for flooding in a watershed.
The percentage of slope in each sub watershed
can be figured out in Table 2. In this table,
Genteng and Srengseng sub watershed have the highest percentage of slope in
class >30%, respectively, of 43.76% and 52.24%. Lomeneng and Wakung hulu sub
watershed are evidenced to have the highest
percentage in class 10-30%, respectively, of 54.7% and 49.59%, meanwhile Comal Hilir
sub watershed has the highest percentage of
70.89% in slope of 0-5%. The dominant slope
in Comal watershed turns out to be susceptible, since the potential of land degradation will
result on higher amount of runoff coefficient.
In addition, land with hilly to steep conditions causing rainfall pours down in relatively high speed, hence, it have inadequate time to
infiltrate. It is similar to Suhardiman (2012)
who suggests slope is an elevation of land
surface that will affect the rate of infiltration.
As illustrated in Table 2, it can be observed that the dominant vegetation cover in the class
of >80%, which are Genteng sub watershed (36.6%), Lomeneng sub watershed (46.65%), Srengseng sub watershed (43.28%), and Wakung Hulu sub watershed (39.3%), while Comal Hilir sub watershed is on class of 10-80% with the percentage of 45.82%.
The information of vegetation cover is very
significant due to its highly correlation
with the runoff. The higher is the amount of vegetation in a given land, the lower will the runoff (Saribun, 2007). It is similar with the study conducted by Rajarjo (2013), in which water unretained by the vegetation and cannot
seep into the ground will be a runoff that will gather in the tributaries so that the peak discharge will increase.
Drainage density is an important characteristic of watershed as it is used to evaluate the potential of runoff. It is the comparison between total area of watershed and total length of all the streams and rivers in a watershed (Raharjo, 2009). A watershed with
one watercourse and numbers of tributaries’
branch has a higher drainage density compared to a watershed with a watercourse and a few of tributaries (Indarto, 2010). The highest drainage density of (>5 mill/mill2) in Comal
watershed (Table 6) occurred in 4 (four) sub
watersheds, while Comal Hilir sub watershed
has the highest drainage density in the class of 0-1 mil/mill2. High drainage density allows
runoff from the area above the tributaries to
be efficiently drained, since the rainfall will flow into the tributaries quickly, rainfall will
be divided and will reduce the peak discharge.
Infiltration is important process of runoff.
It determines the amount of rainfall which can be absorbed into the soil. The higher
is the value of infiltration, the smaller is the
difference between rainfall intensity and
infiltration capacity, since the runoff is smaller
and so is the peak discharge. According to Widianto et al., (2004), in the case of rainfall is directly poured down to the ground, the soil aggregates will be destroyed and it causes the space of macro pore is reduced so that
the infiltration rate is declined. In addition to
the vegetation as the resistor of the amount
of rainfall into the ground, soil infiltration is
also affected by the nature of soil physical properties. It is stated by Rohmat and Sukarno
(2006) that the infiltration rate is a function
of permeability parameters and soil moisture which is closely related to the soil physical properties.Based on the result of the analysis
(Table 5), on infiltration parameter, there are
three sub watersheds are included in the slow
are included in the category of medium. It indicates that soil texture is evidenced to
have influence on infiltration rate. According
to Arsyad (2000), soil properties which
determine and limit infiltration capacity is soil
structure and it is powerfully affected by water texture and content. In addition, Fonth and
Adisoemarto (1994) in their study imply that
the relative size of soil particle is expressed
in terms of texture refers to the smoothness or roughness of the soil. Soils with smooth texture, such as clay, have small pore spaces,
hence, the infiltration is slow as it requires long time for rainfall to fill the soil pores.
Table 2 Parameter of Runoff Coefficient Estimation Values in Each Sub watershed
No Sub
watershed
Parameter of Runoff Coefficient Estimation
Slope Vegetation Cover Drainage Density (mill/mill2) Infiltration Rate
Class Area (ha)
Percentage (%) Class
Area (ha)
Percentage (%) Class
Area (ha)
Percentage (%) Class
Area (ha)
Percentage (%)
1 Comal Hilir
>30% 208.41 0.96 >80% 940.01 4.33 >5 8258.23 38.04 Moderate 13453.28 61.97
0-5% 15389.5 70.89 10-80% 9947.22 45.82 >2-5 1478.41 6.81 Slow 8227.84 37.90
10-30% 5119.06 23.58 0-10% 6072.10 27.97 >1-2 1120.2 5.16 Ignored 28.22 0.13
5-10% 992.12 4.57 0% 4750.00 21.88 0-1 10852.5 49.99
2 Genteng
>30% 8249.30 43.76 >80% 6899.55 36.6 >5 8358.64 44.34 Moderate 3928.60 20.84
0-5% 2803.18 14.87 10-80% 3210.37 17.03 >2-5 1557.11 8.26 Slow 13003.59 68.98
10-30% 7563.12 40.12 0-10% 4397.99 23.33 >1-2 1374.26 7.29 Igored 1919.06 10.18
5-10% 235.64 1.25 0% 4343.33 23.04 0-1 7561.23 40.11
3 Lomeneng
>30% 2336.45 34.06 >80% 3200.10 46.65 >5 3294.77 48.03 Moderate 508.31 7.41
0-5% 588.57 8.58 10-80% 718.91 10.48 >2-5 412.961 6.02 Slow 5328.70 77.68
10-30% 3752.32 54.7 0-10% 1590.10 23.18 >1-2 391.695 5.71 Ignored 1022.80 14.91
5-10% 182.47 2.66 0% 1350.70 19.69 0-1 2760.39 40.24
4 Srengseng
>30% 4982.13 52.24 >80% 4127.61 43.28 >5 6389.79 67 Moderate 0 0
0-5% 458.73 4.81 10-80% 1174.00 12.31 >2-5 453.961 4.76 Slow 8996.25 94.33
10-30% 3990.28 41.84 0-10% 2887.80 30.28 >1-2 515.952 5.41 Ignored 540.75 5.67
5-10% 105.86 1.11 0% 1347.58 14.13 0-1 2177.3 22.83
5 Wakung Hulu
>30% 6215.14 24.68 >80% 9896.88 39.3 >5 10690.1 42.45 Moderate 12410.14 49.28
0-5% 3243.56 12.88 10-80% 1876.13 7.45 >2-5 4099.78 16.28 Slow 9957.32 39.54
10-30% 12488.21 49.59 0-10% 7552.35 29.99 >1-2 506.176 2.01 Ignored 2815.45 11.18
5-10% 3236.00 12.85 0% 5857.54 23.26 0-1 9886.81 39.26
Estimation of Runoff Coefficient
The value of runoff coefficient in each sub
watershed in Comal Watershed (C) ranges from 52.65 to 65.04 with an average value of 61.63 (Table 3). From the analysis, the highest
coefficient value was obtained by Genteng
sub watershed and the lowest was Comal Hilir
sub watershed. C value indicates that Comal
watershed can be categorized as high, it means
that high amount rainfall becomes runoff and
Table 3 Runoff Coefficients of Sub watershed in Comal Watershed
No Sub watershed Score S Score V Score I Score D Score C
1 Comal Hilir 15.46 13.37 10.46 13.36 52.65
2 Genteng 31.24 11.63 10.03 12.14 65.04
3 Lomeneng 31.36 10.77 9.98 11.88 64.00
4 Srengseng 34.14 10.76 10.00 9.20 64.10
5 Wakung Hulu 28.59 11.85 9.99 11.90 62.34
Rata-rata 28.16 11.68 10.09 11.70 61.63
Source: Data Processing and Analysis, 2015
Assessment of peak discharge used in this study is done through Rational Method which
is affected by the factors of runoff coefficient, rainfall intensity, and watershed’s area. Runoff
is the most dynamic response in a watershed that is related to rainfall (Liang et al. and Mu et al., 2015). Data of maximum rainfall intensity is determined through the daily rainfall data of rain gauge station. Assessment of the maximum daily rainfall is done by calculating
the Thiessen coefficient of each rain station.
The result of rainfall calculation indicates the maximum daily precipitation in Comal watershed was 124.26 mm which occurred on January 29.
Rainfall and runoff are interconnected, and further, they constitute a major problem in
the field of hydrology (Liang et al., 2015). Monde (2010) suggests that in addition to the extensive catchment area, the amount of
rainfall intensity also affects the amount and velocity of runoff. Based on the calculation, rainfall intensity of Comal watershed was 15.91 mm with time of concentration of 7 hours 54 minutes. The value of peak discharge in each sub watershed can be calculated as follows in Table 9.
Estimation on the peak discharge in Comal watershed which was calculated in each sub watershed adduced that the highest discharge
was in Wakung Hulu sub watershed of 686.64
m3/sec and the lowest was in Srengseng sub
watershed of 270.46 m3/sec. The largest
contributor of overland flow in Comal watershed was Wakung Hulu sub watershed. Wakung Hulu sub watershed is located in the
upper area of Comal watershed. It is dominated by hilly to steep slopes, high drainage density,
slow-to-moderate soil infiltration, and low
density vegetation cover.
Table 9 Calculation of Peak Discharge (Q) of Sub watersheds in Comal Watershed
No Sub watershed C I (mm/hr) A (km2) Q (m3/sec)
1 Comal Hilir 0.53 15.91 217.09 505.68
2 Genteng 0.65 15.91 188.51 542.44
3 Lomeneng 0.64 15.91 68.60 194.23
4 Srengseng 0.64 15.91 95.37 270.46
5 Wakung hulu 0.62 15.91 251.83 686.64
Source: Data Processing and Analysis, 2015
In managing the attempts of flood because of land (overland flow) control in Comal watershed, the most significant parameter
from the four analyzed parameters should be
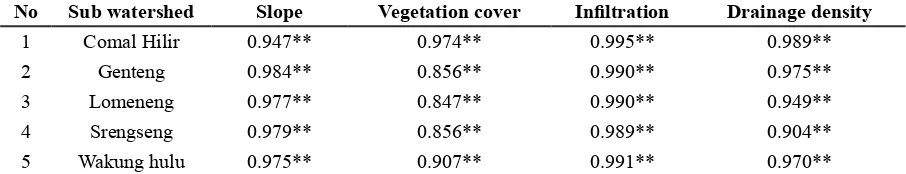
determined. In accordance to the assessment of correlation on C value (Table 5).
Table 5 Correlation Value of Runoff Coefficient Estimation Factors
No Sub watershed Slope Vegetation cover Infiltration Drainage density
1 Comal Hilir 0.947** 0.974** 0.995** 0.989**
2 Genteng 0.984** 0.856** 0.990** 0.975**
3 Lomeneng 0.977** 0.847** 0.990** 0.949**
4 Srengseng 0.979** 0.856** 0.989** 0.904**
5 Wakung hulu 0.975** 0.907** 0.991** 0.970**
Source: Data Processing and Analysis, 2015
Implication toward Flood Control Efforts The main target of flood control is the
restoration, reclamation and conservation of land use in accordance with the function
and the region or spatial plan that can be controlled runoff because the functioning of vegetation cover on any land use and
region. Flood management in each watershed will be different according to the contribution of each parameter in the assessment of runoff
coefficient. Based on the correlation analysis,
the priority control for Comal watershed are:
(1) increasing the rate of infiltration, (2) slope
management, (3) increasing vegetation cover and (4) management of drainage density, with the following explanations:
a. Increasing the rate of infiltration
Increasing infiltration capacity can be
increased through the making biopori especially in residential areas and adding soil improvement materials. According to Subagyo (2004), the runoff, soil, and
infiltration capacity controls are vital in
the runoff management. Biopori is a small hole in the ground which is naturally formed by the activity of soil organisms. The existence of the organic material can be as a unifying or binding soil grains (granulator), a source of nutrients, enhancing the ability of soil holds water (holding capacity), an addition to the cation exchange capacity (cation exchange capacity) as well as the energy source for microbes and makroba soil (Gardiner and Miller 2004). Soil organic matter is a source of food for soil organisms, thus stimulating the formation of soil structure over crumbs and ultimately can improve
soil infiltration capacity.
Biologically, to promote the improvement
of soil infiltration capacity, the are
required. Simple and inexpensive method is the treatment of compost or organic
fertilizer. The addition of organic matter
in the soil is capable in slowing down the
rate of runoff, increasing the infiltration, and stabilizing soil aggregate (Nuraeni et al., 2013). In addition to organic
matter, utilization of soil fauna such as earthworms, can improve soil infiltration.
According to Subowo (2011), endogeic earthworm can construct soil pores and unite the soil layers. To support the
earthworm’s breeding and populations, organic fertilizer is required. Organic
matter as feed either vertically or to the inner layer of soil, can stimulate the worm to crawl up to the inner layer, so as to strengthen the absorption of water and to improve the soil pores (Subowo, 2011). It is similar to the analysis delivered by Iqbal (2015) that the addition of compost can increase the activity and population of soil organisms, improve soil structure, increase the ability to bind water and soil
aggregates, and increase infiltration.
b. Slope management
Land management in areas with steep slopes to steep and increasing vegetation cover by applying the principles of conservation of soil and water. A combination of conservation techniques encompassing of vegetative, mechanics,
and chemistry is ideal for flood control.
Mechanically, the factor of long and steep slopes can be overcome by cutting through the construction of terraces and contour planting. According to Arsyad (2010), bench terracing is able to reduce the slope length, as well as to decrease the runoff velocity and quantity. Mechanical technique is accountable for the management of slope and river.
River rehabilitation is also significant in flood control effort. Setyowati (2012)
suggests the establishment of well built embankment, particularly on the bank of the river, which is expected to withstand the high discharge, the establishment of
constructed channels flowing into the
main river is an attempt to reduce the pool
due to the poor infiltration, in addition
to crops planting with solid roots on the riparian areas which can strengthen the natural levee.
c. Increasing vegetation cover
The increasing vegetation cover can through several techniques such as
agroforestry and the utilization of grasses.
Agroforestry systems and grasses can
be applied as a flood control. According
to Atmojo (2008), agroforestry has an important role in watershed management
covering the ground completely so as to reduce the runoff and to improve the
soil infiltration capacity. In addition,
agroforestry systems with a variety of crops will construct solid roots, it will maintain the slope stability. Soan
et al., (2011) affirms the crops and
their residue can be used as protective ground against raindrops and runoff carrying capacity and subsequently, it
will improve soil infiltration capacity.
In addition to agroforestry, grasses can be used as terrace reinforcement. Nuraeni et al. (2013) confirms that
mechanical technique must be balanced with vegetative conservation by planting terrace crops such as grasses which serves as compost, fodder, and soil binder to prevent landslides. The combination between grass and agroforestry system can covered the ground surface, so it can reduce the runoff.
d. Management of drainage density
According to Pallard et al. (2009), drainage density is a catchment morphology and
may influence significantly the frequency regime of flood flows and control the formation of river flows. Because of that,
the management of drainage density is very important to reduce runoff.
Some management drainage density can
be through 1) the normalization stream
with the manufacture of plaster riverbanks (beronjong) in order to prevent erosion, landslides and increase the capacity of
water, 2) dredging river sediment, 3) creation of water storage as a water transit , 4) Preparation diversion if necessary
for the flow solver, 5) Protection of river
banks and reservoirs, 5) construction Rehabilitation riverbanks and levee.
Conclusion
Several physical characteristics of Comal
watershed were analyzed, consisting of slope, infiltration, vegetation, and drainage density.
As previously elaborated, conclusion can be drawn that from 5 (five) sub watersheds in
Comal watershed, 2 sub watersheds are in
slope of > 30%, 2 sub watersheds are in slope of 0-30%, and 2 sub watershed is in slope of 0-5%. The dominant vegetation cover in Comal watershed is >80%, dominant drainage density is categorized in class >5mill/mill2, and
dominant infiltration rate can be considered as slow. Runoff coefficient of Comal watershed is
61.63% or high category. The values of runoff coefficient and discharge calculation of each
sub watershed are, respectively, Comal Hilir
of 52.65% with peak discharge 505.68 m3/
sec, Genteng of 65.04% with peak discharge
542.44 m3/sec, Lomeneng of 64.00% with
peak discharge 194.23 m3/sec, Srengseng
of 64.10% with peak discharge 270.46 m3/
sec, and Wakung Hulu of 62.34% with peak
discharge 686.64 m3/ sec. Comal watershed
flood control priority on increasing the rate of infiltration, slope management, increasing
vegetation cover and management of drainage density.
References
Atmojo. S. W. 2008. Peran Agroforestri Dalam Menanggulangi Banjir Dan Longsor DAS. National Seminar “Pendidikan Agroforestry Sebagai Strategi Menghadapi Pemanasan
Global” organized by Faculty of Forestry, UNS. Solo, 4 March 2008.
Arsyad, S. 2000. Konservasi Tanah dan Air. IPB Press. Bogor
BNPB. 2015. Data Kejadian Banjir. http://geospasial.bnpb.go.id/pantauan bencana /data/ databanjir.php. Acessed at 8 October 2015.
Departemen Kehutanan. 2011. Buku Statistik Kehutanan Indonesia Tahun 2011. http://www. dephut.go.id/INFORMASI/STATISTIK/2001/Statistik2001.htm. Accessed at 2 March 2014.
Dewi. I. G. A. S. U., Trigunasih. N. M., and Kusmawati. T. 2012. Prediksi Erosi Dan Perencanaan Konservasi Tanah Dan Air Pada Daerah Aliran Sungai Saba. E-Journal Agroeoteknologi Tropika. Vol. 1, No. 1, July 2012: 12-23.
Gardiner, DT dan Miller RW. 2004. Soil in Our Environment 10th Edition. Prentice Hall. New
Jersey
Goro, G.L. 2008. Kajian Pengaruh Intensitas Hujan Pada Jenis Tanah Regosol Kelabu Untuk Kemiringan Lereng Yang Berbeda. Jurnal Wahana Teknik Sipil Vol. 13 No. 2 August 2008: 86-98
Gunawan, T. 1991. Penerapan Tekhnik Penginderaan Jauh untuk Menduga Debit Puncak menggunakan Karakteristik Lingkungan Fisik DAS. Studi Kasus di Daerah aliran Sungai Bengawan Solo Hulu. Disertation. Magister Program. Institut Pertanian Bogor. Bogor
Hadisusanto, N. 2010. Aplikasi Hidrologi. Jogja Mediautama. Yogyakarta
Indarto. 2010. Hidrologi, Dasar Teori dan Contoh Aplikasi Model Hidrologi. Bumi Aksara. Jakarta
Iqbal. 2015. Pengaruh Bahan Organik Terhadap Pemadatan Tanah Dan Produksi Tanaman Tebu Pada Lahan Kering. Jurnal AgriTechno (Vol. 8, No. 1, April 2015): 10-19.
Liang. D., Ozgen. I.O., Hinkelmaun. R., Xiao. Y. and Chen. J. M. 2015. Shallow water simulation of overland flows in idealized catchments. Environ Earth Sci (2015) 74:7307–7318. Meijerink, A.M.J. 1970 Photo Interpretation in Hydrology A Geomorphological Approach.
ITC. Delf
Monde. A. 2010. Pengendalian Aliran Permukaan dan Erosi Pada Lahan Kakao di DAS Gumbasa, Sulawesi Tengah. Media Litbang Sulteng III (2): September 2010: 131-136. Mu. W., Yu. F., Li. C., Tian. J. Liu. J. and Zhao. N. 2015. Effects of Rainfall Intensity and Slope
Gradient on Runoff and Soil Moisture Content on Different Growing Stages of Spring Maize. Water Journal, 7: 2990-3008.
Nuraeni, Sugiyanto, and Zaenal. 2013. Usahatani Konservasi di Hulu DAS Jeneberang (Studi
Kasus Petani Sayuran di Hulu DAS Jeneberang Sulawesi Selatan). Jurnal Manusia dan Lingkungan. Vol 20 (2) July 2013: 173-183.
Pallard. B., Castellarin. S. and Montanari. A. A Look at The Links Between Drainage Density And Flood Statistics. Hydrology and Earth System Sciences, 13: 1019-1029.
Rajarjo. P. D. 209. Perubahan Penggunaan Lahan Das Kreo Terhadap Debit Puncak Dengan Aplikasi Penginderaan Jauh. Jurnal Riset Geologi dan Pertambangan Vol. 19 No. 2 (2009).69 - 84.
Republik Indonesia. 2009. Keputusan Menteri Kehutanan No. SK. 328/Menhut- II/2009 tentang
Penetapan Daerah Aliran Sungai (DAS) Prioritas dalam Rangka Rencana Pembangunan Jangka Menengah (RPJM) tahun 2010-2014. Ministry of Forestry. Jakarta
Setyowati. D. L. 2014. Upaya Konservasi Lingkungan Pada Kawasan Industri Candi Kota Semarang Indonesian. Journal of Conservation. Vol. 3 No. 1 - Juni 2014 : 58-66.
Seyhan, E. 1977. Fundamentals of Hydrology. Translated by S, Subagyo. 1993. Dasar-Dasar
Hidrologi. Second edition. Gajah Mada University Press. Yogyakarta
Sinukaban, N. 2007. Peranan Konservasi Tanah dan Air dalam Pengelolaan Daerah Aliran Sungai. Bunga Rampai Konservasi Tanah dan Air 2004-2007. Masyarakat Konservasi Tanah dan Air. Jakarta
Soan. Pentewati. P., and Susilawati. 2011. Mengatasi Kerusakan Daerah Tangkapan Air Pada Pulau-Pulau Kecil Dengan Upaya Konservasi Tanah Dan Air Yang Didukung Oleh Ketersediaan Air Melalui Sistem Jebakan Air Berantai Pada Alur-Alur Alam. Jurnal Sipil UNWIRA Vol. 2 No. 1 September 2011: 16-23.
Subagyono, K., U. Haryati, and S.H. Talao’ohu. 2004. Teknologi konservasi air pada pertanian lahan kering. p. 151−188. In Konservasi Tanahpada Lahan Kering Berlereng. Center of Soil and Agroclimate Research and Development. Bogor.
Subowo. 2011. Penambangan Sistem Terbuka Ramah LIngkungan dan Upaya Reklamasi Pasca Tambang untuk Memperbaiki Kualitas Sumberdaya Lahan dan Hayati Tanah. Jurnal Sumberdaya Lahan. Vol 5, No. 2 December 2011.
Suhardiman. Pengaruh Intensitas Hujan dan Kemiringan Lereng Terhadap Laju Kehilangan Tanah Pada Tanah Regosol Kelabu. Faculty of Agriculture. Universitas Hasanuddin.
Makassar. 64 p.
Suharyono. E., Supriyadi, and Brian. 2015. Penilaian Daerah Tangkapan Air DAS Comal Dlam Upaya Peningkatan Kualitas Lingkungan di Kabupaten Pemalang. Agromedia. Vol. 33 No. 2 September 2015: 87-93.
Sunarti, Sinukaban. N., Sanim. B., and Tarigan. S. D. 2008. Konversi Hutan Menjadi Lahan Usahatani Karet dan Kelapa Sawit serta Pengaruhnya Terhadap Aliran Permukaan dan Erosi Tanah di DAS Batang Pelepat. JurnalTanahTropika, 13 (3), 2008: 253-260.
Supangat. A. B. 2012. Karakteristik Hidrologi Berdasarkan Parameter Morfometri Das Di Kawasan Taman Nasional Meru Betiri. JournalVol. 9 No. 3: 275-283.