HIGH RESOLUTION DSM AND CLASSIFIED VOLUMETRIC GENERATION: AN
OPERATIONAL APPROACH TO THE IMPROVEMENT OF GEOSPATIAL
INTELLIGENCE
P. Boccardo a, G. Gentili b a
ITHACA/Politecnico di Torino, C.so Castelfidardo 30/A, Torino, ITALY - ([email protected])
bBLOM CGR S.p.A., Via Cremonese 35/A, Parma, ITALY – ([email protected])
Commission VI, WG VI/4
KEY WORDS: DSM, DTM, Digital Photogrammetry, 3D Model
ABSTRACT:
As mentioned by Bacastow and Bellafiore, Geospatial Intelligence (GEOINT) is a field of knowledge, a process, and a profession. As knowledge, it is information integrated in a coherent space-time context that supports descriptions, explanations, or forecasts of human activities with which decision makers take action. As a process, it is the means by which data and information are collected, manipulated, geospatially reasoned, and disseminated to decision-makers. The geospatial intelligence professional establishes the scope of activities, interdisciplinary associations, competencies, and standards in academe, government, and the private sectors. Taking into account the fact that GEOINT is crucial for broad organizations, BLOM Group, a leading International provider within acquisition, processing and modeling of geographic information and ITHACA, a non-profit organization devoted to products and services delivering to the UN System in the field of geomatics, set up and provided GEOINT data to the main Italian companies operating in the field of mobile phone networking.
This data, extremely useful for telecom network planning, have derived and produced using a standardized and effective (from the production point of view) approach. In this paper, all the procedures used for the production are described and tested with the aim to investigate the suitability of the data and the procedures themselves to any others possible fields of application
1. INTRODUCTION
1.1 Geospatial Intelligence (GEOINT)
GEOINT, as reported by Clapper, encompasses all aspects of imagery (including capabilities formerly referred to as Advanced Geospatial Intelligence and imagery-derived MASINT) and geospatial information and services (GI&S); formerly referred to as mapping, charting, and geodesy). It includes, but is not limited to, data ranging from the ultraviolet through the microwave portions of the electromagnetic spectrum, as well as information derived from the analysis of literal imagery; geospatial data; and information technically derived from the processing, exploitation, literal, and non-literal analysis of spectral, spatial, temporal, radiometric, phase history, polarimetric data, fused products (that is products created out of two or more data sources), and the ancillary data needed for data processing and exploitation, and signature information (to include development, validation, simulation, data archival, and dissemination). These types of data can be collected on stationary and moving targets by electro-optical (to include IR, MWIR, SWIR TIR, Spectral, MSI, HSI, HD), SAR (to include MTI), related sensor programs (both active and passive) and non-technical means (to include geospatial information acquired by personnel in the field).
1.2 GEOINT and mobile phones network providers
Due to the fact that GEOINT represents a crucial step to organize, manage and disseminate geoinformation, mobile phones network providers have been, in the last decade, very active in this field with an increasing demand of spatial data. In addition, the huge investments available for the setting up and
the maintenance of these networks, represented a key point for the improvement of GEOINT in this particular industrial sector, Taking into account geoinformation, networks providers usually face a broad range of issues:
1. Definition of common reference systems; 2. Availability of 2D data for localization; 3. Availability of 3D data to select suitable sites
for cells positioning (comprising optical intervisibility);
4. Land cover data able to model absortion coefficients of the broadcast signal;
5. Database management of georeferenced features;
6. Maintenance protocols based on georeferenced features, comprising routing algorithms; 7. Geodata searching and retrieval; 8. Data dissemination.
It should not forgot to mention that, in accordance to many National regulations, the single provider must guarantee the service (the radio coverage) to at least 95% of the population and 98% of the whole National territory; this is another reason, and maybe one of the most important, why GEOINT, when overlayed by census data, is considered crucial by the providers themselves.
1.3 The key players
The BLOM Group is the largest provider of geospatial services in Europe for both government agencies and private commercial organizations and companies. BLOM owns exclusive spatial databases composed of maps, images and 3D models. Focused International Archives of the Photogrammetry, Remote Sensing and Spatial Information Sciences, Volume XXXVIII-4/W19, 2011
on online services, BLOM provides data and solutions to its customers in many markets and allows its partners to create high added-value applications based on BLOM data models and services. This strategy is backed by BLOM’s major technical capacity in aircrafts, cameras, laser scanners and mapping systems. This makes it possible for all projects to be carried out within the company, assuring a high quality product is delivered both on-time and to budget. BLOM has more than 1,000 employees and offices in 13 countries and its HQ is located in Oslo, Norway. BLOM is listed on the Oslo Stock Exchange (ticker BLO). The demand of advanced and high quality geographical information is steadily growing from year to year. BLOM holds a strong position in the digital geodata market and aims to be the most innovative service provider, and preferred choice for its customers.
ITHACA - Information Technology for Humanitarian Assistance, Cooperation and Action - is a non-profit association founded in November 2006 by the Politecnico of Torino and the Higher Institute on Territorial Systems for Innovation (Si.T.I.). It is located in the Politecnico of Torino campus. Through its partnership with the UN World Food Programme (WFP), the world's largest operational humanitarian agency - ITHACA is envisioned as a centre of applied research developing IT products and services in support of humanitarian activities. ITHACA is dedicated to scientific research, delivering methodologies, analytical services and technical tools which improve the capacity of WFP and the wider international community in early warning, early impact assessment and other related areas. The initiative was realized thanks to the support of the Politecnico di Torino, specifically with DITAG - the Land, Environment and Geo-Engineering Department - and other partners such as public and private research centers, enterprises operating in the aerospace and tele-communications fields and other companies supplying territorial data.
2. DESCRIPTION OF THE ADOPTED
METHODOLOGY
2.1 Specifications
The delivered data are related to the processes and products verification of oriented digital stereo strips acquired by an aerial digital camera in the visible and near infrared spectral bands, and the generation of a Digital Surface Model (DSM) and a classification of heigh values of on-the-ground obstacles (HOB) for all the Italian national territory.
The proposed specifications, agreed by the technical consultant and the mobile phone network providers, covers all the different steps of the geodata production, ranging from digital acquisition, strip orientation, DTM and DSM extraction, feature classification, to accuracy (both from geometric and semantic point of view) testing procedures.
2.2 Data acquisition
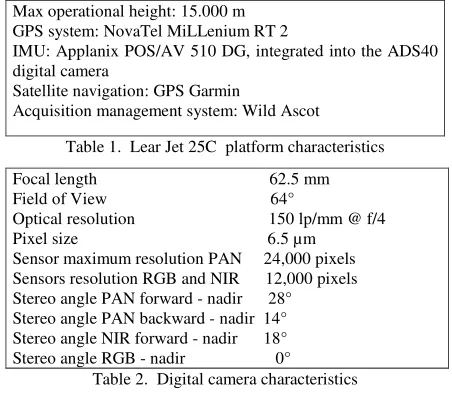
Data acquisition has been operated by means of a Lear jet 25C aerial platform equipped with a Leica ADS40 digital camera. The area acquired isaround 300.000 km2.
In Tables 1 and 2 tables the technical characteristics of the aerial platform and the digital camera.
Max operational height: 15.000 m GPS system: NovaTel MiLLenium RT 2
IMU: Applanix POS/AV 510 DG, integrated into the ADS40 digital camera
Satellite navigation: GPS Garmin
Acquisition management system: Wild Ascot
Table 1. Lear Jet 25C platform characteristics
Focal length 62.5 mm Field of View 64°
Optical resolution 150 lp/mm @ f/4 Pixel size 6.5 µm
Sensor maximum resolution PAN 24,000 pixels Sensors resolution RGB and NIR 12,000 pixels Stereo angle PAN forward - nadir 28° Stereo angle PAN backward - nadir 14° Stereo angle NIR forward - nadir 18° Stereo angle RGB - nadir 0°
Table 2. Digital camera characteristics
The digital camera system includes also an inertial measure unit (IMU), manufactured and delivered by APPLANIX; this instrument pools the functions of a digital gyroscope and a digital accelerometer, featuring high measuring accuracy. In the IMU, three gyroscopes and three accelerometers measure the variations to the flight angular setting and the speed with a 300 Hz frequency; this permits to know the spatial setting of the view, the use of the IMU/GPS systems permits to georeference all data directly and independently of topographic and/or photogrammetric operations. “lossy” type format, i.e. with minimum information loss. Le immagini digitali, e i dati GPS/IMU sono registrati durante la ripresa aerea su sul sistema di memoria di massa formato da quattro dischi SCSI ad alta velocità chiusi ermeticamente in un contenitore metallico in grado di assorbire colpi e vibrazioni. The digital camera is factory calibrated directly by the manufacturer through test flights prior to delivery. Calibration is based on two runs flown at two different altitudes according to a “cross” scheme. Also, each run is flown with complete overlapping in the two opposite directions. The digital images resulting are processed by an air triangulation process which elaborates the mathematical model of the corrections per each linear sensor.
2.3 Flight plan and digital acquisition
According to the technical characteristics of the digital camera ADS40, the resolution of the pixel on the round is a function of the flight altitude. The digital images are captured at an average relative flight height of 20500 feet (6300 metres), the average pixel resolution being therefore 56 cm. The deviation from the average value - due to the morphology of the ground, compatibility with the requirements of run continuity and International Archives of the Photogrammetry, Remote Sensing and Spatial Information Sciences, Volume XXXVIII-4/W19, 2011
possible constraints dictated by the authorities competent for air traffic regulations - is limited between ± 5%. To favour the synchronic aspect of the surveys on the different areas into which the work has been divided, the runs show as little discontinuance as possible. Transversal overlapping is 30-35% , while side one between contiguous runs is not less than 10% ± 5%.
Ground reference permanent stations have been used for the GPS procedure adopted ,which must acquire the signals with time characteristics (acquisition frequency: one second), electromagnetic (L1 + L2 with codes P and C/A) and quantitative characteristics (number of satellites recorded) similar to those of the systems operating onboard aircraft. The coordinates of the permanent stations are known and defined both in the WGS84 system and in the national geodetic one. The distribution of the permanent stations on the territory is such as to assure the best conditions for the calculation of the coordinates, since the flying aircraft are never more than 50 km from one of the permanent ground stations.
The GPS/Inertial data recorded by the digital camera ADS40 during the surveys and the recording of the GPS signals of the nearest reference permanent stations are processed by applying programs that are known and tested worldwide.
2.4 Aerial triangulation
The main purpose of the air triangulation is to balance the direct georeferencing assigned to each run during the air survey. Known coordinate points are however used in air coordination, both for georeferencing check and for its calculation.
Unlike traditional photogrammetric camera, the ADS40 digital cameras provide triple 100% overlapping (only 60% for the traditional camera), since the images are used from the three sensors in “forward”, “nadir” and “backward” position, thus enabling a more accurate determination of the link points. The air triangulation process is carried out through the ORIMA program by Leica Geosystems, which allows a fully automatic control. The points so determined are then used in “bundle adjustment” process, which is identical to the process used for the processing flow of traditional cameras.
The automatic tie points measurement (APM) is related to the collimation of the same point on forward, nadir e backward scenes. For the softcopy process SOCET SET and APM module are used for the automatic measurement of tie points, while ORIMA (ORIentation MAnagement) a bundle adjustment procedure is used for the block compensation.
The association between the digital scenes trajectories (level 0) and their geometric reconstruction (level 1) is operated by GPRO software (Ground PROcessing), developed by LH Systems.
2.5 DSM extraction
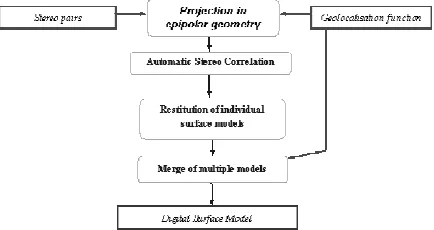
The DSM was generated with the proprietary technology Pixel Factory™ developed by Infoterra France, being one of the most effective and affordable technology to perform this process. Because this process implies an important calculation time, it was done on the parallel computer grid of processing centre, located in Sophia-Antipolis, France.
Fig. 1 shows the procedure adopted.
Figure 1. Flowchart representing the DSM extraction procedure
Raw image swaths are pre-processed and projected to common ‘epipolar’ geometry to reduce distortions. The epipolar environment reduces disparity between the images to a single side-to-side (horizontal) dimension.
A proprietary algorithm creates multiple combinations of stereo pairs for the area covered pairs (backward-nadir, nadir-forward, backward-forward). Stereopairs are built automatically, using an image-matching algorithm. Following the point-by-point measurement process, several Digital Surface Models will be obtained, and then merged into one single file (DSM) compiling the best altitude estimates all over the area.
The output of the automated process is an extremely dense grid of elevation measures (one point correlated every meter). At this step the DSM can include artifacts of three types:
- wrong correlation matching, by lack of textures (for example on water, or on roads along the flight direction). The effect is a noisy relief restitution.
- sharp elevation change (for example building edge, forest border, trees along road, bridges). The effect is a smooth transition (not a sharp angle in Z), because of the averaging effect of image-matching technique.
- interpolation, because of no correlated Z value. This occurs when there is a hidden zone, not seen in any stereopair (for example behind a building).
These kind of artifacts have been corrected in the editing step. Deliverable DSM (2 meters) is in BIL (Band Interleaved by Line) file format with world file HDR in WGS84 UTM projection.
Fig. 2 shows an example of the derived DSM.
Figure 2. Example of the derived DSM
2.6 Digital model of the heights of the obstacles (HOB)
The height values of the obstacles are derived through the difference among the elevation values of the DSM and the elevation values of the bare earth model (DTM). DTM data are generated by a filtering process performed on DSM data to International Archives of the Photogrammetry, Remote Sensing and Spatial Information Sciences, Volume XXXVIII-4/W19, 2011
separate elevation of landscape features from the elevation of the terrain. The filtering process was done through the well known software TerraScan® of the Finnish company TerraSolid. This activity was based on the procedure “classify ground” that perform a slope based filter. Since the filter algorithm’s have to operate under various conditions like forest, flat as well as step terrain, and cities, each of the above mentioned approaches requires a parameter setup to adapt the algorithm to the environmental conditions at the area to process. This automatic classification of the elevation belonging or not to the terrain was then edited manually if any gross error is detected. Due to the fact that the calculation of the mobile phone radio signal is performed to an average height of 1.5 m. (the usual position of a mobile phone operated by a standing user). the features that are smaller than 1,5 ÷ 2 meters are not represented in the final digital model of the Heights of the Obstacles (HOB)
Deliverable HOB (2 meters) is in BIL (Band Interleaved by Line) file format with world file HDR in WGS84 UTM projection.
Fig. 3 shows an example of the derived HOB (in the legend, as requested by the user, all the obstacles are classified in a 5 meter range).
Figure 3. Example of the derived HOB
2.7 CLAssification of HOB data values (CLA)
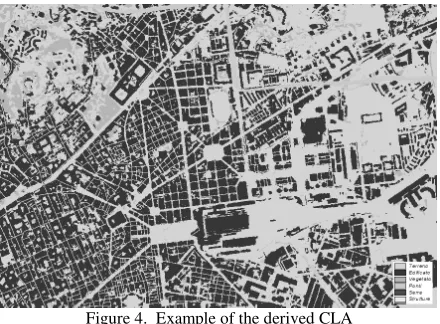
As mentioned before, the radio signal, apart from the optical intervisibility, could be strongly absorbed by features placed on the ground; in particular, vegetation irepresents one of this particular feature. HOBs should then be classified (CLA), clustering all the features above the ground level, in few basic classes (terrain, buildings, manmade infrastructures, trees). The classification process was performed and automated with a particular procedure developed in IDL environment (a programming package distributed by ITT Visual Information Solutions).
Basically HOB data are classified in “vegetated” or “not-vegetated”. From the HOB data is derived a mask that is applied to the NIR orthoimages of the aerial survey, in order to drive the classification process only over the landascape features represented by the HOB model. Pixel that have null values in the mask are classified as “terrain”.
The classic Normalized Difference Vegetation Index (NDVI) is the numerical indicator that was used to assess whether the pixel belong vegetation or not. The NDVI is calculated Near Infra Red (NIR) and the Red band (RED) as follows: NDVI = (NIR – RED) / (NIR + RED). Fig. 4, shows an example of the derived CLA.
Figure 4. Example of the derived CLA
The threshold value of vegetated class is manually set according to the landscape represented in the images.
The classification is then manually reviewed to correct errors that possibly comes from:
- shadows in very dark areas where the NDVI could not be determined correctly;
- regions where the flight date is not homogeneous;
- regions of vegetated areas where DTM filtering process has not distinguished “not-on-the-ground” from “ground” pixels; - regions of large building areas where DTM filtering process has not distinguished “not-on-the-ground” from “ground” pixels.
In the manual editing step a new class has been created to distinguish buildings from other kind of manmade objects such as bridges, overpasses, viaducts, etc.
Deliverable CLA (5 meters) is in BIL (Band Interleaved by Line) file format with world file HDR in WGS84 UTM projection.
3. ACHIEVED RESULTS
3.1 Accuracy tests
DTM (used to derive by difference from the DSM the HOB data), DSM and HOB should have, as regulated by the specifications, the following characteristics:
- a 5X5 m matrix structure;
- height precision: (r.m.s.e. or σ) ± 1.5 m (for at least the 65%
of the check points;)
- accuracy: ± 4 m (for at least the 95% of the check points);
- average error should not exceed 0.5 of r.m.s.e or σ;
- uniform reference system for the whole National territory (WGS84/UTM32N).
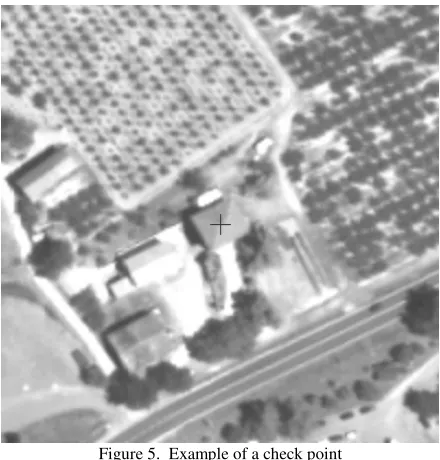
The testing phase has been realized performing a manual 3D measurement over around 10000 points, according to the following specifications:
- the whole National territory has been divided by provinces (105), where the number of check points has been established to be 1 for every 5753 inhabitants;
- for each province the total check points are divided into 1/3 for the province capital, 1/3 for the other cities and the last 1/3 for the remaining area;
- for each province, accordingly to the previous division, 50% of the the check points should be manmade obstacles (mainly International Archives of the Photogrammetry, Remote Sensing and Spatial Information Sciences, Volume XXXVIII-4/W19, 2011
buildings), 40% on the ground and the remaining 10% over vegetation (mainly trees where only the planimetric coordinates should be considered).
The measurements have been carried on using a photogrammetric digital station, and for any measured point, a photographic description (comprising 3D coordinates) has been extracted. In Fig. 5, an example is shown.
Figure 5. Example of a check point
HOB testing results are divided into the 3 typologies of obstacles:
-ground points. Height mean deviation: 0.45 m ± 0.83 m. 98.66% of the points are in the accuracy standards.
-obstacles points. Height mean deviation: 1.07 m ± 1.16 m.
94.57% of the points are in the accuracy standards.
-vegetation (these figures have been not requested by the specification). Height mean deviation: 1.39 m ± 1.03 m. 92.02%
of the points are in the accuracy standards.
Concerning the CLA data, all the previous point have been photointerpreted, and a confusion matrix has been generated. The general results, being the automatic classification procedure assisted by a manual editing, states that around 95% of the cells have been correctly classified. The remaining 5% reports a general misclassification where ground points are classified as obstacles (this is probably due to the resampling from the 50 cm original data to 5 m).
3.2 Data usability
Having an homogeneous data for all the National territory, mobile phone network providers have considered the products fully satisfactory, especially when the input constraints (par. 1.2) are taking into account.
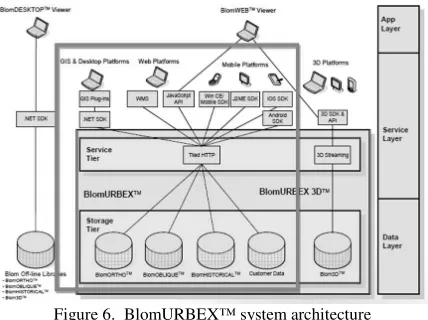
3.3 Dissemination (BlomURBEXTM)
Dissemination of the generated data have been realized using BlomURBEXTM. BlomURBEX™ is a geographic information server (geoserver) designed to offer fast, simple access to geospatial models through an extensive set of standardized interfaces on which multiple value-added services can be offered. BlomURBEX™ is also an online service able to show
the reality to in rich detail. The platform is accessible through a variety of technologies and applications via an HTTP interface, covering all environments from desktop to mobile: JavaScript, .NET, J2ME, Android and Windows embedded platforms. SDKs are provided for mobile platforms, allowing the developers to start of protocol details. It is fast and powerful enough to serve millions of users, robust and stable to meet the demands that any ambitious enterprise may require. At the moment BlomURBEX™ covers more than 1.100 urban areas in Europe, which in turn translates into more than 4.000 cities. BlomURBEX™ datasets are composed by vertical (ortho) images, oblique images, rasterized vector data, historical data, 3D city models, and custom datasets. The orthophoto layer is composed of vertical images in which it is not possible to appreciate the front of buildings. This layer is a continuous projected mosaic of vertical views. Most of these images were captured in high-resolution flights by Blom (15 or 10 cm per pixel), although in some European cities, images with a resolution of up to 4 cm per pixel are available. In addition BlomURBEX serves countrywide orthophoto for several countries in Europe, which resolution varies from 10 to 50cm.
Oblique images are aerial pictures taken with an inclination of approx. 45º, allowing users to visualize the façades of the buildings. Four views are available for every point (North, East, South and West), and more than one image of any view could cover one particular point, since the images have some overlap between them. Blom has the capability to generate oblique georeferenced imagery for the entire territory of Europe and has agreements with other companies to provide oblique imagery for other countries if needed. Images generated this have a resolution between 13 and 18 cm per pixel and measurements on the images can be done directly as the BlomURBEX™ API provides access to the metadata. This capability is owned exclusively by Blom BLOM has a Reseller Agreement with TeleAtlas, which allows it to use its vector information for different operations. BLOM has rasterised most of the TeleAtlas data in Europe. This makes it possible to display street information and street names on the vertical and oblique images without degrading performance, generating a "hybrid view" as a result. One very important characteristic of BLOM's cartographic data is that the system allows access to the date of the flight and capture of the information. BLOM stores all of the cartographic information organized by flight year, so that the applications can display the same geographic area over the course of different years in different ways (in adjacent windows, with a sidebar that fades to the images, etc.). Using this characteristic, applications based on BlomURBEX™ can show the historic evolution of a particular zone to the users based on the information available in the system, at no additional cost. Blom offers the possibility of hosting customer datasets that can be served through the same interfaces and with the same QoS as our own data. The custom datasets that we can import and serve are essentially ortho imagery and different types of vector data. The customer datasets are then deployed in a secure, controlled environment that only the customer has access to.
BlomURBEX™ is an online geoserver service with the technology to host and deliver all datasets with the required performance and availability for commercial application giving service to millions of users. The service environment of BlomURBEX™ is arranged in two tiers: a service tier running the front end functionalities and a storage tier containing the data weight. Fig. 6 shows the system architecture.
Figure 6. BlomURBEX™ system architecture
The Storage Tier holds all Blom Data Models in a convenient way to manage hundred of terabytes of information with a top-level performance.
BlomURBEX™ is based in a cluster architecture where all of the critical elements are redundant and interconnected independently. Current system architecture was designed to provide up to 18,000 tiles per second or up to 1,500 simultaneous users. The BlomURBEX™ platform is a system that serves spatial data over the internet to be consumed by end applications, regardless of the operational environment. To this end, BlomURBEX™ publishes different external APIs and SDKs that allow advanced applications to be built based on the platform's granular services. These integration interfaces services can be classified in three main types: Interfaces for web access: WMS Service and JavaScript API. Plugins for GIS systems and .NET SDK for desktop applications and SDKs for mobile devices
4. CONCLUSIONS AND FURTHER DEVELOPMENT
4.1 Procedures automation
Taking into account the possible automation of the procedures, in the near future, particular attention should paid to:
-a fully direct photogrammetric approach, where manual points collimation (in all the orientation phases and in the testing procedures) could be avoided if robust autocorrelation algorithms are used;
-a possible classification refining, trying, when possible, to avoid manual editing; misclassification, in fact, mainly derives from the presence of shadow areas and from the non uniformity of the acquisition date. These issues could be approached using classical remote sensing radiometric preprocessing like dark subtraction (modelling selective scattering), radiance/reflectance calibration to uniform taken conditions and using selective filtering to minimize shadows outliers;
-a fully 3D output viewing allowing editing, updating and feature extraction performed in the production phases and by the final user
4.2 Data integration (Lidar and Remote Sensing)
In the near future, especially when updating is concerned, a consistent integration with lidar data should be taken into account, both for accuracy improvement over the surveyed areas and to a direct generation of DSM products. From the CLA point of view, the availability of updated remotely sensed data (used in a monoscopic orthoprojected way) will allow both updating and checking aerial one. In addition, multitemporal
sensors ability (considering also sun synchronous orbits) could minimize radiance/reflectance differences over multiple passes, and multispectral high resolution (incorporating also different spectral bands than visible and near infrared) could allow the shadow radiance modelling.
4.3 GEOINT integration and updating
The availability of an effective dissemination platform allows also a very effective integration with different and updated source of data; orthoprojected images, vector data (especially geonames, street names and numbers, PoI, all used for routing and navigation modes), Lidar and remotely sensed acquisitions, represent a consistent GEOINT database fully available for information management.
In addition, apart from the direct usage, this data could be also part of different GEOINT environments such as (the list is not complete):
-evaluation of building volumes for planning and energy related issues;
-3D city and landscape modelling;
-3D navigation both for surface and aerial (e.g. UAVs) platforms;
-virtual globes;
-emergency management; -etc.
4.4 References
Masback, K. (2010), GIF 2010 Volume: 8 Issue: 6 (September) Clapper J. R. (2005), Memorandum for Principal Director of National Intelligence, on:
http://www.gwg.nga.mil/ntb/related/GEOINT_Definitions-Amplification_Memosigned.pdf
Becker, S., Haala, N. & Reulke, R. (2005): Determination and improvement of spatial resolution for digital aerial images, Proceedings ISPRS Workshop on High Resolution Earth Imaging, Hannover, May 17-20, 2005, digitally available on CD, 6 pages
Flint, D. (2005): Innovations to increase productivity of airborne sensors, in D. Fritsch (ed.): Photogrammetric Week ’05, Wichmann, Karlsruhe, pp. 69-77
Hinsken, L., Miller, S., Tempelmann, U., Uebbing, R. & Walker, S. (2002): Triangulation of LH Systems’ ADS40 imagery using ORIMA GPS/IMU, IAPRS, Vol. XXXIV, Part 3A, Graz, Austria, 7 pages, digitally available on CD-Rom International Archives of the Photogrammetry, Remote Sensing and Spatial Information Sciences, Volume XXXVIII-4/W19, 2011