MAPPING AND ASSESSING LAND USE/ LAND COVER CHANGE IN
MUHARRAQ ISLAND BASED ON GIS AND REMOTE SENSING INTEGRATION
M. Modara, M. Ait Belaid, S. Al-Jenaid
College of Graduate Studies, Arabian Gulf University
26671, Manama, Kingdom of Bahrain
KEY WORDS: Mapping, land use, land cover, GIS, Remote Sensing, Muharraq City, Bahrain
ABSTRACT
In this study, Remote Sensing (RS) and Geographic Information Systems (GIS) techniques were integrated to map out and assess the changes of Land Use/Land Cover (LULC) maps in Muharraq Governorate (Island), in the Kingdom of Bahrain, from 1951 to 2008. The datasets used are: analogue topographic maps for the years of 1951, 1970, 1977, 1985 and 1994, Aerial photographs taken in the years of 1961, 2001, and finally IKONOS Satellite imagery, taken in 2008 with ground spatial resolution of 1 m. The methodology adopted was based on the Collection of datasets mentioned above; Map scanning; Geo-referencing and/ or Ortho-rectification, Visual interpretation, and Results output. Visual interpretation was done and eight LULC maps (Classifications) were produced. The results showed that the total area of Muharraq has increased from 13 km2 in 1951 to 56 km2 in 2008. Accordingly, urban areas increased from 2.3 to 9.7 km2 and industrial area from 0.0 to 14.0 km2. Similarly, the length of coastal line has increased from 35.0 to 166.0 km and finally, the road network from 11.5 to 450.5 km.
1. INTRODUCTION
1.1 General Context
The Kingdom of Bahrain, an archipelago that consists of 36 islands totalling more than 740 km2 is located in the Arabian
Gulf. Its largest island, Bahrain, measures approximately 600 km2 and is home to the majority of its population. Causeways
connect the main island of Bahrain to Muharraq, the second largest, and with Sitra. The kingdom is also connected to Saudi Arabia via the King Fahad causeway.
To avoid being too dependent on oil, Bahrain, 40 years ago, adopted an economic diversification program and today it boasts one of the most diversified economies in the Gulf region. The country has established itself as the Gulf’s main centre for finance, insurance, and human resources (MOHME, 2001). In the consequence to the above, Bahrain, like most of the Arabian Gulf States, has experienced an accelerated social, economic, and industrial development growth and expansion, which exerted significant impacts on its environmental and natural resources. Being a 'small state' and with severe scarcity of land area, rapid urbanization, industrialization, and tourism/recreational facilities growth, pressured land-use planners to resort to the coastal and marine environment to accommodate for this expansion. In less than 20 years, the coastal zone of Bahrain has increased by about 40 km2 (ROPME, 2004).
Currently, the biggest threat to the marine ecology of Bahrain is from the ongoing and planned land reclamation and its associated dredging activities. The coastal map of Bahrain, and in particular the north and east coast have changed so dramatically in the recent years, that it is hard to imagine what the original coastline looked like only a few years ago. The pace of change is so rapid that even the planning maps are outdated before they are printed; making it more difficult to
predict and plan for environmental impacts (GEOMATEC, 2009).
Rapid industrialization combined with the urban sprawl is causing major pressures on the land area of Bahrain. In recent years, there has been a considerable reclamation of land from the sea which has caused blocking of natural drainage channels killing date palm trees and affecting mangrove swamps (Choudhury, 2004).
Currently, there is few existing effort to map and analyse the dramatic changes that have taken place in the Muharraq Island. Ben-Hamouche (2004) presented a paper for analyzing the historical development in Muharraq using RS data and GIS techniques. The paper was more historically oriented rather than mapping the change in the urban structure.
In the present study, Muharraq city (island), the second most important island in Bahrain has been selected as a case study to map the Land Use/ Land Cover changes (LULCC) within the city for the past five decades (1951-2008) by the use of Remote Sensing data and Geographic Information System, and to build a Geospatial database for the city in a GIS environment to assess and analyze the driving forces of the urbanization and help decision makers in maintaining the city’s existing urban development and better planning for the future urban growth and projects.
1.2 Research Objectives
1. Creating LULC maps of Muharraq for the years of 1951, 1961, 1990, 1977, 1985, 2001 and 2008, using the collected datasets;
2. LULCC detection will be done to assess the changes during the same period of time.
3. Mapping Muharraq Island shoreline evolution through the period 1951-2008;
4. Building and analyzing Muharraq Geospatial-Database based on ArcGIS software, using datasets collected from different sources and Ministries. 2. PREVIOUS STUDIES AND STUDY AREA
2.1 Previous Studies
To better understand the aim of this study, and its contribution to the field, it is important to place it in the context of what has already been done and what is currently known. What follows is a review of previous, but recent, literature on the topic, broken down into the four (4) following categories:
2.1.1 Change Detection Based on Remote Sensing: The visual appearance of human-made constructs in IKONOS (1 m panchromatic) and RADARSAT-1 (9 m resolution) satellite images were compared by Weydahl et al. (2005) who concluded that, although the two images had different resolutions, each contributed unique information useful to many mapping applications. The Study also found that multi-temporal RADARSAT-1 acquisitions could be used to detect human-made changes when weather conditions hamper optical imaging techniques.
Phalke (2005) stated that the modern world needs accurate information about changes in man-made objects (especially buildings) for urban planning and Geospatial Information Systems updating. Using positional information and feature matching techniques, he detected the changes between the 2001 and 2002 IKONOS images by extracting the same manmade objects (i.e. large buildings) from both images. To validate the changes obtained, the results were compared with change obtained from a Principle Component Analysis method and from a supervised classification method. The comparison demonstrated that the new developed method provided better results.
A visual interpretation was performed on pan-sharpen IKONOS imageries with (1 m) spatial resolution (October 2000) covering representative areas situated on the coast and at the mountains in Lebanon. Afterwards, spatial and statistical comparisons were conducted between the results obtained from the interpretation of IKONOS imagery and existing land use inventories. The later were produced from Indian satellite images (IRS-1C, 5.8 m) merged with multispectral Landsat-TM images (30 m), both acquired in October 2000, using visual interpretation techniques. These comparisons indicate the enhancement identification capabilities offered by IKONOS images in most cases and the limitations that can be offset in some other cases. IKONOS images show an improvement of land use maps spatial accuracy in mountainous areas more than coastal areas. The visual interpretation of IKONOS imagery performed at (88.5%) of accuracy, whereas the processing of Landsat-TM and IRS yielded (82 %) accuracy. The degree of spatial coincidence between land cover/use maps was equal to (87%) (Faour and Bou Kheir, 2006).
2.1.2 Geographic Information Systems: Coastal land-use change for Murrells Inlet in South Carolina was studied as an integral part of a five year disciplinary and multi-institutional coastal research project funded by
NASA/SC-EPSCoR. The conclusion was that GIS has advantages over conventional methods in integrating various data sources, performing spatial analysis, modelling spatial process, and mapping the results in land use change. A spatial multivariate logistic regression model was successfully applied which developed 20 variables that were selected for predicting the possibilities of land-use change for Murrells Inlet (Allen et al., 1999).
A study of the urban planning of Isa town in the Kingdom of Bahrain was conducted and its stages of development since the implementation of the town plan in 1963 until the year 2005was assessed by using GIS techniques. Different multi-temporal datasets consisting of statistical reports, and aerial photography of the study area dated 1951 and three topographic maps (scale 1:10,000) for the years 1977, 1991, and 2005 were used. The methodology of acquisition and review of the datasets was adopted for pre-processing including digitizing of the maps and converting the data using Microstation, Esri and ArcGIS to produce an urban database including land use maps of the study area for three decades. Finally, the produced land use maps were used for analysis of the development of the area and recommendations were proposed for future planning of Isa town (Hayder et al., 2008).
2.1.3 Geographic Information Systems & Remote Sensing Integration: A Taluk in Tamil Nadu, India, was characterized by using RS data to determine land use/land cover (LULC) classes and a combination of RS and GIS data to identify changes in LULC patterns. Both basic data, which included information from IRS satellites, topographic maps, and other ancillary reports, and ground truth data were utilized. The image analysis was performed using ERDAS Image Processing software and a supervised classification change-detection method. LULC classifications were obtained by applying the maximum likelihood algorithm to various defined training areas. Changes in LULC patterns were determined using the ArcView (Geo-processing Extensions) package, which integrated the information. The authors concluded that satellite RS and GIS technologies are valuable techniques for mapping and monitoring LULC and providing consistent and accurate baseline data. (Balakrishnan and Alomary, 2003)
Ait Belaid (2003) analyzed urban-rural land use change using RS and GIS techniques by conducting two multi-temporal studies for two different sites. The main objective was to investigate the effects of the urbanization on agricultural lands in 3 cities in the Kingdom of Morocco (the first study), and in Al-Ahsa Oasis in the Kingdom of Saudi Arabia (second study). The first study was based on 6 panchromatic satellite imagery (2 for each city) acquired by Spot-HRV satellite during two decades, namely 1980 and 1990. The second study concerning Al-Ahsa oasis was based on two multi-spectral satellite imagery of Landsat-TM during two periods of time, namely 1987 and 2001. In the two case studies, topographical maps and current ground observations were also used. Laboratory facilities used in terms of GIS and RS software were Arc Info and ERDAS Imagine.
are valuable tools for the protection of agricultural lands and planning of urban and sub-urban areas located in the oases and coastal fragile cities.
2.1.4 Land Use/ Land Cover Change Detection: The multispectral scanner (MSS) triplicates data in the early 1970s, mid-1980s, and early 1990s collected from every national forest in the United States by the North American Landscape Characterization (NALC) project, a part of the U.S. National Aeronautics and Space Administration’s (NASA) Landsat Pathfinder Program, were used to develop study for a change-detection training course. The study was designed to cover the basic methods and options for developing change-detection maps, and included visual, post-classification comparison, image algebra, principle components analysis, and unsupervised techniques. The study concluded that all of these techniques were useful and important under different circumstances and, therefore, the advantages and disadvantages of each should be considered in the context of one’s research before selecting a specific method (Grey et al., 1998).
A study report provides an overview of the statistical and empirical techniques used in the spatial analysis of LULCC. The analysis of land cover patterns and changes is discussed, as well as changes in land use and farming systems. The main focus of the report is on techniques for data reduction, structure detection and regression analysis. All methods are illustrated with examples. The report concludes that there is no single perfect method of approach for the analysis of land use and land cover change. The selected method should fit the research questions, available data and resources. For a full understanding of the land use change processes at work a combination of methods and approaches might provide most insight, applied to a cohesive theoretical framework. Comparisons and contradictory results should be used to signal weaknesses and demand a re-evaluation of the data and methods of analysis, and perhaps the underlying theory (Lesschen et al., 2005). 2.2 Study Area Characteristics
The Kingdom of Bahrain consists of five Governorates of which Muharraq is the second largest in terms of population density (3813.46 peoples/ km2) and the second in importance after the Capital governorate, according to Land Survey and Registration Bureau. Muharraq Governorate is the study area of the present research (Figure 1).
Located in the north east of the main island; it is connected to the mainland and to the capital Manama by three bridges. Muharraq's importance lies in the fact that it contains the Kingdom's International Airport, an industrial area which is to be 640 Hectares upon completion of the reclamation planned by the Ministry of Industry and one of the biggest ship repair yards in the world, (ASRY) (MOI, 2004).
In the past five decades, the island has been under dramatic and constant changes. In the 1971 census, the Island had an area of 13.9 km2 and a population of 49540 inhabitants with 7256 housing units. By 1981, its area had increased to 17.9 km2, with a population of 68964 inhabitants and 10260 housing units. Ten years later, the census indicated an area of 31.45 km2 and a population of 82855 inhabitants with 13834 housing units. And in 2001, the area was 33.98 km2, the population was 103576 inhabitants and there were 17388 housing units. The most current area estimation of Muharraq Governorate is 51 km2 (Table 1) according to Central Informatics Organization (CIO, 2007).
Figure 1. Location of Study Area (Muharraq Governorate).
Table 1. Muharraq Development (1965 to 2007). 3. METHODOLOGY AND EQUIPEMENT USED
3.1 Methodology Adopted
Bahrain topographic maps are the only systematically collected data resource covering the entire kingdom since the 1950's. These maps are important tools to study and analyse the land cover/land use changes for geographical and environmental studies. Analysing land cover data in a spatially-clear way over longer time periods requires a combination of historical topographic maps, aerial photographs and recent remote sensing imagery.
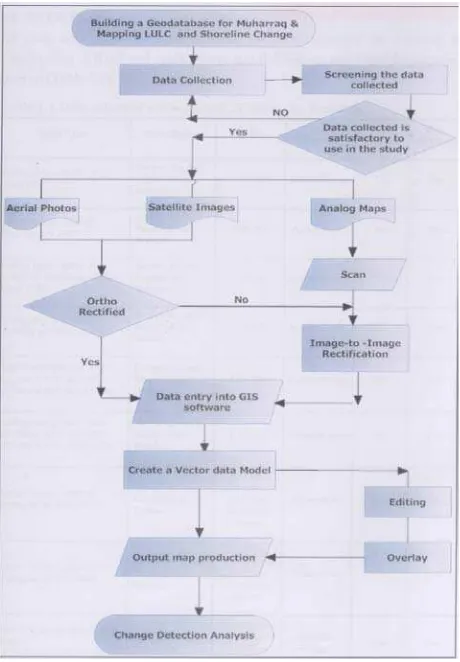
This study will utilize the temporal capabilities of RS data to monitor the land cover/land use changes between 1951 and 2008. The data obtained from satellite images will be integrated with various geo-coded physiographic and socioeconomic data within the framework of a GIS spatial database to analyze the dynamics of urbanization in Muharraq Governorate. The methodology adopted will focus mainly on the following steps (Figure 2):
Year Area (km2)
Population (Inhabitant)
Housing (Unit)
1965 13 46373 6768
1. Collection of available datasets composed of topographic maps, Aerial photographs, Satellite imagery, and statistical data.
2. Satellite image and aerial photographs Registration and/ or Ortho-rectification using topographic (e.g. basic maps) as a reference maps.
3. Classification based on visual interpretation (on screen digitizing) of rectified or registered datasets (topographic maps, aerial photographs and satellite imagery).
4. Land use/ land cover change detection was performed by differencing of produced maps earlier.
5. Evolution of shorelines of Muharraq was also studied for the same period of time on the coastline of the island.
Figure 2. Methodological Framework Including Data Input, Processing & Output 3.2 Data-Sets Used
RS and GIS data were collected from different agencies e.g. Ministry of Housing, Municipalities and Environment (MOMH, 2001), and Land Survey and Registration Bureau (LSRB, 2007) and the Arabian Gulf University (AGU). It was then scrutinized and screened in order to be used in the study so far as presented in the table 2 below.
Geo-referencing or Geo-coding (Geo) means geometric correction, while Ortho-rectification (Ortho) means advanced geometric correction using Digital Elevation Model (DEM). The Geo-referencing parameters used for this study are the following: World Geodetic System (WGS84) as Geodetic Datum, and Universal Transverse Mercator (UTM, Zone 39) as
Map Projection System. Ground Spatial Resolution (GSR) means the smallest area that can be detected in remote sensing (e.g. Pixel), we can also call it Pixel size.
Table 2. Data Sets Used in the Research Study
3.3 Software Used
Topographic maps, Aerial Photographs, and satellite imagery must undergo several pre-processing steps prior to be used in land use /land cover change detection, mapping, and analyzing. These datasets will be utilized and processed using the following software provided by the Arabian Gulf University:
a) Earth Resources Data Analysis System (ERDAS Imagine ver.9) software (ERDAS, 1999) is used to import Generic Binary data, display image, and perform geometric correction, and image conversion and analysis.
b) ArcView and ArcGis (ver. 9.3) software (ArcGIS, 2008) with the Spatial Analyst, IMAGINE Image support and Geo-processing extensions were used to view raster and vector data, polygon Overlay, Prepare, edit and geocode descriptive information, topology building, and calculate change detection. c) Microsoft Office Access 2007, Ms Word Office 2007
and Power Point Office 2007, owned by the researcher, will serve as the main database, word processing and presentation programs.
4. LAND USE/COVER MAPPING (RESULTS OUTPUT)
4.1 Land Use/Cover Mapping
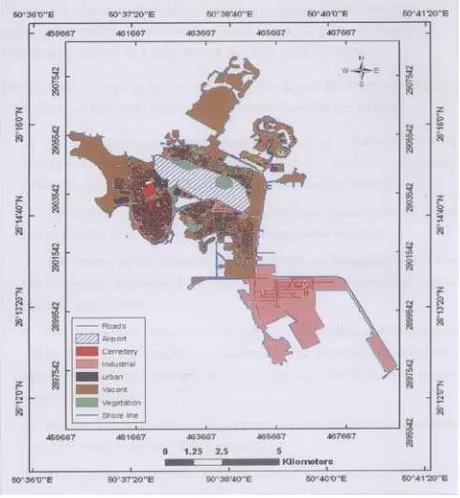
After studying and assessing the images of Muharraq during the period 1951-2008, and based on visual interpretation of datasets including topographic maps, aerial photographs and satellite imagery, land use/ cover categories were divided into seven (7) feature classes. Land use /cover that were noted to be preponderant in Muharraq Island, or city or Governorate were as follow: Roads which is represented by (Label 1) in table 3 and table 4, Airport (Label 2), Cemetery (Label 3), Industrial (Label 4), Vacant (Label 5), Urban (Label 6) and finally Vegetation (Label 7). A spatial geo-database was created in ArcCatalogue for each year of the study, containing all types of layers: shape file, text file related to that year (Table 3).
Data Type Source Scale Format Geo Ortho
Table 3. Land Use/ Land Cover Statistics (1951 to 2008) The area is given in square kilometer, for each class category and each period of time. In total, there are seven classes and eight period of time.
4.2 Land Use/Cover Change Detection
Land use/ land cover changes were determined by differencing between subsequent periods of time, separated by eight years intervals in average. We realized that the changes for the periods of 1951, 1961 and 1970 were minimal. The starting point for change detection was 1951-1970. Furthermore, the changes were calculated for the following periods: 1951-1977, 1977-1985, 1994-1985, 2001-1994, 2001-2008 and finally the last column gives the total changes from 1951 to 2008 (Table 4). Figure 3 below gives Muharraq Area Growth for eight periods of time (e.g. from 1951 to 2008).
Figure 3. Muharraq Area Growth (1951 to 2008)
No 77-51 85-77 94-85 01-94 08-01 08-51
1 0.58 0.96 0.81 0.86 2.13 5.34 2 2.86 0.16 0.15 0.41 0.03 3.61
3 0.1 0 0 0 0 0.1
4 0.95 1.64 0.05 4.49 7.01 14.14 5 1.09 1.95 1.46 0.52 2.38 7.4 6 -1.32 -1.84 1.39 3.8 10.36 12.39 7 1 0.08 0.16 -0.28 0.53 1.49
Table 4. Land Use/ Land Cover Changes (1951 to 2008) 4.3 Shoreline Change and Evolution
The Shorelines of the Kingdom of Bahrain was drawn on the topographic map as the Average High Water Mark (AHWM) by the Survey and Land registration bureau and it was identified on the existing topographic maps of the years 1951, 1977, 1985 and 1994. It was determined by interpretation of aerial photographs for 1961 and 2001 and finally for satellite imagery for 2008. The length of the shoreline has increased successively from 35 km in 1951, 50 km in 1977, and 166 km in 2008. The table 5gives the length and the corresponding area of the shoreline (Coastline) from 1951 to 2008.
Cost 51 61 70 77 85 94 01 08
Length 35 35 37 50 62 69 101 166 Area 13 14 14 18 20 25 35 54
Table 5. Muharraq Coastline Evolution (Length & Area). 4.4 Road Network Assessment
The only existing road in 1951 was the highway connecting the swing bridge from Manama to Hidd, total length of 11.5 km. In 1961, construction of the airport ring road, totalizing a length of 21 km. In 1971, construction of old Muharraq Road, totalizing a length of 37 km. In 1977, construction of old town of Muharraq, Dair Samaheej and Galili road network, totalizing 107 km. In 1985, construction of new roads for the new reclaimed areas, in addition to Arad and Hidd, totalizing a length 152 km. In 1994, the length of road network was 172 km. In 2001, north of Busaiteen got equipped by roads, totalizing 318 km. In 2008, the length of road network becomes 451 km. The road network represents 0.57% of the total area of Muharraq Island in 1951 and has increased to 9.53% in 2008. Figure 4 represents Muharraq land use/ land cover for the year 2008, and illustrates also partially the road networks.
4.5 Estimation of Accuracy of Land Use/ Cover Maps The accuracy of the total LULC maps assessed and calculated within this study was compared to the total area evaluated for each year separately and a standard deviation was estimated by the comparison of the two figures from existing data and produced in the present study, in terms of total area of the study trough the whole period from 1951 to 2008.
The differences in the values are due to the error the interpretation of the boundaries between different land use/cover maps and the complexity to differentiate between land cover categories some times. The standard deviation ranges from -4.80% (in the year 1961) to +6.13% (in the year 2008) and the total mean is estimated at 3.33%. The 6%
No 51 61 70 77 85 94 01 08
standard deviation in 2008 is due primarily to estimate of roads buffering.
Figure 4. Muharraq Land Use/ Land Cover Map (2008). 5. CONCLUSIONS AND RECOMMENDATIONS
5.1 Conclusions
The LULC maps were produced properly for eight successive periods of times and for seven class categories, including 2008 and back to 1951.
1. The LULC Changes were also produced by the comparison of the previous documents/products. 2. generally, Muharraq island/city development has
been studies along with the development of its shoreline/coastline.
3. The LULCC in Muharraq were governed by geographical and socio-economical conditions, such as population growth, government development policies, and economic development.
4. The population’s growth was the major dominant factor driving urbanization in Muharraq, while the improvement of road network also played an important role in promoting the urban development. 5. With the government’s economic diversification
policy in the 70s, the new land classification, the industrial area was added to the LULC classification in Muharraq.
6. The uniqueness of the shallow waters around the island made it economically viable to reclaim land for the new developments especially the industrial area, thus changing the shoreline all around the island. 5.2 Recommendations
1. Developing an up-to-date Geospatial Database (Or Urban GIS) for Muharraq including existing datasets
in various Ministries and department in Bahrain, for urban planning and monitoring of the city.
2. This will provide a framework to the decision makers (e.g. municipalities) to develop an action plan for better management of the existing infrastructures and facilities.
3. The Dramatic changes and development of the shoreline during the investigated period of time (e.g. 47 years) is due mainly to dredging and land reclamation on the coastal zones. This will have a negative impact of course on marine and coastal biodiversity.
4. Possibility to allocate at least one beach free for the public usage equipped with recreation and sport facilities.
6. REFERENCES
Ait Belaid, M., 2006. Remote Sensing of Desert Cities and Urbanization Management in West Asia Region. Map Middle East 2006, March 26-29, Dubai, United Arab Emirates. Aït Belaïd, M., 2003. Urban-Rural Land Use Change Detection and Analysis Using GIS and RS Technologies. 2nd International Federation of Surveyors (FIG) Regional Conference, 2-5 December, Marrakech, Morocco.
Allen, J.S., Lu, K.S., Costa, and Potts, T.D., 1999. A GIS-Based Analysis and Prediction of Parcel Land-Use Change in a Coastal Tourism Destination Area. In: The World Congress on Coastal and Marine Tourism, Vancouver, British Columbia, Canada.
ArcGIS, 2008. Getting to know ArcGIS Desktop. 2nd Edition, updated for ArcGIS 9.3, Environmental Systems Research Institute (ESRI) Press, Redland, California, USA.
Balakrishnan, P., and Alomary, A.Y., 2004. Detection of land use: land cover changes using remote sensing and GIS techniques and its application to monitoring Pudukkottai Taluk area. Jordan Journal of Applied Science, Natural Sciences, 6(2), pp. 8–31.
Ben-Hamouche, M., 2004. GIS, Remote Sensing and Urban History, Analyzing Muharraq City Development. In: The Third International Conference & Exhibition (GIS 2004), 27-29 September, Bahrain.
Choudhury, P., 2004. Land use/ land cover mapping in Bahrain using Landsat-TM data. In: The Third International Conference & Exhibition (GIS 2004), 27-29 September, Kingdom of Bahrain.
CIO, 2009. Chapter 19, Environment. the Statistics Group 2007, Central Informatics Organization, Kingdom of Bahrain. ERDAS, 1999. Field Guide. 5th Edition, Earth Resources Data Analysis System (ERDAS), Inc, Atlanta, Georgia, USA. Faour, G. and Bou Kheir, R., 2006. Effectiveness of using very high resolution imagery (IKONOS) for land use mapping.
GEOMATEC, 2009. Marine Atlas of Bahrain. Bahrain Center for Studies and Research (BCSR), Manama, Bahrain.
forest planning context. In: Integrated Tools, Boise, USA, August 16–20.
Haider, L., Ait Belaid, M. and Khalil, A., 2008. Analysis of Urban Planning in Isa Town Using GIS Techniques. International Archives of Photogrammetry, Remote Sensing and Spatial Information Sciences, 37(B8), ISPRS 21st
Congress, July 3-11, Beijing, China.
Lesschen, J.P., Verburg, P.H., and Staal, S.J., 2005. Statistical methods for analyzing the spatial dimension of changes in land use and farming systems. LULCC Report Series No. 7. Published by The International Livestock Research Institute, Nairobi, Kenya & LUCC Focus 3 Office, Wageningen University, the Netherlands.
LSRB, 2007. Provider of Topographic Maps and Aerial Photographs, Land Survey and Registration Bureau (LSRB), Bahrain.
MOHME, 2001. Bahrain Report 2001 for Istanbul +5. Ministry of Housing, Municipalities and Environment, February. MOI, 2004. Industrial Facts & Opportunities. Ministry of Industry, Kingdom of Bahrain, June 15-17.
Phalke, S., 2005. Change Detection of Man-Made Objects Using Very High Resolution Images. M.Sc. Thesis, University of Calgary, California, USA.
ROPME, 2004. State of the Marine Environment Report. 2003, Regional Organization for the Protection of Marine Environment (ROPME), Kuwait.