VALIDATION OF POINT CLOUDS SEGMENTATION ALGORITHMS
THROUGH THEIR APPLICATION TO SEVERAL CASE STUDIES
FOR INDOOR BUILDING MODELLING
H. Macher a, *, T. Landes a, P. Grussenmeyer a a
Photogrammetry and Geomatics Group, ICube Laboratory UMR 7357, INSA Strasbourg, France (helene.macher, tania.landes, pierre.grussenmeyer)@insa-strasbourg.fr
Commission V, WG V/4
KEY WORDS: 3D modelling, laser scanning, indoor point clouds, space segmentation, building elements, datasets
ABSTRACT:
Laser scanners are widely used for the modelling of existing buildings and particularly in the creation process of as-built BIM (Building Information Modelling). However, the generation of as-built BIM from point clouds involves mainly manual steps and it is consequently time consuming and error-prone. Along the path to automation, a three steps segmentation approach has been developed. This approach is composed of two phases: a segmentation into sub-spaces namely floors and rooms and a plane segmentation combined with the identification of building elements.
In order to assess and validate the developed approach, different case studies are considered. Indeed, it is essential to apply algorithms to several datasets and not to develop algorithms with a unique dataset which could influence the development with its particularities. Indoor point clouds of different types of buildings will be used as input for the developed algorithms, going from an individual house of almost one hundred square meters to larger buildings of several thousand square meters. Datasets provide various space configurations and present numerous different occluding objects as for example desks, computer equipments, home furnishings and even wine barrels. For each dataset, the results will be illustrated. The analysis of the results will provide an insight into the transferability of the developed approach for the indoor modelling of several types of buildings.
* Corresponding author
1. INTRODUCTION
The modelling of indoor areas is a huge issue since the emergence of Building Information Modelling (BIM) and its numerous benefits notably for restoration, documentation and maintenance of buildings. Lasers scanners are widely used to collect information about the as-is conditions of existing buildings. They allow fast acquisitions and provide a very high level of details through point clouds representation. The acquired point clouds are then used as input data in a scan-to-BIM process. The modelling of indoor areas from point clouds is unfortunately largely a manual process and it is thus time consuming and error-prone.
Along the path to automation, different approaches are developed. Considering indoor areas, several works deal with sub-space segmentation of point clouds. Ochmann et al. (2015) perform a room segmentation using the given initial assignment of points to scanners. The identification of 3D spaces can also be achieved thanks to a shape grammar (Khoshelham and Díaz-Vilariño, 2014). Instead of a sub-space segmentation, some works directly consider a segmentation into planes of indoor point clouds (Jung et al., 2014, Thomson and Boehm, 2015, Xiong et al., 2013).
A plane segmentation is commonly combined with the identification of structural elements of the indoor environment. Indeed, as highlighted by Tang et al. (2010), a core task of as-built BIM construction is the labelling of extracted geometric primitives into several classes. This classification often uses the
context or prior knowledge. Nüchter and Hertzberg (2008) establish for example a constraint network for coarse scene interpretation.
In this paper, the approach for indoor building modelling developed by Macher et al. (2015) will be considered. It has been slightly modified and completed. Thus the full description of the approach is first proposed. Then, the different categories of thresholds involved in this approach are listed. After presenting datasets and items for the approach validation, results obtained with several datasets with the described algorithms are presented and analysed by following these validation items.
2. FULL DESCRIPTION OF THE APPROACH
2.1 Workable datasets
The French real-estate patrimony is rich and presents a lot of different buildings with their own specificities. Hence, the developed approach might not work for all buildings. It is thus important to define what type of buildings can be considered and what a workable dataset is.
The developed approach deals with buildings presenting regular shapes and composed mostly of planes. It doesn’t concern historical buildings but rather classical buildings such as individual houses or public buildings defined by floors and
rooms. Additionally, ceilings and floors are supposed to be flat and thus the modelling of sloped roofs is not yet considered.
The effectiveness of the approach is also strongly linked to the acquisition protocol used with the terrestrial laser scanner. A minimum of one point per centimetre is required by the approach. Moreover, a scan has to be performed whenever the ceiling height changes. It shall also be ensured that the ceilings are not occluded at the scanner point of views since the approach largely exploits point clouds at ceiling levels.
2.2 Overview of the approach
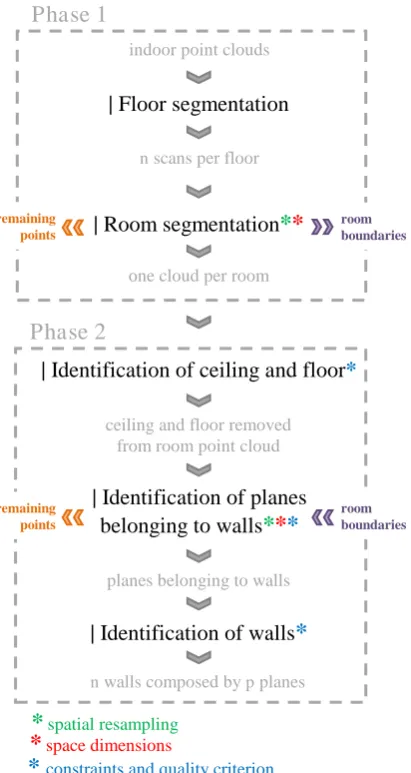
The approach is composed of two main phases as depicted in the organisation chart Figure 1. First, a segmentation into sub-spaces is performed. This phase allows to segment indoor point clouds of the considered building into floors and rooms.
The second phase consists in a plane segmentation combined with the identification of building elements. Following this phase, planes corresponding to ceilings and floors, and planes belonging to walls are extracted. Then walls are identified.
These two phases are detailed hereafter and illustrated with point clouds of an individual house presented in Figure 7a.
Figure 1. Organisation chart of the developed approach
2.3 Phase 1: Segmentation into sub-spaces
The data considered as input of the algorithms are indoor point clouds of a minimal density of 1 cm. Every individual scan performed in the studied building is available. In order to save time during the process, point clouds are rotated to follow the orientation of one of the major façade plane obtained using a Principal Component Analysis (PCA). Moreover, a global shift to a local coordinate system is temporarily performed so that the original precision will be kept.
2.3.1 Floor segmentation: Floor segmentation is first performed. It consists in generating the histogram of each scan point cloud along Z axis. Based on this histogram, the ground and ceiling altitude of a scan point cloud can be determined by detecting peaks which correspond to the main horizontal elements of the acquired scene. Once a ground floor is determined for each scan point cloud, scans are grouped into several clusters corresponding to the different floors. A cluster corresponds to scans presenting equivalent ground levels. A floor is thus composed of n point clouds acquired from n projected in an horizontal plane, a binary image is generated. A pixel is coloured in white if it contains at least one point.
The choice of the image pixel size is induced by the thinnest wall that can be encountered. A size of 3 cm was chosen. This explains the minimal density of 1 cm required by the approach. Indeed, with a spatial resampling of 1 cm and a pixel size of 3
cm, the obtained binary image doesn’t contain “holes”. At the same time thin walls don’t disappear. A higher point density can obviously be considered.
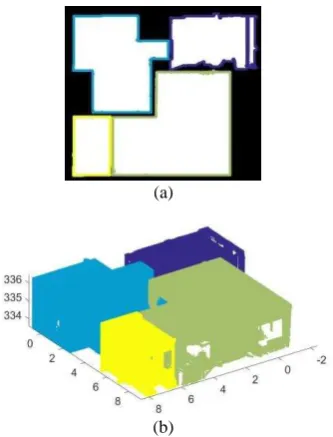
During the creation of the binary image, the standard deviation of points along Z axis is also calculated for each pixel. The room point clouds are clearly identified (Figure 2b).
During room segmentation, 2D regions which are considered as too small are removed. They can correspond to noise or parts of the building outdoor. In the same way, a filter is considered for 3D regions. It includes the minimum number of points of the 3D region but also the minimum height of the 3D region.
Regarding the French “Carrez” law, a height of 1.80 meters was
chosen. At the end of the sub-space segmentation,
non-| Identification of ceiling and floor
*
remaining
n walls composed by p planes
| Room segmentation
*
*
(a)
(b)
Figure 2. Room segmentation – First floor of the house: (a) Binary image with boundaries of detected 2D regions;
(b) Corresponding 3D regions (one colour per room)
2.4 Phase 2: Segmentation into planes and building elements identification
The second phase consists in several plane segmentations and in the identification of building elements namely ceilings, floors and walls. The segmentation into planes is performed thanks to a robust estimator MLESAC. As explain by Torr and Zisserman (2000), it uses the same sampling principle as RANSAC but the retained solution maximizes the likelihood rather than just the number of inliers. Thus the distribution of points according to planes is considered. MLESAC requires as input the maximum distance between inliers and the fitted plane. This value has to be defined by the modeller depending on the required quality.
2.4.1 Identification of ceiling and floor: For each room point cloud, planes corresponding to ceiling and floor are first extracted. A horizontal constraint is considered. It is defined as a maximum angular value between the normal of the extracted plane and the reference vector.
The altitudes of ceilings and floors allow obtaining the ceiling heights of rooms. The extracted planes are stored and removed from the room point clouds.
2.4.2 Identification of planes belonging to walls: Then, points belonging to walls are identified thanks to the boundaries obtained in the room segmentation step. Figure 3 presents an example of point classification of a living room. It shows that this step allows to remove points of occluding objects (tables,
sofas, chandeliers, curtains…).
Once points belonging to walls are identified, planes belonging to walls are extracted using MLESAC. Lines are first extracted in a slice of room point cloud at ceiling level projected in a horizontal plane. Then, corresponding planes are determined.
Figure 3. Classification of points belonging to walls (in green) and points belonging to occluding objects (in red)
A verticality criterion is used for plane segmentation by considering a maximum angular value between the normal of the extracted plane and the vertical. Moreover, the root mean square error (RMSE) of the distance of inlier points to the model is used so that the planes which have a too high RMSE are discarded.This allows for example to eliminate planes fitted on misclassified object points.
Given our processing chain, the probability that first segmentation extracts small planes is low. Therefore several iterations are performed. The number of iterations is automatically adapted to each room. For this purpose, both the percentage and number of remaining points in the slice of points are considered. A slice of points is taken into account in order to better estimate the number of points. Indeed, at ceiling level there are very few occluding objects and consequently very few occlusions in the point cloud.
Similarly to the previous phase, some points are remaining. They can either be points belonging to occluding objects, or points belonging to walls which were not segmented. Two remaining point clouds are thus stored.
Based on the wall planes extracted for one floor, it is already possible to automatically generate a 2D floor plan as illustrated Figure 4. In order to do that, the intersection of the extracted vertical planes with a horizontal plane is determined. The ceiling heights of rooms are calculated based on identified ceilings and floors. One should note that to obtain a proper 2D map, lines still have to be intersected.
Figure 4. Automatically generated 2D floor map with ceiling heights in meters – First floor of the house
2.4.3 Identification of walls: Finally, detected vertical planes belonging to walls are grouped into walls thanks to a criterion of distance and a criterion of parallelism. The walls identified for the room point clouds shown in Figure 2b are presented in Figure 5 in a perspective view and a zoomed top view. A wall is composed of p parallel planes. The main façade walls can be identified by considering the edges of the floor point cloud. They are represented in grey in Figure 5.
Figure 5. Identification of walls – First floor of the house (façade walls in grey, one colour per indoor wall)
3. REVIEW OF INVOLVED THRESHOLDS
The developed approach involves several thresholds. These thresholds can be categorized into the following categories:
*
Thresholds related to spatial resampling of point clouds*
Thresholds related to space dimensions*
Thresholds related to constraints and quality criteriaEach category of thresholds is associated to several steps of the approach as depicted in Figure 1. Some thresholds are also a combination of categories. It is especially the case for space dimensions and the spatial resampling. For example, the number of points of the smallest 3D region to keep is both related to space dimensions and to spatial resampling.
A part of the thresholds are defined manually. Thresholds related to constraints and quality criteria can’t be automated since they have to be defined regarding the specifications. However default values are proposed to the user. It notably deals with thresholds involved in plane segmentation: the maximum distance between a plane and its inliers, the horizontal and vertical constraints and the threshold related to the RMSE of planes.
Other thresholds defined manually are intended to be applied to buildings in general as for example the smallest volume or the smallest plane which have to be taken into account. Default values of those thresholds are also proposed and should be adapted to several datasets coming from various buildings.
Finally, some thresholds are defined automatically by considering all information given by the user. That is for example the case when the minimum number of points of a 3D region is determined. Considering a minimum volume of 1.8 cubic meters (1 meter by 1.8 meters height) and a spatial resampling of 1 centimetre, the smallest 3D region would count 92 000 points.
A synthesis of the main thresholds encountered in the developed approach is proposed hereafter in Table 6. Some of default values of those thresholds are also indicated.
* Spatial resampling
removal in binary image 1 square meter (~1100 pixels)
** Spatial resampling and spaces dimensions
Filter for 3D regions removal
minimal height of 1.8 meters (French "Carrez" law)
1.8 cubic meters (92 000 points for a spatial resampling of 1 cm)
Minimal number of points of a plane
1800 for a spatial resampling of 1 cm (10 cm x 1.80 m)
Conditions to perform an additional iteration for wall planes detection
number of remaining points: > 5% of initial point cloud OR
> 400 for a spatial resampling of 1 cm (20 cm x 20 cm)
the last iteration must have extracted at least one plane
of 1800 points minimum
* Constraints and quality criteria
Maximum distance between inliers and plane
2 cm for ceilings and floors 5 cm for walls
Table 6. Main thresholds involved in the developed approach and some default values
The approach was developed so that it can be adapted to several cases. The aim of this paper is to apply the same thresholds to several datasets of various buildings. This will allow to conclude about the generalisation of the use of thresholds defined manually but also about the adaptation of thresholds established automatically. In this way, the transferability of the approach is investigated. The two following sections describe the methodology and the results of transferability analysis.
4. TRANSFERABILITY ANALYSIS
4.1 Datasets used for transferability analysis
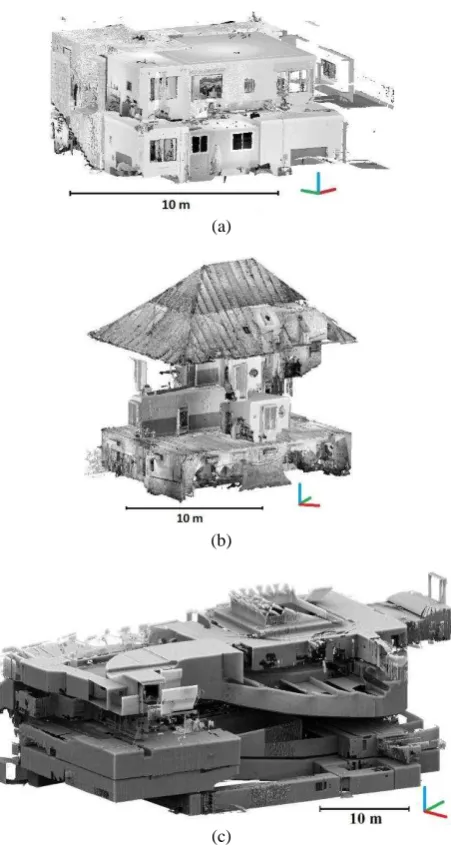
In order to analyse the transferability of the described approach, three datasets, which were not used for the development of the approach, are considered (Figure 7). These datasets were provided by French Land Surveyors Offices and consist in indoor point clouds. These point clouds were spatially resampled at 1 cm in order to save time while respecting the minimum density required by the approach.
(a)
(b)
(c)
Figure 7. Indoor point clouds spatially resampled at 1 cm: (a) individual house No.1 (~10M points); (b) individual house
No.2 (~34M points); (c) Haussmann building (~60M points)
The first dataset (Figure 7a) is an individual house located in South of France composed of two floors (a garden level and a first floor). 17 scans were performed inside the house which represents about 10M points with a resampling of 1 cm.
The second dataset (Figure 7b) is also an individual house where 40 scans were performed inside (about 34M points after resampling). This house is composed by five floors: a basement
level, a ground floor, a first floor, an attic and an upper attic with wooden frames. One should note that the attic and the upper attic will not be modelled because roofs are sloped.
Finally, the third dataset (Figure 7c) deals with the ground floor and four basement levels of a Haussmann building located in Paris. The dataset contains 43 scans representing about 60M points.
The two individual houses are composed of rooms of equivalent areas and present a lot of occluding objects that are household furniture. The Haussmann building, for its part, is composed by large spaces with fewer occluding objects. It should also be noted that some parts of the second individual house and the Haussmann building were not scanned but rather completed with existing floor planes or other measurements.
4.2 Validation items
In order to analyse the transferability of the described approach, validation items have to be clearly defined. The algorithms were applied to the three datasets with the default threshold values defined in Table 6. Results will be analysed following the validation items described below.
The first validation item concerns the segmentation into sub-spaces. The results of the first phase of the described approach will be analysed by verifying that sub-spaces of buildings are correctly identified. Moreover, the remaining point cloud will be examined.
Secondly, at room point clouds level, the classification of points into several semantical classes, namely ceilings and floors, walls and occluding objects will be studied. Based on reference point clouds segmented manually, the percentage of correctly assigned points (true positives) and the percentage of incorrectly rejected points (false negatives) will be determined for each class.
Finally, the results of wall plane segmentation will be studied notably by examining the remaining wall points. Thus, it will be possible to evaluate if the number of iterations defined automatically during the process is well established or not. Additionally, regarding the results of wall identification, the completeness of the modelling will be investigated.
5. RESULTS OF VALIDATION ITEMS INSPECTION
5.1 Results of sub-spaces segmentation
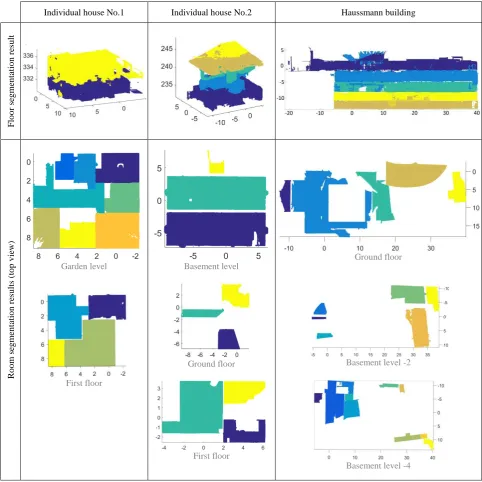
The results of floor and room segmentations are presented Table 8 where one colour corresponds to one detected sub-space. Regarding floor segmentation, it can be observed that the different floors are correctly detected for all datasets.
The room segmentation looks also promising since the 3D regions, which describe rooms, are dissociated from each others. None of the rooms was falsely fused with another. One can note that some parts of the detected room point clouds are missing. This can be due to the fact that some parts of ceilings were occluded or that the room was only partially acquired. This can also appear when the density of points is not high enough, which is particularly the case for the third dataset where large spaces are encountered.
Individual house No.1 Individual house No.2 Haussmann building
F
lo
o
r
se
g
m
en
ta
tio
n
re
su
lt
Ro
o
m
se
g
m
en
tatio
n
re
su
lt
s
(to
p
v
iew
)
Garden level
First floor
Basement level
Ground floor
First floor
Ground floor
Basement level -2
Basement level -4
Table 8. Results of floor and room segmentation for the three different datasets
Some rooms are missing because they were not considered during the acquisition of the datasets, i.e. there are no ceiling points of these rooms in the point clouds. It deals with small rooms which were measured by another technique.
5.2 Classification of points into several categories
During the second phase of the approach, the points composing each room are classified as ceilings and floors, walls or occluding objects.
One floor point cloud of each dataset was considered to investigate if the classification works well. Reference point clouds were segmented manually so that true positives and false
negatives can be determined for each class. The results of this analysis are presented in Table 9.
The classification obtained for the garden level of the individual house No.1 is very good because a high percentage of true positives is combined with a low percentage of false negatives for all the classes.
For the two other floors, the percentages of true positives are also very satisfying for ceilings, floors and walls. However, the percentage of true positives associated to the occluding objects class is less satisfying. Consequently the percentages of false negatives are higher than for the floor of the individual house No.1. In the case of the individual house No.2, this is due to the fact that the basement level point cloud is composed, for more
than a third, of occluding objects. Moreover, wall points are very scattered. Finally, the manual segmentation didn’t allow to separate the ceiling from the wooden beams as done by the automatic segmentation.
Ceilings and floors Walls
Occluding objects
Individual house No.1 - Garden level
TP 98% 95% 98%
FN 1% 3% 8%
Individual house No.2 - Basement level
TP 99% 93% 66%
FN 31% 29% 7%
Haussmann building - Ground floor
TP 99% 96% 35%
FN 20% 20% 18%
Table 9. Results of the classification of points into several classes
5.3 Plane segmentation and wall identification
The last step of the developed approach is the plane segmentation of points belonging to walls and the identification of walls.
The number of iterations for wall plane segmentation is established automatically so that all the wall planes can be identified. The point clouds remaining from the wall plane segmentations applied to the three previously mentioned floors were analysed to validate this point. For all datasets the remaining point clouds represent only a few percent of the number of points classified as walls. Moreover, among the remaining point, almost fifty percent belong to occluding objects class in reality. That means that constraints applied for wall plane detection allow to reject parts of the objects points.
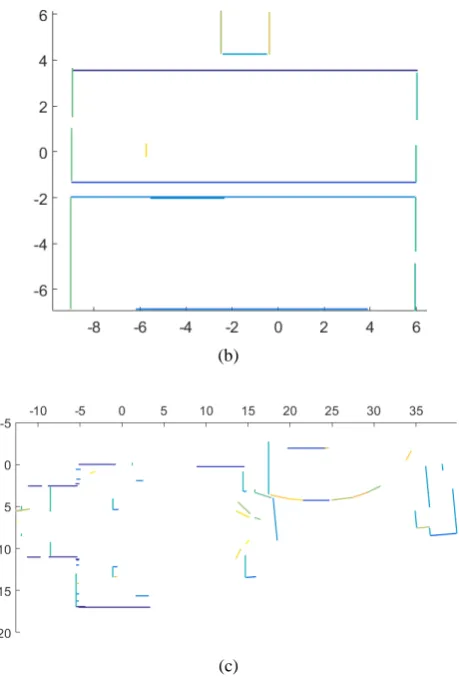
The results of wall identification for the three floors investigated in Table 9 are presented Figure 10 in form of 2D planes where one colour corresponds to one wall. Almost every wall was identified despite the fact that, as shown Table 9, some points belonging to walls were incorrectly rejected for some datasets.
(a)
(b)
(c)
Figure 10. Identification of walls – 2D planes generated: (a) individual house No.1 – garden level; (b) individual house No.2 – basement level; (c) Haussmann building – ground floor
6. FUTURE WORKS
In future works, the automatic identification of openings will be studied in different ways. The radiometric information of point clouds namely colour and intensity will be considered for this task. Moreover, 3D object recognition algorithms will be tested in order to find automatically different types of openings in point clouds.
Once all elements of a building will be identified, a reconstruction phase will be developed. This will consist in the calculation of intersection of walls. Moreover, some constraints will be applied to the detected elements as for example a verticality constraint for walls. The elements thus reconstructed will be then translated into the IFC (Industry Foundation Classes) format which is an object-based file format used in the AEC (Architecture, Engineering and Construction) industry.
Quality criteria are already integrated in the approach as shown in this article. However, the quality of the final model, which will be reconstructed, needs to be assessed and this will be the object of another future work.
7. CONCLUSION
In this paper, a full description of a point clouds segmentation approach has been presented. This approach considered indoor point clouds and is composed of two phases. First sub-spaces, namely floors and rooms, are segmented. Then, several plane segmentations are combined with the identification of elements so that planes corresponding to ceilings, floors and walls are identified.
The approach involves several thresholds either manually or automatically defined. They are related to spatial resampling, space dimensions but also constraints and quality criteria. The same thresholds are intended to be applicable to different datasets. In order to validate this assumption and thus conclude about the transferability of the developed approach, three buildings presenting different space configurations were considered. The algorithms were applied to the indoor point clouds of those buildings.
The results look promising. Indeed, first, the sub-spaces are correctly detected. Then, the classification of points into several categories shows that points classified as ceilings and floors and walls present a high percentage of true positives. Then, adaptation of the number of iterations for wall plane segmentation was validated by considering the remaining point cloud. Finally, despite some false negatives of points belonging to walls, almost all the walls were identified for all datasets.
In the future, the automatic identification of openings will be studied and the reconstruction of the building will be performed by considering wall intersections and constraints application. The obtained elements will then be translated into the IFC format. Finally, the quality of the whole reconstructed 3D model will be assessed.
ACKNOWLEDGEMENTS
The authors want to thank for their support the French College of Chartered Surveyors (Ordre des Géomètres-Experts). They also want to thank the French Land Surveyors Offices Pierre BLOY (Paris), David PIERROT (Mandelieu) and SCHALLER-ROTH-SIMLER (Sélestat) who provided the datasets used for transferability analysis.
REFERENCES
Jung J., Hong, S., Jeong, S., Kim, S., Cho, H., Hong, S. and Heo, J., 2014. Productive modeling for development of as-built BIM of existing indoor structures. Automation in Construction, 42, pp. 68-77.
Khoshelham, K. and Díaz-Vilariño, L., 2014. 3D modelling of interior spaces: Learning the language of indoor architecture, In: International Archives of the Photogrammetry, Remote Sensing and Spatial Information Sciences, Riva del Garda, Italy, Vol. XL-5, pp.321-326.
Macher, H., Landes, T., and Grussenmeyer, P., 2015. Point clouds segmentation as base for as-built BIM creation, In: The International Annals of the Photogrammetry, Remote Sensing and Spatial Information Sciences, Taipei, Taiwan, Vol. II-5/W3, pp. 191-197.
Nüchter, A., and Hertzberg, J., 2008. Towards semantic maps for mobile robots. Robotics and Autonomous Systems, 56(11), pp. 915-926.
Ochmann, S., Vock, R., Wessel, R., Tamke, M., and Klein, R., 2014. Automatic generation of structural building descriptions from 3d point cloud scans. In: Proceedings of the 9th International Conference on Computer Graphics Theory and Applications, Lisbon, Portugal, pp. 1-8.
Tang, P., Huber, D., Akinci, B., Lipman, R., and Lytle, A., 2010. Automatic reconstruction of as-built building information models from laser-scanned point clouds: A review of related techniques. Automation in Construction, 19(7), pp. 829-843.
Thomson C. and Boehm J., 2015. Automatic geometry generation from point clouds for BIM, Remote Sensing, 7(9), pp. 11753-11775.
Torr, P. H., and Zisserman, A., 2000. MLESAC: A new robust estimator with application to estimating image geometry. Computer Vision and Image Understanding, 78(1), pp. 138-156.
Xiong, X., Adan, A., Akinci, B., and Huber, D, 2013. Automatic creation of semantically rich 3D building models from laser scanner data. Automation in Construction, 31, pp. 325-337.