CHAPTER IV
RESULT AND DISCUSSION
A. General Description of the Research Place 1. Brief Profile of MTs N 2 Bandar Lampung
MTsN 2 Bandar Lampung was built in 1978. At the time it is still riding in the building of state Religious Teacher Education (PGAN) Tanjung Karang, Lampung, and in the academic year of 1985/1986 officially moved and occupies its own building on an area of 20.000 m2(2 hectares). Building of MTs N 2 Bandar Lampung is located at Jl. Pulau Pisang No.20 Village Korpri Raya Subdistrict Sukarame Bandar Lampung Phone (0721) 780 135. The principal of MTs N 2 Bandar Lampung has been changed for eight times. The following are the name of the principals of MTs N 2 Bandar Lampung:
1. Khusairi M, BA (1978-1984) 2. Sumardi Alwi, BA (1984-1989) 3. Madin, BA (1989-1995)
4. Drs. M. Nadjmi (1995-2001) 5. Drs. Sartio (2001-2003) 6. Drs. Jamsari (2003-2005)
7. Drs. H. Ridwan Hawari, MM (2005-2015) 8. H. Nurhadi, S.Ag. M.Pd.I (2015-now)
32 classrooms consist of the twelve classes for seventh grade student, ten classes for eighth grade students and ten classes for ninth grade students. The total number of the teacher is 88 teacher, and the total number of the students are 1,184 students.
There were several rooms functioning as the office in the school. The office rooms were headmaster office, teacher office, and administration office. Then, it was
completed by OSIS’s room and UKS’s room. This school also has a library, a
computer laboratory, a language laboratory, a science laboratory, a science laboratory, a mosque and 25 toilets. For sport facilities, the school was provided with a football, volley, footsal, table tennis and broad jump court. The court also functioned as the field flag-raising ceremony which was held every Monday morning.
2. Condition of Teachers and Students of MTs N 2 Bandar Lampung
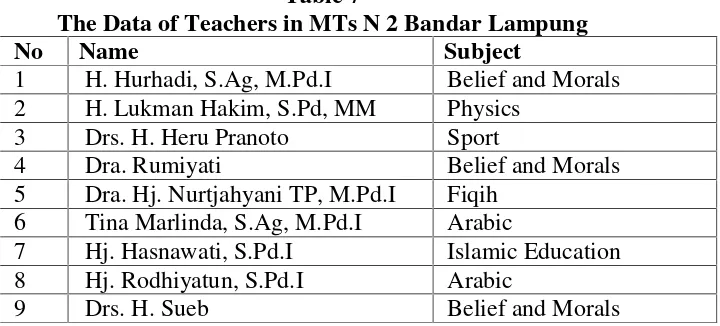
MTs N 2 Bandar Lampung had 88 teachers including 24 male teachers and 64 female teachers. All the teachers were graduated from bachelor degree. The data about number of the teachers of MTs N 2 Bandar Lampung can be seen in Table 7:
Table 7
The Data of Teachers in MTs N 2 Bandar Lampung
No Name Subject
1 H. Hurhadi, S.Ag, M.Pd.I Belief and Morals 2 H. Lukman Hakim, S.Pd, MM Physics
3 Drs. H. Heru Pranoto Sport
4 Dra. Rumiyati Belief and Morals
5 Dra. Hj. Nurtjahyani TP, M.Pd.I Fiqih 6 Tina Marlinda, S.Ag, M.Pd.I Arabic
7 Hj. Hasnawati, S.Pd.I Islamic Education
8 Hj. Rodhiyatun, S.Pd.I Arabic
10 Dra. Reny Pujilestari Biology
11 Dra. Hj. Pinariam Qura’n Hadits
12 Rahmawati, S.Ag, MM. Pd Belief and Morals
13 Dra. Yuniarti Art
14 Hj. Asmaningsih, S.Ag, M.Pd.I Art
15 Rahman, M.Pd.I Fiqih
16 Tri Widyawati, S.Pd Indonesian
17 Dra. Hj. Sumarni Social Education
18 Yusmarni, S. Pd English
19 Siti maesaroh, S. Ag Arabic
20 Erni Hermala, S. Pd Social Education
21 Dra. Hj. Yusriah English
22 Dewi Choiriyah, S.Pd Social Education
23 Yuli Ismayawati, S.Pd Mathematics
24 Yenni Widiawati, M.Pd, MM.Pd Indonesian
25 Drs. Uyung Helmansyah Biology
26 Rini Sukismi, S.Pd, MM Counceling Guidence
27 Isnaini Ramadhona, MM English
28 Rumaini, M.Pd.I History and Art of Islamic
29 Ambarwati, M.Sc Biology
30 Ridha Wuryani, S.Pd, MM.Pd Mathematics
31 Siti Sunarsih, S.Pd Biology
32 Siti Insiyah, M.Pd Mathematics
33 Dra. Sisom Civics
34 Hergani, S.Pd Mathematics
35 Setiawan, S.Pd.I Mathematics
36 Eka Yusneri, S.Pd.I Lampung Language
37 Sunarto, M.Ed English
38 Erita Fifawati, S.Pd.I Indonesian
39 Evi Linawati, S.Ag, MM.Pd Belief and Morals
40 Hj. Asnah Yusfit, S.pd Mathematics
41 Kasumawati, S.Pd Science
42 Juanda, S.Pd, M.Pd.I Social Education
43 Yenni, S.Pd Indonesian
44 Sari Kaldi, S.Ag Belief and Morals
45 Drs. Agus Harwanto, M.Ed Physic
46 Hj. Rubiyatun, S.Pd Social Education
47 H. Mahmud, S.Pd.I, MM.Pd Islamic Education 48 Hajir Maimuri Karim, S.Pd Civics
49 Nihayaturrahmah, S.Pd Indonesian
51 Khalimi, S.Ag Arabic 52 Yuzi Fahrizal, S.Ag. M.Pd.I Arabic
53 Tri Noviana, S.Pd.I Islamic Education
54 Ferawati, S.Pd Counceling Guidence
55 Yenni Mariska, S.Pd Civics
56 Nusirwan, S.Ag Sport
57 Prapti Winarti, S.Ag Geographycal
58 Yulianti, S.Pd Indonesian
59 Aminah, S.Ag Islamic Education
60 Hendri Setiabudi Sukma, M.Pd.I Arabic
61 Cecilia, S.Pd Lampung Language
62 Refiana, S.Pd.I
-63 Nur Hayati, S.Pd.I History and Art of Islamic
64 Pirnawati, S.Pd.I Civics
65 Rahmawati Sa’adah, S.Pd Lampung Language
66 Nurwaton, S.Pd Counceling Guidence
67 Desnilawati, S.Si Mathematics
68 Siska Maylanasari, S.Pd Counceling Guidence
69 Eva Suryani, S.Pd English
70 Eva Syamaria Subing, S.Pd Indonesian
71 Siti Rahmawati, S.Pd.I Islamic Education 72 Hj. Balqis Prihatina, S.Pd.I Arabic
73 Nur Izzati, S.Pd.I Geographical
74 Miftah Hudi, S.Pd Technology Information
of Computer
75 Rika Lusia, S.Pd.I Islamic Education
76 Nelliwati, S.Pd.I Counceling Guidence
77 Kasnidar, S.Pd.I Counceling Guidence
78 Khairunnufus, S.Ag Counceling Guidence
79 Doni Sastrawan, S.Pd.I Tahfidz
80 Arsita Rini, S.S English Literature
81 Rotnawati, S.Ag Islamic Education
82 Wahyu Widodo, S.Pd Mathematics
83 Suhirno, S.Pd.I Tahfidz
84 Ahmad Ali, S.Pd.I Sport
85 Vita Nurul Hidayati Tahfidz
86 Daris Budiana Tahfidz
87 Ahmad Rohman, S.Pd.I
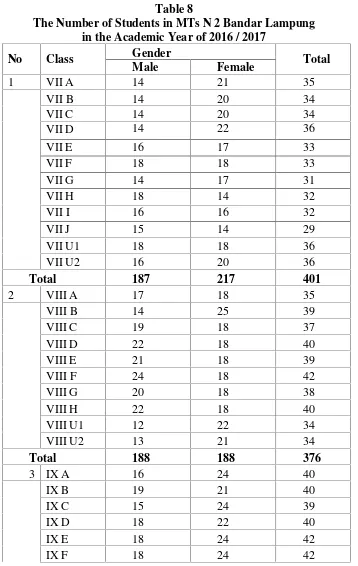
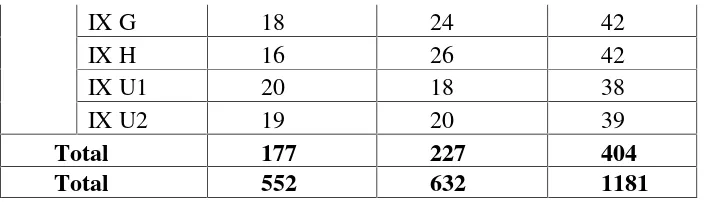
The number of students in MTs N 2 Bandar Lampung, can be presented in Table 6: Table 8
The Number of Students in MTs N 2 Bandar Lampung in the Academic Year of 2016 / 2017
No Class Gender Total
Male Female
1 VII A 14 21 35
VII B 14 20 34
VII C 14 20 34
VII D 14 22 36
VII E 16 17 33
VII F 18 18 33
VII G 14 17 31
VII H 18 14 32
VII I 16 16 32
VII J 15 14 29
VII U1 18 18 36
VII U2 16 20 36
Total 187 217 401
2 VIII A 17 18 35
VIII B 14 25 39
VIII C 19 18 37
VIII D 22 18 40
VIII E 21 18 39
VIII F 24 18 42
VIII G 20 18 38
VIII H 22 18 40
VIII U1 12 22 34
VIII U2 13 21 34
Total 188 188 376
3 IX A 16 24 40
IX B 19 21 40
IX C 15 24 39
IX D 18 22 40
IX E 18 24 42
IX G 18 24 42
IX H 16 26 42
IX U1 20 18 38
IX U2 19 20 39
Total 177 227 404
Total 552 632 1181
Source: Document of MTs N 2 Bandar lampung
As the explanation before, there were 1,181 students in this school. They were divided into three grades, grade VII, VIII and IX. There were 401 students of grade VII consisting of 187 male and 217 female. The students for grade VIII were 376 students including 188 male and 188 female. And the last, grade IX had 404 students, 177 male and 227 female.
3. Facilities of MTs N 2 Bandar Lampung
To support the teaching and learning process, MTs N 2 Bandar Lampung had some facilities. This is detailed information about the number and the condition of teaching and learning facilities of MTs N 2 Bandar Lampung can be presented in Table 7:
Table 9
Total Rooms of MTs N 2 Bandar Lampung
No The Name of Room Total Condition
1 Headmaster’s room 1 Good
2 Teaches’room 2 Good
3 Classroom 32 Good
4 Computer laboratory 1 Good
5 Mosque 1 Good
6 Library 1 Good
7 Osis’ room 1 Good
8 Polyclinic/UKS’ room 1 Good
9 Canteen 7 Good
11 Toilet for the students 21 Good
12 Science laboratory 1 Good
13 Language laboratory 1 Good
Source : Document of MTs N 2 Bandar Lampung
From the explanation before, it showed that MTs N 2 Bandar Lampung had some rooms that is used to support the process of teaching and learning activities. The conditions of all the rooms were good.
B. The Research Steps
The researcher conducted the research in April 14th 2017. Before conducting the research, the researcher asked the headmaster and the English teacher for permission at the school. After getting the permission, the researcher conducted through the following steps:
1. Determining the subject of the research, namely the students at the seventh grade of MTs N 2 Bandar Lampung.
2. Designing the test which was the multiple choice test, topics about close environment, and theme about sports, occupation, and public places for each of pre-test and post-test.
3. Determining the sample of the research by using cluster random sampling. 4. Holding the try-out test to know the reliability and validity of the test, this
test was given to the students out of research sample, it was VII D.
was VII G as an experimental class and VII H as a control class. Holding the pre-test in order to know the students’ vocabulary mastery before they
had treatment.
6. Analyzing the data which got through the pretest.
7. The treatment was conducted three times after the researcher gave the pretest to the sample. The researcher did the treatment of Hangman game to the experimental class.
8. After treatment, the researcher gave post-test to the sample in order to
know the students’ vocabulary mastery after the treatment.
9. To know the normality and homogeneity result of the data gotten through pretest and posttest, the researcher analyzed the data by using SPSS.
10. Before making the conclusion, the researcher tested the hypothesis.
11. As the last process of the research, the researcher reported the result of the research.
C. Result of the Research 1. Result of Pre-test
The researcher conducted pretest in order to see students’ vocabulary mastery before
the treatment. The scores of the students’ vocabulary mastery that were tested in
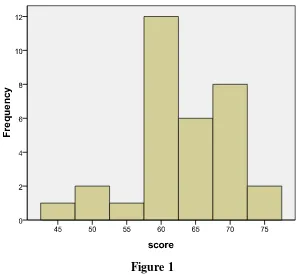
Figure 1
The Result of Pretest of Experimental Class
Based on the Figure 1, it can be concluded that there was one student who got 45 score. There were two students who got 50 score, there was one student who got 55 score, there were twelve students who got 60. There were six students who got 65 score. There were eight students who got 70 score and only two students who got 75 score. For the statistics of the result of pre-test of VII G, it can be seen on Table 8.
Table 10
Statistics of the Result of the Pretest of VII G
Statistics Score
Mean 63
Minimum 45
Maximum 75
Median 62.5
0 2 4 6 8 10
45 50 55 59 64 68 F
re q u e n cy
Score
Based on Table 8, it showed that the mean of pretest score in VII G as the experimental class was 60. The maximum score was 75 and the minimum score was 45. The median score was 60 and the mode score was 60.
The result of the pretest of VII H can be seen on the following Figure:
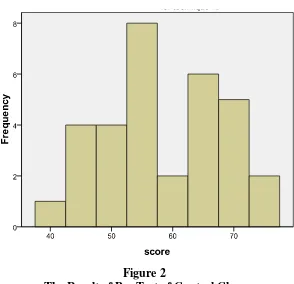
Figure 2
The Result of Pre Test of Control Class
0 2 4 6 8 10
59 64 73 77 82
F re q u e n cy
Score
Table 11
Statistics of the Result of the Pretest of Control Class
Statistics Score
Mean 58
Minimum 40
Maximum 75
Median 55
Mode 55
Based on Table 9, it showed that the mean of pretest score in VII H as the control class was 58. The maximum score was 75 and the minimum score was 40. The median score was 55 and the mode score was 55.
2. Result of Posttest
The researcher also conducted posttest in order to know students’ vocabulary mastery
after the treatment. The scores of the students’ vocabulary mastery that were tested in post-test can be seen in Figure 3 and Figure 4.
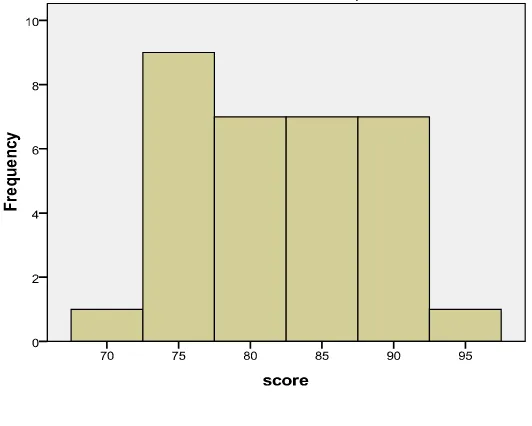
Figure 3
Based on figure 3, it can be concluded that there was one student who got 70 score. There were nine students who got 75 score, there were seven students who got 80 score, there were seven students who got 85 score, there were seven students who got 90 score, there was one student who got 95 score. For the statistics of the result of posttest of VII G, it can be seen on Table 12:
Table 12
Statistics of the Result of the Posttest of Experimental Class
Statistics Score
Mean 82
Minimum 70
Maximum 95
Median 80
Mode 75
Based on Table 10, it showed that the mean of post test score in VII G as the experimental class was 82. The maximum score was 95 and the minimum score was 70. The median score was 80 and the mode score was 75. The result of the post test of VII H as a control class can be seen on the following Figure:
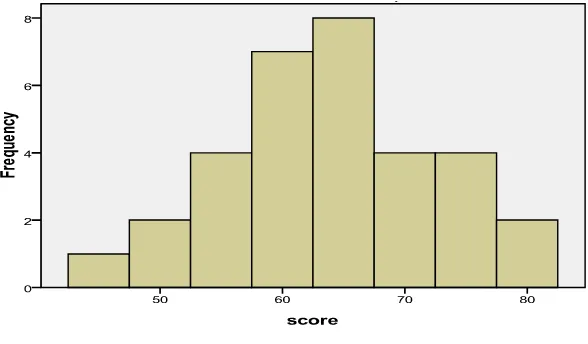
Figure 4
While for the posttest score of VII H as the control class, it can be seen in figure 4. From figure 4, it can be concluded that only one student got 45 score. There were two students who got 50 score. There were four students who got 55 and seven students who got 60 score, there were eight students got 65 score, four students got 70 and 75 score, and two students got 80 score.
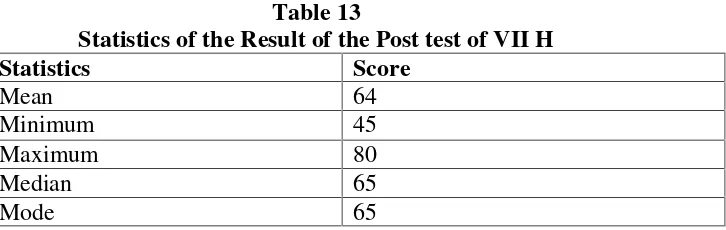
Table 13
Statistics of the Result of the Post test of VII H
Statistics Score
Mean 64
Minimum 45
Maximum 80
Median 65
Mode 65
While for the statistics of the result of the post test of VII H as the control class it can be seen in Table 11. From Table 11, it can be seen that the mean score was 64. The maximum score was 80. The minimum score was 45. The median score was 65. The mode score was 65.
D. Result of Data Analysis
1. Fulfillments of the Assumption a. Result of Normality Test
The hypotheses for normality test were formulated below: Ho: the data are normally distributed
Ha: the data are not normally distributed
While the criteria acceptance or rejection of normality test were: Hois accepted if Sig (pvalue)≥α = 0.05
Hais accepted if Sig (pvalue) < α = 0.05
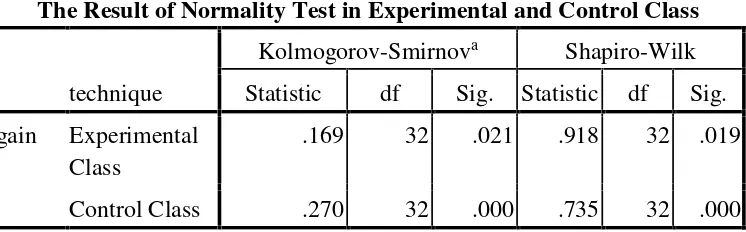
Table 14
The Result of Normality Test in Experimental and Control Class
technique
Kolmogorov-Smirnova Shapiro-Wilk Statistic df Sig. Statistic df Sig. gain Experimental
Class
.169 32 .021 .918 32 .019
Control Class .270 32 .000 .735 32 .000
a. Lilliefors Significance Correction
Based on the table 12, it can be seen that Sig. (pvalue) for experimental class was 0.021 and Sig. (pvalue) for control class was 0.000and α = 0.05. It means that Sig (pvalue) <α
and Hois rejected. The conclusion is the data were not in the normal distribution.
b. The Result of Homogeneity Test
The researcher did this homogeneity test to know whether the data is homogeneous or not. The hypotheses for the homogeneity test were formulated as follows:
While the criteria acceptance or rejection of homogeneity test were: Hois accepted if Sig (pvalue)≥α = 0.05
Hais accepted if Sig (pvalue) < α = 0.05
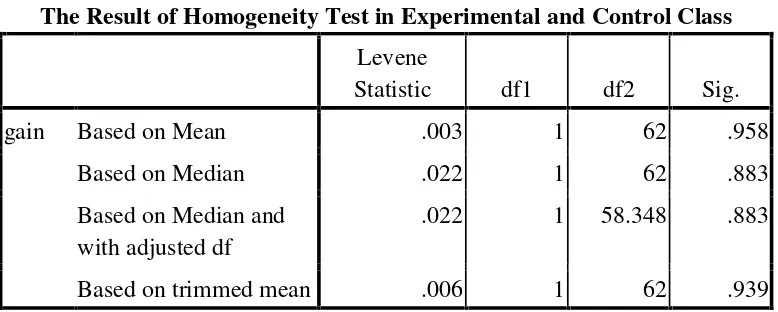
Table 15
The Result of Homogeneity Test in Experimental and Control Class Levene
Statistic df1 df2 Sig.
gain Based on Mean .003 1 62 .958
Based on Median .022 1 62 .883
Based on Median and with adjusted df
.022 1 58.348 .883
Based on trimmed mean .006 1 62 .939
Based on Table 13, it can be seen that Sig. (pvalue) based on mean was 0.958, and α =
0.05. It means that Sig. (pvalue) >α and Hois accepted. The conclusion is the data have same variance or homogenous.
2. The Result of Hypothetical Test
After the researcher knew that the data was not normal and homogeneous, the data was analyzed by using Mann Whitneytest in order to know the significance of the treatment effect. The hypotheses are:
Ho: There is no a significant influence of using Hangman game towards students’ vocabulary mastery at the second semester of the seventh grade of MTs N 2 Bandar Lampung in the academic year of 2016/2017.
While the criteria of the hypothetical test are: Hais accepted if Sig (pvalue)≤α = 0.05
Hois accepted if Sig (pvalue) > α = 0.05
Table 16 Ranks
technique N Mean Rank
Sum of Ranks
gain Experimental 32 47.25 1512.00
Control 32 17.75 568.00
Total 64
Test Statisticsa
gain Mann-Whitney U 40.000
Wilcoxon W 568.000
Z -6.486
Asymp. Sig. (2-tailed)
.000
a. Grouping Variable: technique
Based on the result obtained in the table 14, it is clear that the value of significant generated Sig. (pvalue) or Sig. (2-tailed) of the equal variance assumed 0.000, and the α
computation, it was concluded that there was a siginificant influence of using Hangman game towards students’ vocabulary mastery at the seventh grade of MTs N
2 Bandar Lampung.
E. Discussion of Finding
At the beginning of the research, the researcher explained there were some
procedures used to know the students’ vocabulary mastery. Some tests were conducted to collect the data such as pre test and post test. The pre test was
administered to know the students’ vocabulary mastery before they were given
treatments from the researcher. The score of pre test would be used as the students’
score before treatments. The kind of vocabularies which was tested were common noun including single word, compound word, and complex word. The theme was close environment with topics about sport, occupation, and public places.
In the last of the research, post test was given to measure the improvement of the
students’ vocabulary mastery in both classes after the treatments done. The score of
post test in experimental class showed that the mean was 82.03 and the score of post test in control class showed that the mean was 63.91. Next the researcher analyzed the normality and homogeneity of the data and the result showed that the data were not normal and homogenous.
The researcher used Mann-Whitney test because the data were not normal. Based on the analysis of the data and the testing of the hypotheses, the result of Mann-Whitney test is that the null hypotheses (Ho) is refused and the alternative hypotheses (Ha) is accepted. It means that there is a significant influence of using Hangman game game towards students’ vocabulary mastery.