STUDY ON SHADOW EFFECTS OF VARIOUS FEATURES ON CLOSE
RANGE THERMAL IMAGES
Chia-Ling Liao a, Hao-Hsiung Huang a a
Land Economic Office,NO.64,Sec.2,ZhiNan Rd., Wenshan District, Taipei City 11605,Taiwan (R.O.C) [email protected], [email protected]
Working Group, Theme or Special Session: V/5: Image Sensor Technology
KEY WORDS:Thermal Sensor, Modeling, Temperature Detection, Thermal Infrared Images, Close Range ABSTRACT:
Thermal infrared data become more popular in remote sensing investigation, for it could be acquired both in day and night. The change of temperature has special characteristic in natural environment, so the thermal infrared images could be used in monitoring volcanic landform, the urban development, and disaster prevention.
Heat shadow is formed by reflecting radiating capacity which followed the objects. Because of poor spatial resolution of thermal infrared images in satellite sensor, shadow effects were usually ignored. This research focus on discussing the shadow effects of various features, which include metals and nonmetallic materials.
An area-based thermal sensor, FLIR-T360 was selected to acquire thermal images. Various features with different emissivity were chosen as reflective surface to obtain thermal shadow in normal atmospheric temperature. Experiments found that the shadow effects depend on the distance between sensors and features, depression angle, object temperature and emissivity of reflective surface. The causes of shadow effects have been altered in the experiment for analyzing the variance in thermal infrared images.
The result shows that there were quite different impacts by shadow effects between metals and nonmetallic materials. The further research would be produced a math model to describe the shadow effects of different features in the future work.
1. INTRODUCTION
Nowadays, to collect digital images is not limited by using a digital CCD camera. A thermal sensor is commonly used in remote sensing. However, shadow effects should be considered when interpreting and analyzing the thermal images (NA, 2009). A FLIR T360 has been used in this study. Definitions, experiment design, result analysis and summary are described respectively as follows.
2. DEFINITIONS
In general, interpretation of temperature distribution on thermal images is very complicated. Several factors listed as below may influence quantitative determinations of thermal images.
1. The instantaneous field of view of sensors (IFOV).
2. Composition, density and texture of the materials scanned by the sensor.
3. Emissivity of the surface materials. 4. Internal heat flux of the materials. 5. Variations in depression angle to sensor
position.
6. Absorption and re-emission of thermal radiation. (Short, 2009)
Investigations of whole of them stated above are not possible, only the factors which could be controlled artificially have been explored in this research. In Figure 1(a), shadow effect comes up on the reflector, and Figure 1(b) is visible light image of the same object. In order to consider the factors of thermal shadow, which were ignored generally in the
satellite images, different distance between target and sensor have been tested. The distance between the reflector and target has also been tested for determining the shadow effect on the close range thermal images.
2.1 Thermal Shadow
Unlike the shadow generated by the sun, thermal shadow and light source would not appear on the two opposite sides of the object. Thermal shadow will be appeared between thermal sensor and objects, and always faces toward the sensor while moving the thermal sensor, as shown in Figure.2.
(a) Thermal image (b) Visual image Figure 1. Images from thermal sensor
(a) (b) Figure 2. The location of thermal shadow
2.2 Thermal Shadow Characteristics
As shown in Figure. 1(a), no shadow of the object, tree on the grass, however, obvious shadow of the tree on the purposely designed plate. Shadow effect comes to be closely linked to the roughness of reflectors, so the shadow effect is related to the roughness of environment around the object.
Both geometric and radiometric characteristics should be considered. In the geometric aspect, thermal shadow has the same shape of original objects. In the radiometric aspect, the temperature of thermal shadow has been measured to analyze the characteristic of radiation.
3. EXPERIMENT DESIGN
In this research, both metals and nonmetallic materials like aluminum, stainless, wood, acrylic have been chosen as reflectors. A tree with stable temperature was the target. A FLIR T360 has been used in this study. The technical specifications can be found at: http://0rz.tw/H14sN .
Several factors might influence the result when interpreting thermal images, only three of them, the distance between target and sensor, distance between target and reflectors, and various depression angle of thermal sensor were discussed in this research.
3.1 Examine the Distance between Target and
Sensor
In order to obtain the distance concerned with target and sensor, distance between target and reflector has been fixed, depression angle of thermal sensor, and change the distance between target and sensor in this research.
3.2 Examine the Distance between Target and
Reflectors
Shadow effect may be influenced on target and distance between sensor or reflectors, so it would fix distance between target and sensor, depression angle of thermal sensor, and change distance between target and reflectors to generate the relationship of variables.
3.3 Examine Various Depression Angle
According to the phenomenon stated above, the temperature of thermal shadow may have remarkable different in variable depression angle. A series of experiments have been executed by observing different values, Which temperature was computed respectively between target and its thermal shadow.
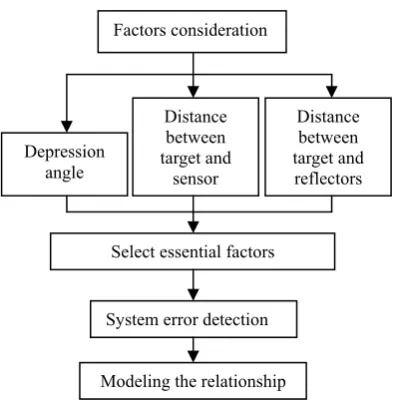
4. EXPERIMENT FLOW CHART
The flow path of this experiment is shown as Figure 3. At first, there are many factors should be considered.
And then chooses three factors as object of study by thinking about physical nature of shadow. Through these selected factors to probe for finding essential
factors. After detecting system error which was generated by thermal sensor, it could help to search out the relationship between many factors.
Figure 3. The experiment flow path
5. RESULTS ANALYSIS
5.1 Results of Distance between Target and
Sensor
Observations extracted from thermal sensor are summarized in Table 1. The data listed below represents the temperature corresponding to the shadow of a stable temperature object on different reflectors. The environment was set in 30° of depression angle and 0cm between target and reflectors.
Table 1 Temperature (℃) of shadow on different distance between target and sensor
According to the results, target placing at the wood plane had no significant thermal shadow at 2m and 2.5m.
The data shows that distance between target and sensor does not affect the temperature of thermal shadow. By determining the standard deviation in each reflector, it shows no significance when changing the distance between target and sensor. Distance(m)
Reflector (emissivity)
1 1.5 2 2.5 Stdev.
Aluminum(0.05) 17.5 17.5 17.5 17.5 0.03 Stainless(0.075) 17.3 17.5 17.3 17.4 0.07
Wood(0.91) 17.4 17.4 - - 0
Acrylic(0.906) 17.1 17.4 17.2 17.2 0.11 Factors consideration
Select essential factors
System error detection
5.2 Results of Distance between Target and Reflectors
Observations taken by thermal scanner are summarized in Table 2 The environment was set in 30° of depression angle and 1m between target and sensor. The data listed represents the temperature corresponding to the shadow of a stable temperature object on different reflectors.
Table 2. Temperature(℃) of shadow on different distance between target and reflectors Among the result, target at the wood or Acrylic plane had no significant thermal shadow.
The data shows that distance between target and reflectors do not affect the temperature of shadow, there is no significant different temperature determining by standard deviation in each reflector when changing the distance between target and reflectors.
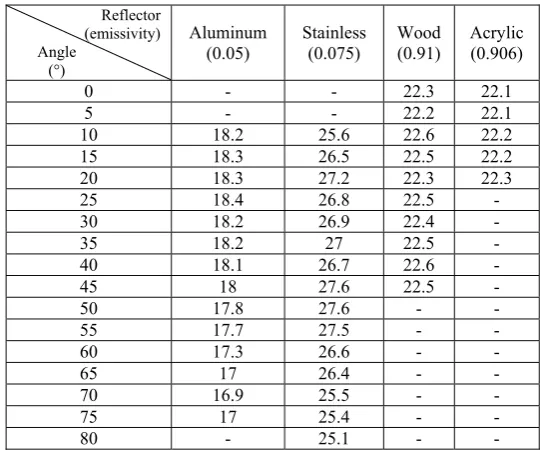
5.3 Results in Variable Depression Angle
Observations taken by thermal scanner are summarized in Table 3. The data listed represents the temperature corresponding to the shadow of a stable temperature object on different reflectors.
Table 3. Temperature(℃) of shadow on different reflectors in variable depression angle 5.3.1 The result of metallic reflectors (including steel and aluminium)
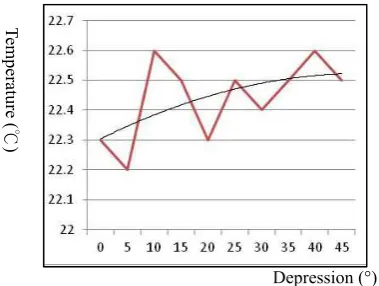
For metallic reflector, experimental results appear that the depression of angle should be the most important as a parameter in calculating. If one uses these data to build up a mathematical model, it would fit a quadratic polynomial. Figure 4 and Figure 5 are the result of quadratic polynomial by thermal shadow temperature. The black lines in two graphs are the trend lines of quadratic polynomial.
Figure 4. The graph of stainless temperature
Figure 5. The graph of aluminium temperature Distance
Reflector (emissivity)
5cm 10cm 15cm 20cm Std.
Aluminum(0.05) 17.8 17.8 17.8 17.8 0 Stainless(0.075) 17.8 17.8 17.8 17.8 0
Wood(0.91) - - -
Acrylic(0.906) - - -
Reflector (emissivity) Angle
(°)
Aluminum (0.05)
Stainless (0.075)
Wood (0.91)
Acrylic (0.906)
0 - - 22.3 22.1
5 - - 22.2 22.1
10 18.2 25.6 22.6 22.2
15 18.3 26.5 22.5 22.2
20 18.3 27.2 22.3 22.3
25 18.4 26.8 22.5 -
30 18.2 26.9 22.4 -
35 18.2 27 22.5 -
40 18.1 26.7 22.6 -
45 18 27.6 22.5 -
50 17.8 27.6 - -
55 17.7 27.5 - -
60 17.3 26.6 - -
65 17 26.4 - -
70 16.9 25.5 - -
75 17 25.4 - -
80 - 25.1 - -
T
emper
ature
(
℃
)
Depression (°)
T
emper
ature
(
℃
)
Equation 1 and 2 represents the quadratic polynomial of stainless and aluminum respectively.
y =-0.0392x2 + 0.6953x + 24.236 (1) y =-0.0117x2 + 0.057x + 18.238 (2) where y = difference temperature of shadow x = depression angle
In Figure 4 and Figure 5, difference temperature of shadow on metal reflectors have been calculated that it has high correlation with sin(θ), whichθis depression angle of thermal sensor. Following the supposition, an equation could be tested as math model like Equation 3.
y = a.sin(x) + b (3) where a = emissivity of the surface materials,
b = a parameter which should be solved by adjustment.
B value calculating by adjustment is 22.3417, and the standard deviation is 4.5023.
The standard deviation is too large to use to be a math model. Because of shortage on finding various factors, there are more factors should be considered. However, the result of metal reflectors can see a trend to similar to a math function. The temperature of shadow may be effect by emissivity and depression angle and so on, as Equation 4.
t = f (ε,θ, … )
where t = temperature of shadow ε= emissivity of reflector θ = depression angle
5.3.2 The result of non-metallic reflectors (include wood and acrylic)
Because the temperature of trees is too low to let the clear thermal shadow show on non-metallic reflectors, it has no data to paint the curves. The curves are displayed in following Figures 6 and 7.
Figure 6. The graph of wood temperature
Figure 7. The graph of acrylic temperature There are some data missing in Figure 6 and 7, it is the same reason as discussed in 5.3.2 section. But according to the two figures, it could make a conclusion that metallic and non-metallic reflectors has entirely different characteristic on generating thermal shadow.
At the same time, there is a phenomenon discovered by this experiment, which is Non-metallic material would not generate thermal shadow, when the target temperature is near to the reflectors’. The largest difference between metallic and non- metallic material is emissivity, so it could prove that the generation of thermal shadow is greatly influenced by emissivity. The foregoing in chapter 1 mention that there are complex factors in interpreting the thermal images, after the examinations in this study, it could be noticed that emissivity is the most important factor of the surface materials and the variations in the depression angle to sensor position.
6. SUMMARY
Based on the experimental results, several conclusions could be drawn, as follows:
1. No thermal shadow is appeared on a metallic reflector, when the temperatures of object and reflector are very similar. 2. Relative to the shadow effect, distance is
little influence of the interrelationship between target, reflector, and sensor. 3. While using thermal sensor, shadow
effect should be considered. In addition to depression of angle, there are other factors affecting to shadow effect like FOV, focus distance, IR resolution, spectral range, and so on, requiring to be used another thermal sensor to test. In this way, the more factors to discuss in math equation, the more accuracy to structure a math model.
7. REFERENCE
Battuello M., Clausen S., Hameury J., Bloembergen P.,1999, “The Spectral Emissivity of Surface Layers Currently Applied in Blackbody Radiators Covering the Spectral Range from 0,9 to 20 µm – An International Compairison”, TEMPMEKO ’99 Proceedings, pp. 601-606.
Bing Chen, John Maloney, David Clark, Wai Ning Mei, John Kasher, 1995, “Measurement of Night Sky Emissivity in Determining Radiant Cooling from Cool Storage Roofs and Roof Ponds”.
Chih-Chung NA,2009, Report on The 30th Asian Conference on Remote Sensing Asian Conference on Remote Sensing, Asian Association on Remote Sensing ”Research on Characteristic of Area-Based Thermal Infrared Images”, Taipei , Taiwan. Frank Liebmann, Fluke Corporation, 1988 “Emissivity – The Crux of Accurate Radiometric Measurement”, American Fork
http://0rz.tw/90LfI
IRCON, INC, 1999, Temperature Errors Caused by Change in Product Emissivity, TECHNICAL SOLUTIONS, TS100
Jensen, J. R., 2007. "Remote sensing of the environment: an earth resource perspective, 2
nd
Edition", Pearson Education, Inc
Jensen, J. R. 2005. "Introductory digital image processing, 3
rd
Edition", Pearson Education, Inc. Joseph A. Shaw, Christopher Marston, 2000. Polarized infrared emissivity for a rough water surface. OPTICS EXPRESS, Vol. 7, No. 11, pp.375-380
J. J. Bock, M. K. Parikh, M. L. Fischer, and A. E. Lange, 1995 “Emissivity measurements of reflective surfaces at near-millimeter wavelengths.” APPLIED OPTICS, Vol. 34, No. 22
Kustas,W. P., J. M. Norman, M. C. Anderson, A. N. French, 2003. “Estimating subpixel surface temperatures and energy fluxes from the vegetation index-radiometric temperature relationship.”, Remote Sensing of Environment, 85, pp. 429−440. Short, Nicholas M., 2009, "Remote Sensing Tutorial ",US