Civil Engineering Dimension
A MODAL PUSHOVER ANALYSIS ON MULTI-SPAN
CONCRETE BRIDGES TO ESTIMATE INELASTIC
SEISMIC RESPONSES
Ima Muljati
Lecturer, Civil Engineering Department, Petra Christian University, Surabaya, Indonesia Email: [email protected]
Pennung Warnitchai
Associate Professor, School of Engineering and Technology, Asian Institute of Technology, Bangkok, Thailand Email: [email protected]
ABSTRACT
The performance of Modal Pushover Analysis (MPA) in predicting the inelastic seismic response of multi-span concrete bridges is investigated. The bridge is subjected to lateral forces distributed proportionally over the span of the bridge in accordance to the product of mass and displaced shape. The bridge is pushed up to the target displacement determined from the peak displacement of the nth mode inelastic Single Degree of Freedom
System derived from Uncoupled Modal Response History Analysis (UMRHA). The peak response from each mode is combined using Square-Root of Sum-of-Square (SRSS) rule. Although the use of SRSS rule is not appropriate in this bridge and the displaced pattern is shifted from the elastic shape due to yielding, MPA can predict well the total peak response of the bridge in inelastic range.
Keywords:
INTRODUCTION
Pushover analysis has been widely used for ana-lyzing the seismic behavior of bridge structures [1,2,3]. It can be used as a method for determining the capacity of a bridge structure neglecting the higher mode effects. This approach may produce an error for long or irregular bridges, especially in cases where the bridge has a large scattered mass distri-bution in the transverse direction [1]. Nonlinear pushover analysis is shown able to predict the inelastic response of the Greveniotikos Bridge which was designed as continuous bridge decks with no intermediate movement joints [2].
At the same time, many researchers reported the successful of pushover analysis on building struc-tures especially for low to medium-rise building, which is typically dominated by the first mode [4,5,6]. However, as the structure becomes higher, the participation of higher modes may increase. These higher mode effects may contribute to the structure’s response significantly [4]. In this case, the single invariant force distribution used by pushover analysis cannot represent the potential range of loading experienced in dynamic response. Therefore several new analysis methods have been developed
Note: Discussion is expected before June, 1st 2007, and will be published in the “Civil Engineering Dimension” volume 9, number 2, September 2007.
Received 8 October 2005; revised 2 November 2006; accepted 12 November 2006.
to overcome the limitations of conventional pushover analysis. One of them [5] is to perform pushover analysis using an invariant lateral force distribution for each mode independently, to consider the contribution of higher modes. The peak responses determined from every mode are combined using square-root of sum-of-square (SRSS) combinations. This procedure is termed as Modal Pushover Analysis (MPA). Chopra and Goel [5] claimed that as an improved pushover analysis, MPA offers conceptual simplicity but provides superior accuracy compared to the conventional pushover analysis in estimating seismic demands on buildings.
In the other hand, the structural behavior of bridges is different from that of other structures (i.e. building structures). Although bridge design also improved during the past ten years, in the field of seismic design, it is several years lacking behind the progress achieved in building design [3]. Therefore, the application of MPA on bridge structure can be considered as an alternative to bridge design improvement.
MODAL PUSHOVER ANALYSIS
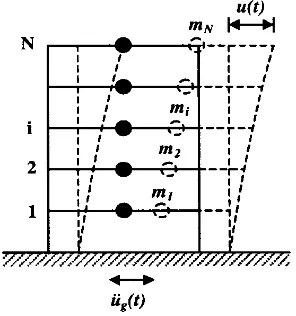
The governing equilibrium equations of the
N-degree of freedom (N-DOF) system shown in Figure 1 to horizontal earthquake ground motion üg(t) are
as follows:
damping, and lateral stiffness matrices of the system respectively; where i is an influence vector with every member equal to unity.
Figure 1. N-DOF System Under Ground Motion
In inelastic system, the relations between lateral forces fs and the lateral displacements u are not
single-valued, but depend on the history of the displacements:
Therefore for inelastic system Equation (1) can be rewritten as follows:
)
Equation (3) consists of coupled equations. Solving these coupled equations directly, leads to the Nonlinear Time History Analysis (NLTHA).
In developing MPA for inelastic structures, Equation (3) will be transformed to the modal coordinates of the corresponding linear system. Although it is not proper because modal analysis is not valid for inelastic system, it can be assumed that at initial state of inelastic condition, the inelastic system has the same properties (e.g. stiffness, mass, and damping) with the elastic system [7]. Expanding the displacements of the inelastic system in terms of the natural vibration modes of the corresponding linear system one will obtain [8]:
∑
=mode of the structure, and the modal coordinate respectively. Then, using Equation (4) and premulti-plying by
φ
Tn, Equation (3) can be rewritten as [8]:qn(t) can readily be obtained by comparing Equation
(5) to the equation of motion for the nth mode elastic
Comparing Equation (5) and (7) gives:
)
(
)
(
t
D
t
q
n=
−
Γ
n n (8)and substituting in Equation (4) gives the floor displacements:
The preliminary step in developing modal pushover analysis for inelastic systems is performing uncou-pled modal response history analysis (UMRHA). The UMRHA neglects the coupling of the N-equations in modal coordinates in Equation (5) to obtain the maximum displacement (Equation (9)) in each mode in the modal coordinate.
To represent the relation between lateral forces fs
and the lateral displacements u (Equation 2), structure is pushed to a maximum value determined in Equation (9) using lateral forces distributed over the building height in accordance to sn*:
n n
m
φ
s
*=
(10)The base shear Vbn can be plotted against
displace-ment urn. A bilinear idealization of this pushover
curve for the nth mode is shown in Figure 2(a).
The relation between forces and displacement follows [8]:
(a) Idealized pushover curve
(b) Fsn/Ln-Dn relationship
Figure 2. Properties of the nth-mode inelastic SDOF system
from pushover curve [8]
in which
M
n*=
L
nΓ
n is the effective modal mass. The two equations are related throughny
The peak displacement for each mode is given by:
n
by solving Equation (7) or from the inelastic response (or design) spectrum. The other peak response (e.g. shear, moment, etc.) can be derived statically from this pushover analysis. The peak modal responses are combined according to the square-root-of-sum-of-squares (SRSS) rule. Then, the SRSS rule provides an estimate of the peak value of the total response:
2
BRIDGE SELECTION AND MODELING
A multi-span concrete bridge in Surabaya area is chosen as the study case. The bridge deck is supported by a single-span prestressed concrete
girders. The girders are placed on the concrete pier head through the bearing and locked in the transverse direction. The supporting piers are in various heights, but in this study equal height of 7.7 m is selected. The width of the bridge is 10.5 m with 30 m length of equal span. After doing comparison on the dynamic properties of three- to twenty-spans of the bridge, the twelve-span bridge is considered to be able to represent the behavior of multi-span bridge as the whole [9]. Some basic structural properties of the bridge are shown in Figure 3.
(a) Piers’ section
(b) Elevation view (yz-direction)
(c) Pier’s numbering (xz-direction)
Figure 3. The Bridge Properties
The deck is supported by four prestressed girders of 30 m span, connected by stringer beams at 6 m interval span. The deck structure is modeled as an assemblage of linear elements in SAP2000 Non-linear program [10,11]. The deck is assumed to be rigid in x- and y-direction. All node lies at the same elevation in which at the centre of gravity of the girder and stringers, and mass is lumped at both ends of element.
flexural rigidity of pier section is taken 0.7EcIg as
recommended by ATC-40 [13].
Bearing is modeled using link element in SAP2000 Nonlinear program [10,11]. It is composed of six separate “springs”, one for each of the six defor-mational degrees-of freedom (axial, two-way shears, two-way bendings, and torsion).
The bridge pier is supported by twenty five driven piles with dimension 0.45 x 0.45 x 35 m. The 6.9 x 6.9 x 1.5 m pile cap is modeled as a shell element in SAP2000 Nonlinear program. To accommodate the soil-structure interaction, each pile is modeled as spring with six degree of freedom to represent translational and rotational support. As recommended by ATC-40 [13], for a purely friction pile which implies that the force at the tip is zero, the vertical stiffness of pile, Kv= 3.42x10⁵ kN/m for each
pile. While, the horizontal stiffness of pile is assumed to be 0.05Kv= 1.71x10⁴ kN/m [14].
GROUND MOTION
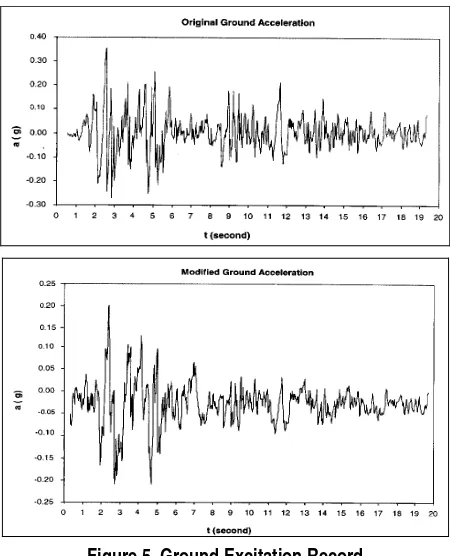
Indonesian seismic zoning was based on the peak ground acceleration (PGA) induced by the design earthquake with 500-years return period [15]. This zoning defines Surabaya in zone 2. The response spectrum of structures in this zone is shown in Figure 4. The earthquake record needs to be modified prior to the analysis so that it can represent the ground motion for Surabaya area. The modification has been done using RESMAT [16], a program developed at Petra Christian University, Indonesia, especially to match with the response spectra curve for soft soil. The modified ground excitation resulted by RESMAT program is shown in Figure 5.
Figure 4. Response Spectrum for Surabaya Area [15]
Figure 5. Ground Excitation Record
RESULTS AND DISCUSSION
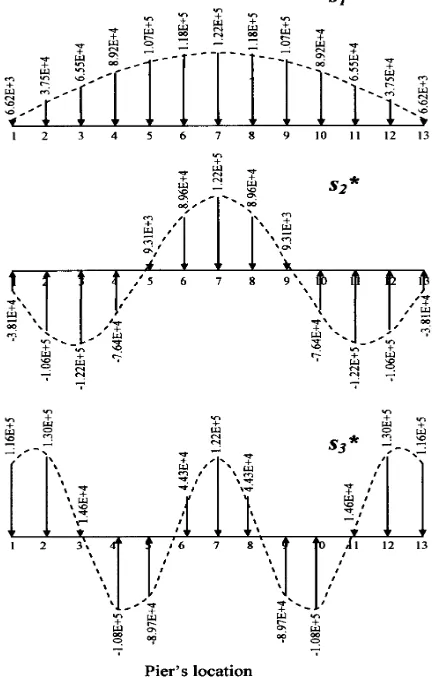
The first three vibration modes of the bridge for linearly elastic vibration are shown in Figure 6. All mode shapes are normalized to the centre pier (i.e. pier 7). The elastic dynamic properties of three modes are shown in Table 1. These three modes are selected based on the highest modal mass participating factor and natural periods among forty modes resulted by modal analysis [9]. The spatial force distributions, sn* (Equation 10), for the first
three modes are shown in Figure 7. These force distribution will be used in the modal pushover analysis to be presented later.
Figure 6. First three Modes of The Bridge, Normalized to Pier’s Top of Pier 7
Figure 7. Force Distribution sn* = mφn, n = 1, 2, 3 (at Pier’s Top
Elevation)
Table 1. Elastic Dynamic Properties of The Bridge
Mode Period (sec)
Mass Participating
Ratio
Frequency (cyc/sec)
Circular Frequency
(rad/sec)
Eigenvalue
(rad2/sec2)
1 0.66 0.54 1.52 9.57 91.55
2 0.63 0.06 1.58 9.92 98.38
3 0.56 0.03 1.80 11.29 127.40
Observe that only the first mode experience inelasticity (for peak ground acceleration 0.5g). The figures in the right side show the force-displacement relation which should be used to solve Equation (7). By making of this relationship, there is additional approximation in UMRHA in addition to neglecting coupling among each modal equation.
By solving Equation (7), we can obtain the individual modal responses. The combined response due to the three modes from UMRHA, and the exact response from NLTHA for the pier’s top displacement of pier 7 are shown in Figure 9. The peak values of response are noted; in particular, the peak displacement due to each of the three modes is ur1o =39.10 mm, ur2o
=12.91 mm, ur3o = 6.81 mm. All peak values of the
bridge are presented in Figure 10 and 11 respectively; also included the combined responses due to one, two, and three modes, as well as the exact results.
Figure 8. Pushover Curve and Fsn/Ln-Dn Curve for Mode 1, 2,
Figure 9. Pier’s Top Displacement History Due to Peak Ground Acceleration 0.5g
Observe that errors tend to decrease as response contributions of more modes are included, although the trends are not systematic as when the system remained elastic [9].
Pushing the bridge into the target displacement derived from UMRHA; in particular ur1o =39.10 mm,
ur2o =12.91 mm, ur3o =6.81 mm, for the first, second,
and third mode will produce the peak values as presented in Figure 12 and 13, respectively. The figures also present the combined responses due to one, two, and three modes, as well as the exact results from Nonlinear Time History Analysis (NLTHA).
In the present study the peak displacement determined from UMRHA is used to determine the target displacement in MPA. If this target displacement can be taken directly from inelastic response spectrum, it will be very efficient to do the analysis because we do not need to conduct UMRHA.
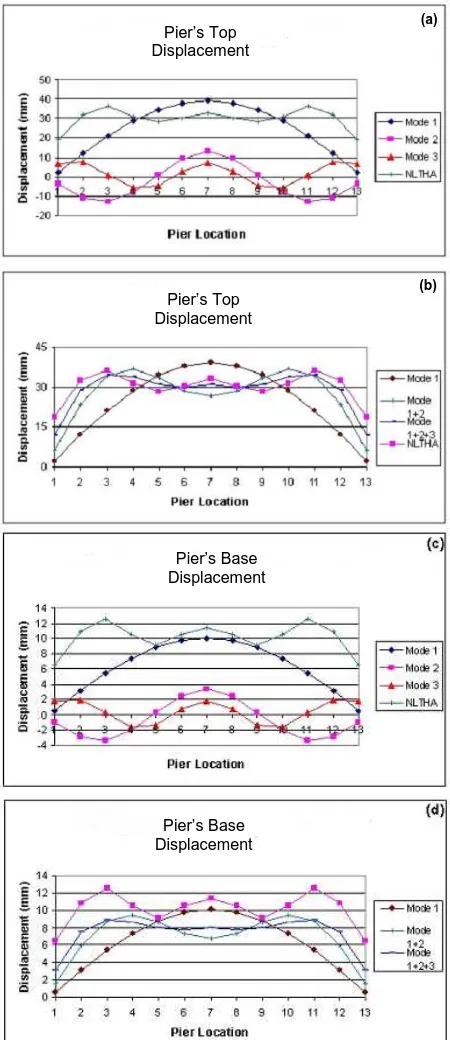
However, MPA is only good in predicting the peak displacement at the target point (i.e. pier’s top of pier 7). In general, both methods overestimate the pier’s top displacement of piers in the middle span (i.e. pier 5 to 9) as shown in Figure 10 (for UMRHA) and Figure 12 (for MPA). At the same time, both of them failed to predict the peak displacement of node at the different elevation from the target’s elevation (i.e. pier’s base elevation shown in Figure 10(d) and 12(d)).
Figure 10. Pier’s Top and Base Displacement from UMRHA
Observed, there is a shift pattern of mode 1 for pier’s top displacement in Figure 12(a) and (b) compared to the pattern in the elastic range. This shift is caused by yielding at the pier’s base. For clarification, Figure 14(a) shows the mode 1 pushover curve. Pier 7 is starting to yield at displacement 26 mm. Subsequent yielding occurs at pier 6 and 8 at displacement 27 mm. It is clear that when the peak displacement at pier’s top of pier 7 reach 39.10 mm, three piers already yield. As the result, bridge can not maintain the elastic pattern of mode in the elastic range.
Pier’s Top Displacement
Pier’s Top Displacement
Pier’s Base Displacement Pier’s Base Displacement
(a)
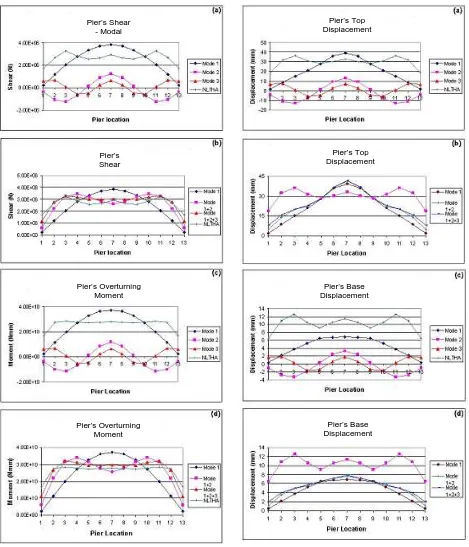
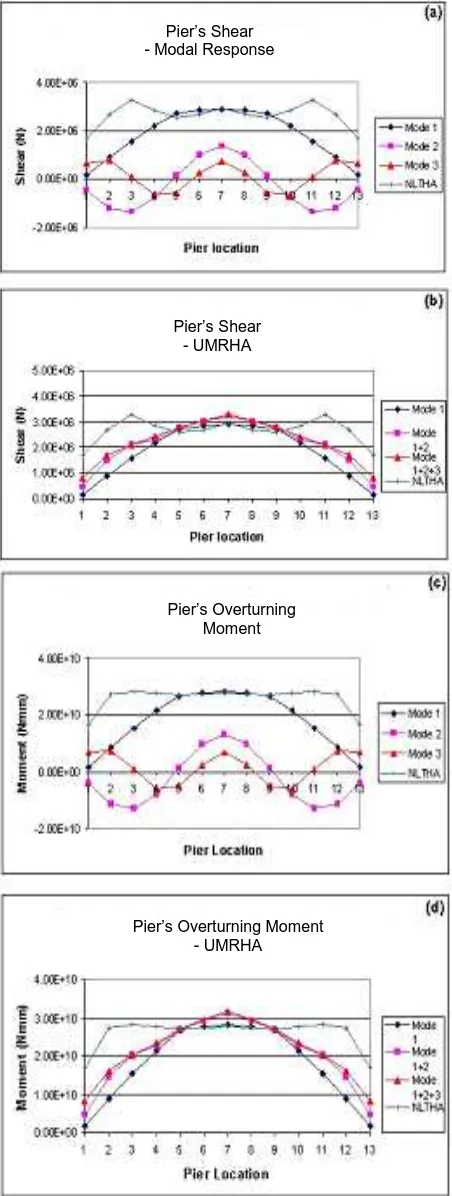
Figure 11. Pier’s Shear and Overturning Moment from UMRHA Figure 12. Pier’s Top and Base Displacement from MPA
Pier’s Shear - Modal
Pier’s Shear
Pier’s Overturning Moment Pier’s Overturning
Moment
Pier’s Top Displacement
Pier’s Top Displacement
Pier’s Base Displacement
Figure 13. Pier’s Shear and Overturning Moment from MPA
Note: 5-9 is the number of pier
Figure 14. Hinge Formation History Due to 0.5g Peak Ground Acceleration.
CONCLUSIONS
1. Although MPA can predict well the maximum displacement in the elastic range, it fails to estimate the maximum displacement of each pier especially piers at the quarter end span of the bridge.
2. For the case of multi-span bridge used in this study, the performance of MPA in nonlinear range shows a similar tendency with MPA in linear range. Although the mode shape changes due to yielding, the maximum displacement still can be predicted, as well as shear and over-turning moment at the piers.
3. Being an approximate method, MPA gives an acceptable accuracy beside of simplicity and efficiency in calculation. Therefore, the perfor-mance of MPA needs to be investigated in more various structures.
REFERENCES
1. Reinhorn, A.M., et al., IDARC-Bridge: A compu-tational platform for seismic damage assessment of bridge structures, Multi Technical Report MCEER-98-0011. 1998.
2. Abeysinghe, R.S, et al., Pushover Analysis of Inelastic Seismic Behavior of Greveniotikos Bridge, Journal of Bridge Engineering, Vol.7, No.2, March-April 2002.
3. Emami, B., Development of Bridge Seismic Design in The United States, Proceedings of 12th
Symposium on Earthquake Engineering, Vol.2, December 16-18, 2002, Indian Institute of Technology, Roorkee.
Pier’s Shear - Modal Response
Pier’s Shear - UMRHA
Pier’s Overturning Moment
4. Chintanapakdee, C. and Chopra, A.K., Evalua-tion of Modal Pushover Analysis Using Generic Frames, Earthquake Engineering and Struc-tural Dynamics, Vol.32, January, 2003.
5. Chopra,A.K. and Goel, R.K., A Modal Pushover Analysis Procedure for Estimating Seismic Demands for Buildings, Earthquake Engineering and Structural Dynamics 2002: 31: 561-582. 6. Lumantarna, B., et. al., Keandalan Analisa
Pushover untuk Meramal Perilaku Seismik Nonlinier Struktur Portal Terbuka dengan Reentrant Corner, Dimensi Teknik Sipil Maret 2004. Vol 6. No.1. p.1-6.
7. Chopra, A.K. and Goel, R.K., A Modal Pushover Analysis Procedure to Estimate Seismic Demands for Buildings: Theory and Preliminary Evaluation, Pacific Earthquake Engineering Research Center, PPER 2001/03, Jan 2001.
8. Chopra, A.K. and Goel, R.K., A Modal Pushover Analysis Procedure for Estimating Seismic Demands for Buildings, Earthquake Engineering and Structural Dynamics, Vol.31, No.3, March 2002.
9. Muljati, I., A Modal Pushover Analysis on Multi-span Concrete Bridges to Estimate Inelastic Seismic Responses, Asian Institute of Technology Thesis, December 2004, Bangkok.
10. Computer and Structures, Inc., SAP 2000 ver-sion 8–Getting started, basic analysis reference, introductory tutorial, Berkeley, California. 2002. 11. Computer and Structures, Inc., SAP 2000 version 8–Analysis reference manual, Berkeley, Califor-nia. 2002.
12. Paulay T. and Priestley, M.J.N., Seismic Design of Reinforced Concrete and Masonry Buildings,
John Wiley & Sons, Inc. 1992.
13. Applied Technology Council, ATC-40 Seismic Evaluation and Retrofit of Concrete Buildings-Volume 1, 1996.
14. Serbpong, K., Evaluation of Seismic Perfor-mance of an Existing Medium-Rise Reinforced Concrete Frame Building in Bangkok, Asian Institute of Technology, Thesis No. ST-01-11, Bangkok, 2001.
15. Standar Nasional Indonesia, SNI 03-1726-2002,
Tata Cara Perencanaan Ketahanan Gempa untuk Bangunan Gedung, Badan Standardisasi Nasional, 2002.
![Figure 2. Properties of the nth-mode inelastic SDOF system from pushover curve [8]](https://thumb-ap.123doks.com/thumbv2/123dok/3672119.1469659/3.595.311.527.226.564/figure-properties-nth-mode-inelastic-sdof-pushover-curve.webp)