Tracking dynamic changes and monitoring socioeconomic parameters in Algeria between
1993 and 2012, using nighttime light remote sensing
Bouarouri Faouzi*, Prosper Washaya
State Key Laboratory for Information Engineering in Surveying, Mapping and Remote Sensing, Wuhan University, Wuhan 430079, China
Department of Informatics, Faculty of Science, [email protected]
Commission IV, WG IV/3 ICSDM 2017
KEYWORDS: Nighttime light, Human settlement, Gas flaring, Light separation, Dynamic change, Socioeconomic parameters.
ABSTRACT:
This paper is based on using DMSP-OLS data from satellites nighttime light observations to detect both sources of light emissions in Algeria from human settlement areas and gas flaring from oil-extraction and natural gas production. We used the time series of data from DMSP-OLS images to examine the spatial and temporal characteristics of urban development in 48 Algerian provinces from 1993 to 2012. A systematic nighttime light calibration method was used to improve the consistency and comparability of the DSMP-OSL images and then a separation is made between light detected from human settlements and light detected from gas flaring in order to allow us to study human settlements without other light emissions and then assess the suitability of using DMSP data in southern Algeria and its ability to monitor gas flaring. Linear regression methods were developed to identify the dynamic change of nighttime light and estimated its growth directions at pixel level. This work is the first to use nighttime light observations to detect and monitor the growth of human settlements in North Africa. In this study, we made use of DMSP-OLS data as a return ticket to the years of crises and we found the most affected provinces during that period. The DMSP-OLS data proved to be an index of growth in the economy during the period of stability in Algeria expressed by positive dynamic changes in the lighted area in all Algerian provinces. We used NTL data as an alternative to annual growth indexes for each province, which are unavailable, and its help as a monitoring system for socioeconomic parameters to fill the gap of data availability. We also proposed nighttime light remote sensing data as a useful tool to control and reduce CO2 emissions in Algeria’s petroleum sector.
1. INTRODUCTION
Urban areas cover three percent of the world's land surface and have a very considerable influence on their environment in terms of mass, energy, and resource flows. Urban areas are characterized by the presence of bright lights induced by humans during the night. Nighttime light imagery offers a unique opportunity to view the anthropogenic activity in the urban space. Satellite images of anthropogenic fires constitute a specific, economic and simple tool for monitoring the global distribution of urban areas and their different characteristics such as the spatiality human settlements (Elvidge et al., 1997) and (Small et al., 2005). Additional applications of Nighttime light imagery have been done to monitor population (Sutton et al., 2003) and (Elvidge et al., 1997), economic activity (Ebener et al., 2005) and (Ghosh et al., 2009), energy consumption and greenhouse gas emissions (Doll et al., 2000) and (Elvidge et al., 1997). Furthermore, we can use the study to assess natural disaster and humanitarian disasters, such as the effects of wars; refugee movements and conflict events, Syria (Li and Li, 2014), light pollution (Bennie et al., 2014). (Gillespie et al., 2014) analyzed responses of nighttime light to tsunami damage in Sumatra. In addition, we can use nighttime light remote sensing imagery for obtaining fishery information (Waluda et al., 2004). Furthermore, Nighttime light data can be used to study public health (Bharti et al., 2011). (Elvidge et al., 2009) analyzed gas flaring using time series of nighttime light imagery from 1994 to 2008.
The Defense Meteorological Satellite-Program (DMSP) Operational Linescan-System (OLS) from the US Department of Defense is a satellite program managed by the Air Force Space Command with in-orbit operations provided by the National Oceanic and Atmospheric Administration. It is the only satellite sensor that has gathered light-sensitive imagery data and cartography of urban light. This sensor is different from the passive optical remote sensor in that the data can be obtained at night and is sensitive to other sources of light and can even detect minimum terrestrial radiation (Elvidge et al., 1997) and (Elvidge et al., 2007).
The nighttime light remote sensing data from DMSP-OLS program provides a source easy to use multi-dimensional modeling of various socioeconomic parameters. The data archive from DMSP-OLS includes nighttime light data for the period from 1992 to 2013 and provides an unlimited capablbility to exploit opportunities for long-term monitoring of urban growth and detection of changes in anthropogenic activity at different scales from global to regional and local scales (Doll et al., 2000) and (Sivek et al., 2012).
Night time light data provide monitoring of population growth and the development of economic activity from space (Cincotta and Engelman, 1997). First, our study provides a global model with a unique spatial and temporal perspective of change in population and economic activities, which are listed in nighttime light applications (Twumasi and Merem, 2006). It has a special advantage in providing data in countries that have of lack data in the world. One of these countries Algeria, located in North Africa is the largest country in Africa. It has one of the largest economies in the region and has large and fast growth indicators. However, annual growth indicators for each province are unavailable in the country. The country is very rich in natural resources such as oil and natural gas and is an active member of OPEC with a good potential for economic and social development. However, the control based on advanced remote sensing has become routine to precisely monitor the social and
economic development at both national and sub-national levels (Hadjimitsis et al., 2004). Many important publications examine the relationship between light intensity and economic activities, in China (Li et al., 2013b), the United States (Forbes, 2013), the European Union (Doll et al., 2006) and in other countries. However, these type of studies have not yet covered the region of North Africa, therefore this paper intends to fill that gap.
2. DATA:
In this study we used three types of datasets, the first data is DMSP nighttime light remote sensing images from 1993 to 2012 from (NOAA-NGDC, 2016), Landsat images (Landsat 8) data together with socioeconomic data in Algeria delivered from Algerian National Office of Statistics (NOS, 2011), (NOS, 2016), (NOS, 2017a) and (NOS, 2017b). In addition to these data sets, we used other data observations by official bodies (OPEC, 2017) and also we used open sources data such as World Bank Group (BDG, 2017).
2.1. DMSP Data:
Since the mid-1970s, (NOAA-NGDC, 2016) has operated the Defense Meteorological Satellite Program's Operational- Linescan System (DMSP-OLS) which contains digital archived the images acquired since 1992 (Huang and Fu, 2016). All sensors are flown on a sun-synchronous system, have low altitude, the polar orbit and are designed to collect global cloud images (Baugh et al., 2010) and (Elvidge et al., 2004) and (Elvidge et al., 2009). The sensors have one single resolution of 560 m. However, onboard averaging of this dataset into five by five blocks produces a “smoothed” data collection with a resolution of 2700 m (Baugh et al., 2010) and (Elvidge et al., 2004). Each sensor in this program collects 14 orbits daily in 3000 km swaths which provide for complete global coverage four times during the day at dawn, daytime, twilight and nighttime (Elvidge et al., 2004) and (Elvidge et al., 2009). The visible band at night is increased using a photomultiplier tube (PMT), that can allow the sensors to detect clouds lightened by moonlight (Elvidge et al., 2004), (Elvidge et al., 2009) and (Huang and Fu, 2016). The PMT boosts the detection of nighttime light from DMSP-OLS imagery that allows the sensors to detect moonlit clouds low light (Small et al., 2011).
At least one satellite in this program is operated each year. However, as the satellites and sensors age, the quality of data produced decreases and they must be replaced. In most years there are therefore two satellites collecting data (Elvidge et al., 2009). The (NOAA-NGDC, 2016) produces three annual nighttime light product collections from this data which are open source and freely available to the public; cloud-free, average visible light, and stable lights composites. Moreover, a
radiance calibrated and an average lights x pct dataset are produced from this data.
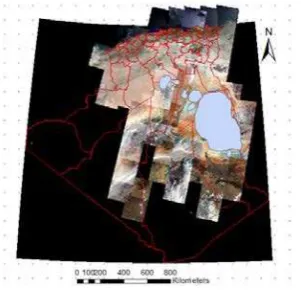
Figure 1. Temporal-spatial changes in DMSP/OLS lit areas of Algerian provinces between 1993 to 2012.
2.2. Landsat data:
In this study, we also used Landsat-08 ETM+ images acquired from May 10th 2016, to July 29th, 2016; respectively. The images had level 1 G processing and a 30 m cell size. The pre-processing included common steps for treatment of satellite images such as geometric and atmospheric correction as well as geo-referencing. The images were then projected to a geographical projection (WGS 84 datum) in order to be comparable with the DMSP-OLS data, to delimit the area of gas flaring in all Algeria, and also we covered the polygon data of gas flare because Algeria has a big production of oil and gas.
Figure 2. Determination of gas flaring polygons in Algeria using Landsat 8 images.
2.3. Socioeconomic parameters and Auxiliary Data
We assembled a chronological series of statistical data on the GDP and the urban population extending over the last twenty (20) years (1993-2012) for 48 provinces in Algeria and municipalities of the derivative Algerian National Office of Statistics (NOS, 2011), (NOS, 2016), (NOS, 2017a) and (NOS, 2017b). also we used socio-economic parameters and auxiliary data sets from a number of sources. The data sets utilized are listed in Table 1.
Socioeconomic data
Spatial
level Period Source
Population National 1993 to 2012
The National Office of Statistics, (2011,2017)
Population Provincial 1998 and 2008 The National Office of Statistics, (2017)
GDP National 1993 to 2012 The National Office of Statistics and World Bank Group data (2016).
Electricity
Consumption National
1993 to 2012
The National Office of Statistics, World Bank Group data.(BDG, 2017)
CO2
Emissions National
1993 to 2012
World Bank Group data. (BDG, 2017)
Oil and Gas Consumption National
1993 to 2012
The National Office of Statistics (NOS, 2016) World Development Indicators,(BDG, 2017)
Oil and Gas production National
1993 to 2012
the United States Energy Information Administration (USEIA, 2017) and OPEC (OPEC, 2017)
Administrative
Areas (shapes) National Actual (DIVA-GIS, 2017) Place
coordinates Settlements Actual
(DIVA-GIS, 2017) and (UN–
Table 1. Socio-economic Parameters and Data Sets used in this study.
3. METHODS
The nighttime light datasets were acquired by six (06) different satellites [F10], [F12], [F14], [F15], [F16] and [F18] spanning 22 years without onboard calibration. An important correction nighttime light imagery was done to improve the DMSP-OLS data comparability and accuracy (Jiang et al., 2017) and (Li et al., 2013a). In order to obtain a research dataset for our study, we created a workflow to process the time-series nighttime light images (Figure 3). This includes three (03) steps; (01) model establishment, (02) image calibration and (03) Light separation.
3.1. Establish Model
The six satellites (06) of DMSP-OLS program without onboard calibration, were used to generate the time series of nighttime light imagery. these data set are inconsistent in the digital number (DNs) values (Li et al., 2013a) and therefore cannot be applied to perform comparative analysis directly, (Letu et al., 2012) and (Cao et al., 2015). Thus, development of a model is required to improve the image comparability. (Elvidge et al., 2009) suggested a reference area method which combines reference images to establish a long-term time series nighttime light model. The reference area is directly related to the performance of the model. According to this assumption, the reference area has two conditions: (1) the socio-economic development in the reference area is a minimum, which ensures nighttime light levels show very little change; and (2) the area should cover all of the gray levels of nighttime light images to ensure model universality. In (Elvidge et al., 2009) method, Sicily in Italy was selected as a reference area and scattergrams of the digital number (DNs) values for each satellite versus F121999 were examined.
3.2. Images Calibration
3.2.1. Inter-calibration: each image for DMSP-OLS data
collection in this study was inter-calibrated by band math using the ENVI 5.1 software following to the Table of inter-calibration coefficients (Elvidge et al., 2014), and the digital number (DNs) values below 0 were assigned to 0, while digital number (DNs) values above 63 were assigned to 63.
3.2.2. Inter-annual composition: in the same year (S), two types of sensors were used to obtain the nighttime light images, for example, [F15] and [F16]. In order to make full use of DMSP-OLS data from multiple sensors (Jiang et al., 2017).
where ��(��,�) and ��(��,�), represent the image �� values of
sensor a and sensor b respectively, at the pixel n after the inter-calibration in year S. ��(�,�) represent image DNs values at the
pixel n after the inter-annual composition in single year S.
NTL DMSP-Etraction of DN in
Reference area
Figure 3.The process flow of DMSP/OLS nighttime light imagery.
3.2.3. Inter-annual series correction: Over the past 20
years, most cities in Algeria have experienced continuous expansion. It can be assumed that, in particular area, digital number (DNs) values in a latter year should be no less than that seen in the previous year. Thus, the inter-annual series correction method was employed to calibrate time-series of nighttime light images (Cao et al., 2015) and (Elvidge et al., 2014). The calibration can be divided into the following cases: (1) If the digital number (DN) value is 0 in the latter year, it should be 0 in the previous year; (2) when the digital number (DN) value is above 0, the digital number (DN) value in the previous year should be less than that in the latter year; and (3) in other cases, the image digital number (DN) value remains the same (Liu et al., 2012). Based on this principle, the correction formula is as follows:
��(�,�)=
represent the DN value of pixel n after inter-annual composition in single year � −1, single year �, and single year �+ 1.
3.2.4. Post-Image Processing: Each composite was made on
the Algerian landmass to produce a total of 2428 by 2178 composites pixels, covering 18 ° 57 '36 "N at 37 ° 5' 42" N and 8 ° 40 '25 "W at 11 ° 59 '19 "E. These represent twenty (20) years of data with some years having several composites as a result of the multiplicity of satellites in orbit.
3.3. Light separation
To separate between light emitted from human settlements and emissions observed from gas flares in Petroleum areas in Algeria, gas flaring area is used to dispose of dissolved natural gas from petroleum in production areas and processing facilities
(Elvidge et al., 2009). Thus, the gas flares are not representative of human settlements, and it was considered appropriate to exclude them from the analysis. While all gas flares from Algeria are located in the Sahara Desert, south of the country. The gas flares have been separated using a data set of ESRI shapefiles available from NOAA-NGDC; (NOAA, 2017) which contains polygons outlining the location of gas flares for Algeria. But for extracting the gas flares polygons from the new gas flaring areas for each province, we used the visual analyses with Landsat 8 images.
4. RESULTS
4.1. Nighttime Light dynamic change at the National Scale
After image calibration of the long-term time series nighttime light imagery from 1993 to 2012, the errors can be eliminated efficiently. This improved the consistency of the image and laid the foundations for the light domain analysis in Algeria.
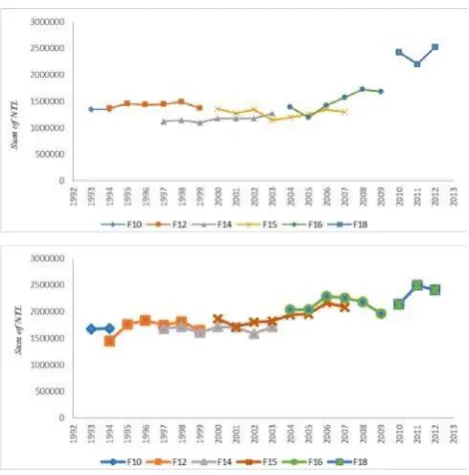
Figure 4. Inter-calibration sum of NTL, in Algeria 1993 to 2012.
a)The original sum of the DNs values from nighttime Light data.
b)The sum of the DNs values after inter-annual series correction.
And after separation is made between light detected from human settlements and light detected from gas flaring in order to allow us to study human settlements without other light emissions and then assess the suitability of using DMSP data in southern Algeria and its ability to monitor gas flaring in the oil-extracting and natural gas provinces. The DMSP can help in estimating flared gas volume and develop calibration with a national data set of gas flaring volumes reported and data from individual flares. (Elvidge et al., 2009). The objective of the separation between the sum of light values from human settlements and the sum of light values from the gas flaring is to make it easier to study human settlements without other light emissions. This also made it possible to get the results with a strong relationship between DMSP-OLS urban lit area and the socioeconomic data of Algeria over the twenty-year period.
Another goal of this separation between two sum of lights (gas flaring and settlements areas) is that DMSP-OLS data could be used for the monitoring of natural gas flaring (Elvidge et al., 2009), (Sivek et al., 2012) and (Huang and Fu, 2016) in the
oil-(A)
extracting and natural gas production areas in south of Algeria which are five (05) provinces: Ouargla, Laghouat, Illizi, Ghardaïa and Tamanghasset.
The Lighted Areas in human settlements increased more than 109% between 1993 and 2012, but this growth isn’t stable where several known stages of the rise and fall of growth according to phases of the country. In 1994 the lights in urban and rural areas were decreasing more than (-4%).
Figure 5. Growth sum of light observed from human settlements and the light from gas flaring in Algeria (1993-2012).
The largest listed indicators in the nighttime lights emission in urban and rural areas were in the period between 1999 and 2004 with growth of 34%, which is the period following the security crisis. Between 2004 and 2011 the growth was around of 28%, but the period between 1993 and 1999 was the worst phase of growth of the sum of lights in human statements less than 12%.
Figure 6. Changes the sources light emissions in Algeria.
The light emission from gas flaring decreased more than (-42%) in Algeria between 1993 and 2012 This is not the cause of low oil and natural gas production, but the production is known to be rising between (+31%) and (+61%) respectively. The real reason, however, is the Algerian Government’s policy of reducing CO2 gas emissions and gas recirculation from oil-extraction and use it in liquefied gas production.
The total possession of light emissions in Algeria that were detected by DMSP images in gas flaring area changed from more than (43%) in 1993 to limit of (17) % in 2012 (Figure. 6) of overall proportion of light emissions in Algeria.
4.2. Detecting and tracking spatiotemporal dynamic
changes in all Algerian Provinces
The security and economic crises resulted in residents of some rural areas being displaced to safe areas in big cities. This period lasted for seven years (1992 to 1999) and many of the settlements or small rural settlements, especially small towns which have one economic activity, were completely or partially abandoned and remained uninhabited after the crisis. The return
of the population to rural areas makes the major difference after the stability phase in security and in economy. An example in figure 8 shows the most affected regions in the Algerian security crisis, this region, located in north central of Algeria, has more than ten (10) provinces including the capital Algiers.
Figure 7. Zoom area north central of Algeria
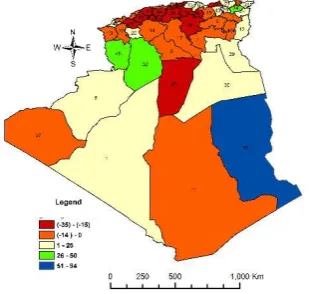
By using the difference of the sum in digital number between years 1993 and 1994 the results of this experiment were very interesting, the provinces which have huge increases in nightlights were located in north center of Algeria including the capital province Algiers Chlef, Ain Defla, Médéa, Relizane, Mascara, Tissemsilt, Blida, M'Sila, Boumerdès, Bordj Bou Arréridj, Jijel and Bouïra Province and one province from south of Algeria, Ghardaïa Province. See Figure 8
Figure 8. The most provinces affected by security crisis in 1994.
Figure 9. Sum of light in Algerian provinces in this last twenty years.
The largest growth range of the NTL was in northeast centre of Algeria which are five (05) Provinces: Sétif, Bordj Bou Arréridj, Mila, M’Sila and Batna. The slowest growth range of the NTL was in five provinces that are located in the extreme north of Algeria which are Oran, Annaba, Algiers and Blida, and one located in the south of Algeria which is Ouargla Province, the reason is the saturation in lights that happens in almost all cities of any size in the world. (Letu et al., 2012).
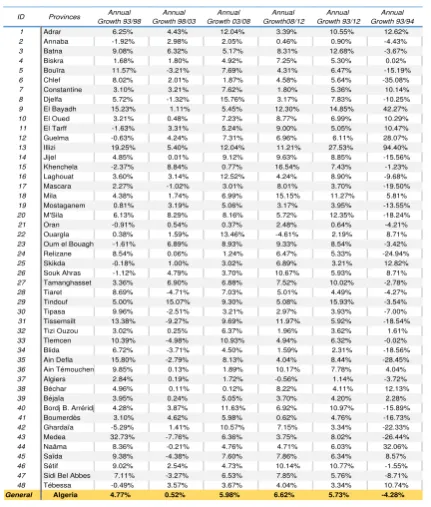
We also found 20 provinces which have an annual index of change less than the general average of annual growth (5,45%) which are respectively: Constantine, Relizane, Biskra, El Tarff, Boumerdès, Tiaret, Béjaïa, Béchar, Mostaganem, Tipasa, Mascara, Tizi Ouzou, Tébessa, Ghardaïa, Skikda, Blida, Ouargla, Algiers, Annaba, Oran Province. And then 28 Provinces have larger than the general average (5,45%) which are respectively: Illizi, Tindouf, El Bayadh, Batna, M'Sila Mila, Bordj Bou Arréridj, Sétif, Adrar, Tamanghasset, Laghouat, Jijel, Oum el Bouaghi, Ain Defla, Medea, Djelfa, Ain Témouchent, Khenchela, El Oued, Bouïra, Saïda, Tlemcen, Guelma, Naâma, Souk Ahras, Tissemsilt, Sidi Bel Abbes and Chlef Province. shown in Table 2
Table 2. Annual growth of nighttime light in Algerian provinces between 1993-2012.
4.3. Estimating Socioeconomic parameters using
DMSP-OLS data
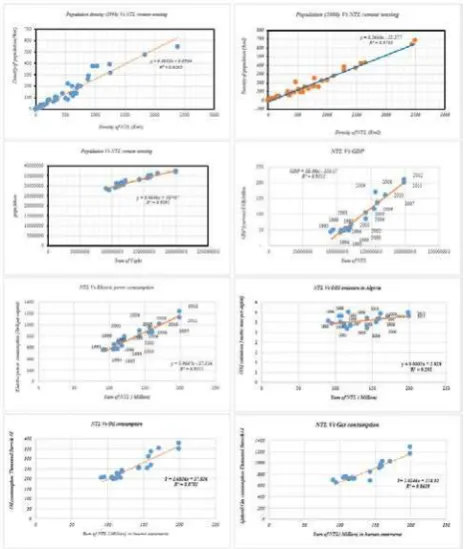
This study shows that the relationship between socioeconomic parameters such as the number of people in urban and rural areas, GDP, CO2 emissions and the consumption of electricity, oil and natural gas with light observed by satellites of nighttime light data, can be accurately quantified using bright areas of nighttime light from DMSP-OLS data. Data of nighttime light delivered by DMSP-OLS images responded strongly to these characteristics (Table 3). Most of the obtained models of regression using lighted areas derived from DMSP-OLS images and significant statistical data, indicate how very convenient the night data is in estimating all socioeconomic parameters in our study about Algeria which has faced a shortage of this type of data. The use of total lights in bright areas also revealed their high suitability for tracking the contraction of Algeria’s socioeconomic development due to the transition from a socialist and prompt economy to a free capitalist economy and the impact of oil prices on overall growth. The recovery and the fast growth of Algeria’s socioeconomic parameters in the first decade of the 21st century following of civil concord and national reconciliation also could be detected and observed very clearly by the DMSP-OLS data. Furthermore, we found the increase of population density in settlement areas offset by decline of per capita nighttime light, and increasing the per capita of light in less populous areas. Figure 9
Spatial
level Period Regression equation
R²
Density POP = 0.2644(Lit/km2)-
13.277 0.9702 0.001
Table 3. Regression Equations for Estimating Socioeconomic by using the Lighted area (Lit) from DMSP-OLS data.
The relationship between nighttime light and socioeconomic parameters was very strong such as population at both levels, national (R2 = 0.929) and provincial (R2=0.925, 1998) (R2=0.970, 2008). The relationship was also strong with Gross Domestic Product in Algeria (R² = 0.9355), Electric Power Consumption (R² = 0.9355). There is a strong relationship between oil and natural gas consumption, respectively (R2 = 0.87, R2 = 0.86). Figure 10
ID Provinces Annual Growth 93/98
1 Adrar 6.25% 4.43% 12.04% 3.39% 10.55% 12.62%
2 Annaba -1.92% 2.98% 2.05% 0.46% 0.90% -4.43%
3 Batna 9.08% 6.32% 5.17% 8.31% 12.68% -3.67%
4 Biskra 1.68% 1.80% 4.92% 7.25% 5.30% 0.02%
5 Bouïra 11.57% -3.21% 7.69% 4.31% 6.47% -15.19%
6 Chlef 8.02% 2.01% 1.87% 4.58% 5.64% -35.08%
7 Constantine 3.10% 3.21% 7.62% 1.80% 5.36% 10.14%
8 Djelfa 5.72% -1.32% 15.76% 3.17% 7.83% -10.25%
9 El Bayadh 15.23% 1.11% 5.45% 12.30% 14.85% 42.27%
10 El Oued 3.21% 0.48% 7.23% 8.77% 6.99% 10.29%
11 El Tarff -1.63% 3.31% 5.24% 9.00% 5.05% 10.47%
12 Guelma -0.63% 4.24% 7.31% 6.96% 6.11% 28.07%
13 Illizi 19.25% 5.40% 12.04% 11.21% 27.53% 94.40%
14 Jijel 4.85% 0.01% 9.12% 9.63% 8.85% -15.56%
15 Khenchela -2.37% 8.84% 0.77% 16.54% 7.43% -1.23%
16 Laghouat 3.60% 3.14% 12.52% 4.24% 8.90% -9.68%
17 Mascara 2.27% -1.02% 3.01% 8.01% 3.70% -19.50%
18 Mila 4.38% 1.74% 6.99% 15.15% 11.27% 5.81%
19 Mostaganem 0.81% 3.19% 5.06% 3.17% 3.95% -13.55%
20 M'Sila 6.13% 8.29% 8.16% 5.72% 12.35% -18.24%
21 Oran -0.91% 0.54% 0.37% 2.48% 0.64% -4.21%
22 Ouargla 0.38% 1.59% 13.46% -4.61% 2.19% 8.71%
23 Oum el Bouaghi -1.61% 6.89% 8.93% 9.33% 8.54% -3.42%
24 Relizane 8.54% 0.06% 1.24% 6.47% 5.33% -24.94%
25 Skikda -0.18% 1.00% 3.02% 6.89% 3.21% 12.82%
26 Souk Ahras -1.12% 4.79% 3.70% 10.67% 5.93% 8.71%
27 Tamanghasset 3.36% 6.90% 6.88% 7.52% 10.02% -2.78%
28 Tiaret 8.69% -4.71% 7.03% 5.01% 4.49% -4.27%
29 Tindouf 5.00% 15.07% 9.30% 5.08% 15.93% -3.54%
30 Tipasa 9.96% -2.51% 3.21% 2.97% 3.93% -7.00%
31 Tissemsilt 13.38% -9.27% 9.69% 11.97% 5.92% -18.54%
32 Tizi Ouzou 3.02% 0.25% 6.37% 1.96% 3.62% 1.61%
33 Tlemcen 10.39% -4.98% 10.93% 4.94% 6.32% -0.02%
34 Blida 6.72% -3.71% 4.50% 1.59% 2.31% -18.56%
35 Ain Defla 15.80% -2.79% 8.13% 4.04% 8.44% -28.45%
36 Ain Témouchent 9.85% 0.13% 1.89% 10.17% 7.78% 4.04%
37 Algiers 2.84% 0.19% 1.72% -0.56% 1.14% -3.72%
38 Béchar 4.96% 0.11% 0.12% 8.22% 4.11% 12.13%
39 Béjaïa 3.95% 0.24% 5.05% 3.70% 4.20% 2.28%
40 Bordj B. Arréridj 4.28% 3.87% 11.63% 6.92% 10.97% -15.89%
41 Boumerdès 3.10% 4.62% 5.98% 0.62% 4.76% -16.73%
42 Ghardaïa -5.29% 1.41% 10.57% 7.15% 3.34% -22.33%
43 Medea 32.73% -7.76% 6.36% 3.75% 8.02% -26.44%
44 Naâma 8.36% -0.21% 4.76% 4.71% 6.03% 32.06%
45 Saïda 9.38% -4.38% 7.60% 7.86% 6.34% 8.57%
46 Sétif 9.02% 2.54% 4.73% 10.14% 10.77% -1.55%
47 Sidi Bel Abbes 7.11% -3.27% 6.53% 7.85% 5.76% -8.71%
48 Tébessa -0.49% 3.57% 3.67% 4.04% 3.34% 10.74%
Figure 10. Relationship between NTL remote sensing and Socioeconomic Parameters in Algeria.
The relationship between the sum of lights and total CO2 emission of Algeria at national level for the years 1993–2012 was very weak (R2 = 0.202). This could be due to the Algerian Government’s policy of reducing CO2 gas emissions and stopping these practices that are harmful to the environment.
4.4. Development of Oil and Gas production versus lights
observed from gas flaring in Algeria
Contrary to the previous results in this section of our analysis, we used the total lights from gas flaring areas detected in DMSP-OLS imagery to study the development of gas flaring and try to understand its relationship with oil and gas production in Algeria. The datasets used in our analysis are shown in Figure 11 with data on oil and natural gas production in thousands of Barrels per day and the sum of lights detected in gas flaring areas in hundred thousand units.
Figure 11. Development of Oil and Natural Gas Production with NTL in Algeria between 1993-2012.
DMSP-OLS nighttime light data can have another potential application of monitoring natural gas flaring in Algeria’s five provinces located south of the country. The satellite observation of lights at nighttime over the oil-extracting and natural gas
production provinces in Algeria may provide useful information in estimating the volumes of gas loss during the flaring process and reduce the emissions of CO2. Furthermore, we can use this information to improve the performance of operations for oil and gas companies, and to put an end to the process of gas flaring in Algeria.
Table 4. Global of lights observed by DMSP data in gas flaring area of each Algerian province which have oil and natural gas
production.
Satellite information based on DMSP images on gas flaring in the People’s Democratic Republic of Algeria showed that flaring emissions are on the decrease between 1993 and 2012 in four Provinces; Ouargla (-36), Illizi (-29%), Ghardaïa (-73) and Laghouat (-67%) but is increasing in Tamanghasset province because it has little production and new discoveries with increases of up to 558% from 2001 to 2012. (Tab 4 and Fig 12)
Figure 12. Global of lights (million unite) observed by DMSP data in gas flaring area
5. SUMMARY AND CONCLUSIONS:
This work has presented the first results of the assessment of DMSP-OLS nighttime light data used in tracking growth of lighted areas to monitor socioeconomic parameters, CO2 emissions and development of hydrocarbon filed in the People's Democratic Republic of Algeria, tenth-largest country in the world (in land area) and the largest African country and in Arabic world. The use of nighttime light data to monitor socioeconomic parameters has significant advantages in data-impoverished countries such as Algeria, particularly with respect to the potential frequency of the data acquisition.
Using DMSP-OLS data, should be able to monitor the socioeconomic parameters on an annual basis. With regard to the economic crisis (1986-1999) and the financial prosperity
Province Ouargla Illizi Ghardaïa Laghouat Tamanghasset Total
1993 27.47 26.63 10.65 6.71 0.04 71.51
1994 29.37 21.32 7.99 6.54 0.02 65.24
1995 32.82 23.69 7.92 5.93 0.03 70.39
1996 37.02 25.47 7.22 4.44 0.04 74.19
1997 27.34 21.76 5.9 4.23 0.05 59.3
1998 25.26 22.92 5.68 4.12 0.06 58.04
1999 26.32 21.14 4.73 3.66 0.03 55.87
2000 32.92 22.93 6.61 3.71 0.04 66.21
2001 26.4 22.24 3.3 3.09 0.04 55.08
2002 22.33 20.49 3.05 2.83 0.14 48.84
2003 28.49 21.06 3.46 3.02 0.21 56.25
2004 25.62 22.85 4.09 3.46 0.3 56.32
2005 27.01 22.14 3.87 3.28 0.18 56.49
2006 34.5 25.92 2.99 3.4 0.17 66.98
2007 28.18 23.46 2.51 2.53 0.18 56.86
2008 29.95 24.89 2.65 2.72 0.18 60.38
2009 16.59 14.51 2.12 2.3 0.22 35.75
2010 22.56 16.48 1.55 1.85 0.24 42.68
2011 24.5 20.13 2.84 2.45 0.3 50.22
2012 17.46 18.91 2.87 2.2 0.28 41.72
period that followed due to high oil prices, the political challenges (1989) and the ensuing period of transition from a socialistic planned to a liberal market economy, the security problem (1992-1999) and the results of civil concord and national reconciliation in the stabilization and sent a new period of developments in so many fields of the country, together with the impact of each of these stages on each of the forty-eight provinces in Algeria during the twenty years stretching from 1993 to 2012. Separation of light detected from human settlements and light detected from gas flaring, was done to allow the study human settlements without other light emissions and to examine the ability of DMSP data, in southern Algeria, to monitor gas flaring in the oil-extracting and natural gas provinces.
DMSP/OLS nighttime light remote sensing was used to demonstrate the temporal and spatial characteristics of Algeria’s light emissions at multiple scales. It is helpful to objectively and accurately understand the nighttime light of the population dynamics and economic changes. Moreover, this work can be of benefit to the government for policy-making and equality problem between all Algerian Provinces in terms of local development. This paper also proposed the nighttime night data as a powerful tool to help control and reduce CO2 emissions in gas flaring in Algeria and supporting government policies to stop these practices that are harmful to the environment.
ACKNOWLEDGMENT
The author is grateful to Dr. Li Xi from Wuhan University for his careful revision of this paper, especially for the help he provided me from the beginning, both on the administrative and the technical sides. I profited from an excellent resources availed to me and the deep know-how from different people, especially in the field of ArcGIS, which was completely new to me (a special thank goes here to Bouchachi Brahim for his expertise, helpfulness and especially patience.
REFERENCES
Baugh, K., Elvidge, C. D., Ghosh, T., and Ziskin, D., 2010. Development of a 2009 stable lights product using DMSP-OLS data. Proceedings of the Asia-Pacific Advanced Network, 30, pp. 114-130.
BDG, 2017, the World Bank Group Data World Development Indicators,Algeria:World.Bank.2017.http://databank.worldbank. org/data/reports.aspx?source=2&country=DZA#.(22 Feb. 2017).
Bennie, J. J., Duffy, J. P., Inger, R., and Gaston, K. J., 2014, Biogeography of time partitioning in mammals. Proceedings of the National Academy of Sciences, 111(38), pp. 13727-13732.
Bharti, N., Tatem, A. J., Ferrari, M. J., Grais, R. F., Djibo, A., and Grenfell, B. T., 2011. Explaining seasonal fluctuations of measles in Niger using nighttime lights imagery. Science, 334 (6061), pp. 1424-1427.
Cao, Z., Wu, Z., Kuang, Y., and Huang, N., 2015. Correction of DMSP/OLS night-time light images and its application in China. J. Geo-Inf. Sci, 17, pp. 1092-1102.
Cincotta, R. P., and Engelman, R., 1997.Economics and rapid change. the influence of population growth.
DIVA-GIS, 2017, "Spatial Data Download Administrative areas Country.Algeria,(GADM),"http://biogeo.ucdavis.edu/data/diva/ adm/DZA_adm.zip, (26 Dec. 2016).
Doll, C. H., Muller, J.-P., and Elvidge, C. D., 2000. Night-time imagery as a tool for global mapping of socioeconomic parameters and greenhouse gas emissions. AMBIO. A Journal of the Human Environment, 29 (3), pp. 157-162.
Doll, C. N., Muller, J.-P., and Morley, J. G., 2006. Mapping regional economic activity from night-time light satellite imagery. Ecological Economics, 57 (1), pp. 75-92.
Ebener, S., Murray, C., Tandon, A., and Elvidge, C. C., 2005. From wealth to health: modelling the distribution of income per capita at the sub-national level using night-time light imagery.
International Journal of health geographics, 4 (1), pp. 5.
Elvidge, C. D., Baugh, K. E., Kihn, E. A., Kroehl, H. W., Davis, E. R., and Davis, C. W., 1997. Relation between satellite observed visible-near infrared emissions, population, economic activity and electric power consumption. International Journal of Remote Sensing, 18 (6), pp. 1373-1379.
Elvidge, C. D., Cinzano, pp., Pettit, D., Arvesen, J., Sutton, p., Small, C., Nemani, R., Longcore, T., Rich, C., and Safran, J., 2007. The Nightsat mission concept. International Journal of Remote Sensing, 28 (12), pp. 2645-2670.
Elvidge, C. D., Hsu, F.-C., Baugh, K. E., and Ghosh, T., 2014. National trends in satellite-observed lighting. Global urban monitoring and assessment through Earth observation, 23, pp. 97-118.
Elvidge, C. D., Safran, J., Nelson, I., Tuttle, B., Hobson, V. R., Baugh, K. E., Dietz, J. B., Erwin, E. H., Lunetta, R., and Lyon, J., 2004. Area and positional accuracy of DMSP nighttime lights data. CRC Press. Boca Raton, FL, USA.
Elvidge, C. D., Ziskin, D., Baugh, K. E., Tuttle, B. T., Ghosh, T., Pack, D. W., Erwin, E. H., and Zhizhin, M., 2009. A fifteen year record of global natural gas flaring derived from satellite data. Energies, 2 (3), pp. 595-622.
Forbes, D. J., 2013. Multi-scale analysis of the relationship between economic statistics and DMSP-OLS night light images.
GIScience & Remote Sensing, 50 (5), pp. 483-499.
Ghosh, T., Anderson, S., Powell, R. L., Sutton, p. C., and Elvidge, C. D., 2009. Estimation of Mexico’s informal economy and remittances using nighttime imagery. Remote Sensing, 1, (3), pp. 418-444.
Gillespie, T. W., Frankenberg, E., Fung Chum, K., and Thomas, D., 2014. Night-time lights time series of tsunami damage, recovery, and economic metrics in Sumatra, Indonesia. Remote Sensing Letters, 5 (3), pp. 286-294.
Hadjimitsis, D. G., Retalis, A., and Clayton, C. R., 2004. Satellite remote sensing and GIS for sustainable development in Skiathos Island, Greece. In: Proceedings Remote Sensing, International Society for Optics and Photonics, pp. 63-71.
Huang, K., and Fu, J. S., 2016. A global gas flaring black carbon emission rate dataset from 1994 to 2012. Scientific Data, 3.
Letu, H., Hara, M., Tana, G., and Nishio, F., 2012. A saturated light correction method for DMSP/OLS nighttime satellite
imagery. IEEE Transactions on Geoscience and Remote
Sensing, 50 (2), pp. 389-396.
Li, X., Chen, X., Zhao, Y., Xu, J., Chen, F., and Li, H., 2013a. Automatic intercalibration of night-time light imagery using robust regression. Remote sensing letters, 4 (1), pp. 45-54.
Li, X., and Li, D., 2014. Can night-time light images play a role in evaluating the Syrian Crisis?. International Journal of Remote Sensing, 35 (18), pp. 6648-6661.
Li, X., Xu, H., Chen, X., and Li, C., 2013b. Potential of NPP-VIIRS nighttime light imagery for modeling the regional economy of China. Remote Sensing, 5 (6), pp. 3057-3081.
Liu, Z., He, C., Zhang, Q., Huang, Q., and Yang, Y., 2012. Extracting the dynamics of urban expansion in China using DMSP-OLS nighttime light data from 1992 to 2008. Landscape and Urban Planning, 106 (1), pp. 62-72.
Mellander, C., Lobo, J., Stolarick, K., and Matheson, Z., 2015. Night-time light data. A good proxy measure for economic activity?. PloS one, 10 (10), pp. e0139779.
NOAA-NGDC, 2016. The National Oceanic and Atmospheric Association’s National Geophysical Data Center “Version 4 DMSP-OLS nighttime lights time series”, Maryland, The US <http://ngdc.noaa.gov/eog/dmsp/downloadV4composites.html> (22 Dec. 2016)
NOAA, 2017. The National Oceanic and Atmospheric Administration, "Global Gas Flaring Shapefiles_Algeria", Silver.Spring,.Maryland,U.S.,https://www.ngdc.noaa.gov/eog/in terest/gas_flares_countries_shapefiles.html, (04 Feb. 2017)
NOS, 2011, The National Office of Statistics (Algeria) "V ° General Census of Population and Housing - URBAN" The Technical Department in charge of Regional Statistics, Agriculture and Cartography, ARMATURE-Collections Statistics N ° 163/2011 Series S. Social Statistics.
NOS, 2016. The National Office of Statistics (Algeria) "Retrospective of economic accounts from 1963 to 2014". The Technical Department responsible for National Accounts, Collections Statistics N ° 197/2016 Series E. Economic Statistics N ° 85.
NOS, 2017a. The National Office of Statistics (Algeria) "Statistical Retrospective 1962 – 2011 Demography", Algiers, Algeria.http://www.ons.dz/IMG/pdf/CH1DEMOGRAPHIE.pdf. (15 Feb. 2017)
NOS, 2017b, The National Office of Statistics (Algeria) "Production and sales of Electricity 2005-2011", Algiers, Algeria http://www.ons.dz/-Energie-.html. (15 Feb. 2017)
OPEC, 2017. The Organization of the Petroleum Exporting Countries "The OPEC Annual Report", Vienna, Austria http://www.opec.org/opec_web/en/publications/337.htm. (22 Feb. 2017)
Sivek, M., Kavina, P., Jirásek, J., and Malečková, V., 2012. Factors influencing the selection of the past and future strategies for electricity generation in the Czech Republic. Energy policy, 48, pp. 650-656.
Small, C., Elvidge, C. D., Balk, D., and Montgomery, M., 2011. Spatial scaling of stable night lights. Remote Sensing of Environment, 115 (2), pp. 269-280.
Small, C., Pozzi, F., and Elvidge, C. D., 2005. Spatial analysis of global urban extent from DMSP-OLS night lights. Remote Sensing of Environment, 96 (3), pp. 277-291.
Sutton, P. C., Elvidge, C., and Obremski, T., 2003. Building and evaluating models to estimate ambient population density.
Photogrammetric Engineering & Remote Sensing, 69 (5), pp. 545-553.
Twumasi, Y. A., and Merem, E. C., 2006. GIS and remote sensing applications in the assessment of change within a coastal environment in the Niger Delta region of Nigeria.
International journal of environmental research and public health, 3, (1), pp. 98-106.
UN–Habitat, P. s. D. R. o. A., 2014, National Report on Housing for the Conference on Housing, Habitat III: The United Nations Human Settlements Programme (UN–Habitat), https://unhabitat.org/wp-content/uploads/2014/07/Algeria-National-Report.pdf.
USEIA, 2017, The US Energy Information Administration "Algeria Exports of Crude Oil and Petroleum Products by Destination". Washington, D.C., The United States
https://www.eia.gov/dnav/pet/pet_move_expc_dc_nus-nag_mbbl_a.htm. (22 Feb. 2017)
Waluda, C., Yamashiro, C., Elvidge, C., Hobson, V., and Rodhouse, P., 2004. Quantifying light-fishing for Dosidicus gigas in the eastern Pacific using satellite remote sensing.