Baseline Survey (2011) for Population,
Health and Environment Scale-up
Project in the Philippines
Richard B. Pollnac & Cherie A. Wagner
2
This document can be found at http://www.crc.uri.edu/. For more information contact:
Coastal Resources Center
University of Rhode Island Narragansett Bay Campus South Ferry Road
Narragansett, Rhode Island 02882, USA
Tel: (401) 874-6224 Fax: (401) 874-6920
Email: [email protected]
March 2012. Coastal Resources Center, University of Rhode Island
Citation:
Pollnac, R.B. and C.Wagner. 2012. Baseline Survey (2011) for Population, Health and Environment Scale-up Project in the Philippines. Coastal Resources Center, University of Rhode Island. p38.
Disclaimer:
“This document is made possible by the generous support of the American people through the United States Agency for International Development (USAID). The contents are the responsibility of the Coastal Resources Center at the University of Rhode Island as part of the Building Actors and Leaders for Advancing Community Excellence in Development (BALANCED) Project and do not necessarily reflect the views of the United States Government. This document is funded under Cooperative Agreement No. (GPO-A-00-08-00002-00).”
Cover (upper) Photo Caption: Coming Ashore in the Visayas
Cover Photo Credit: Kira Decanay
Cover (lower) Photo Caption: Sari-sari store, Humay-Humay, (Ubay )
3
Baseline Survey (2011) for Population, Health and
Environment Scale-up Project in the Philippines
BALANCED Project
Richard B. Pollnac1 & Cherie A. Wagner2
1Coastal Resources Center, University of Rhode Island
2Marine Affairs Program, University of Washington
4
Table of Contents
INTRODUCTION ... 6
ANALYSIS ... 7
Sample ... 7
Sample Characteristics ... 8
Occupations ... 9
Material Style of Life ... 10
Perceived Changes in Income and Resources ... 11
Water Sources and Waste Disposal ... 12
Reproductive Health ... 15
Health Situation ... 17
PFPI Behavioral Monitoring Survey ... 18
Coastal Resources Management Behaviors and Perceptions ... 19
CONCLUSIONS AND RECOMMENDATIONS ... 23
REFERENCES ... 25
APPENDIX I: LIST OF REPORTED OCCUPATIONS... 27
APPENDIX II: PERCENT DISTRIBUTION MATERIAL STYLE OF LIFE ATTRIBUTES ... 29
APPENDIX III: REPRODUCTIVE HEALTH QUESTIONS ... 30
APPENDIX IV: ADDITIONAL REPORTED ILLNESSES ... 31
APPENDIX V: PATH FOUNDATION PHILIPPINES BMS SURVEY ... 32
Reproductive Health (Household Well-Being) ... 32
Poverty-Environment Linkages ... 32
Environment and Empowerment ... 32
Food and Income Security ... 33
5
List of Tables
Table 1. Distribution of sample by municipality ... 7
Table 2. Distribution of selected demographic variables ... 7
Table 3. % distribution of marital status ... 9
Table 4. Number of sources of livelihood ... 9
Table 5. Distribution of relatively high frequency occupations ... 9
Table 6. Principal component analysis of MSL items ... 10
Table 7. MSL scores across maintenance and ... 11
Table 8. Perceived changes in past five years regarding income... 12
Table 9. % distribution of piped water locations ... 12
Table 10. Distribution of water sources mentioned ... 13
Table 11. % distribution of high frequency water sources mentioned first by respondents ... 13
Table 12. % distribution of toilet facilities ... 14
Table 13. % distribution of frequently reported toilet facilities ... 14
Table 14. % distribution of waste disposal methods... 15
Table 15. Distribution of responses to reproductive health questions A ... 15
Table 16. Distribution of responses to reproductive health questions B ... 16
Table 17. % distribution of current birth control methods reported ... 16
Table 18. Distribution (%) of birth control method used ... 16
Table 19. Distribution (%) of birth control method used during last sexual experience ... 17
Table 20. Distribution (%) of reported sources for contraceptives ... 17
Table 21. Distribution of diseases ... 18
Table 22. Analysis of BMS scale scores ... 18
Table 23. Selected fishing gear attributes ... 19
Table 24. % distribution of reported CRM ... 20
Table 25. % distribution of CRM beliefs and behaviors ... 20
Table 26. % distribution of CRM behaviors ... 20
Table 27. % distribution of erosion prevention ... 21
Table 28. % distribution of marine protected area benefits ... 21
6
Baseline Survey (2011) for Population,
Health and Environment Scale-up Project
in the Philippines
INTRODUCTION
The United States Agency for International Development/Philippines (USAID/Philippines) provided funding to the USAID Washington-funded BALANCED (Building Actors and Leaders for Advancing Community Excellence in Development) Project to support results-oriented population, health and environment (PHE) field activities in biodiversity-rich bioregions of the Philippines over the period from December 2010 – August 2013. The Coastal Resources Center (CRC) at the University of Rhode Island (URI), with PATH Foundation Philippines Inc. (PFPI), and Conservation International (CI)/Philippines, are the implementing agents for the BALANCED-Philippines Project.
BALANCED-Philippines is integrating a PHE strategy to advance integrated family planning (FP) and coastal resource management (CRM) activities in two key bioregions within the
country where demographic factors threaten the diversity and productivity of marine ecosystems and the sustainability of conservation gains—the Danajon Bank (DB) and Verde Island Passage (VIP).
The goal of the BALANCED-Philippines Project is to build the leadership and
implementation capacities of national and local governments and stakeholders to respond in an integrated manner to interrelated population, health and marine environmental
issues.The BALANCED-Philippines goal will be achieved through five intermediate results
(IRs):
IR1 - Improved access to family planning/reproductive health services in key bioregions (Office of Health/OH)
IR2 - Increased community awareness and support of family planning and conservation as a means to improve health, food security and natural resources (OH)
IR3 - Increased policy makers' commitment to family planning/reproductive health (FP/RH) services, CRM and integrated policies (OH & Office of Energy and Environment/OEE)
IR4 - Improved governance capacities of provincial and municipal local government units (LGUs) in the VIP and Danajon Bank marine ecosystems (OEE)
7
With support from USAID/Philippines, family planning activities are being implemented in VIP sites where ongoing coastal/fisheries management activities have yet to be integrated
with family planning/reproductive health (herein called “new” sites) and VIP and Danajon
Bank bioregions to improve and maintain PHE initiatives that were implemented by PFPI
under previous PHE projects (herein referred to as “maintenance” sites). CRM activities
will be strengthened in select BALANCED-Philippines sites. In order to assess progress toward meeting
BALANCED-Philippines Project goals and
objectives, a baseline behavior survey was conducted in select project sites in 2011.
The purpose of this report is to summarize the findings from the baseline survey for future evaluation of a sample of communities included in the scale-up of PHE activities in the Philippines. The baseline sample includes communities involved in Phase I projects (maintenance sites) as well as communities in the
proposed expansion area. This report is based on interviews conducted with village residents.
ANALYSIS
Sample:
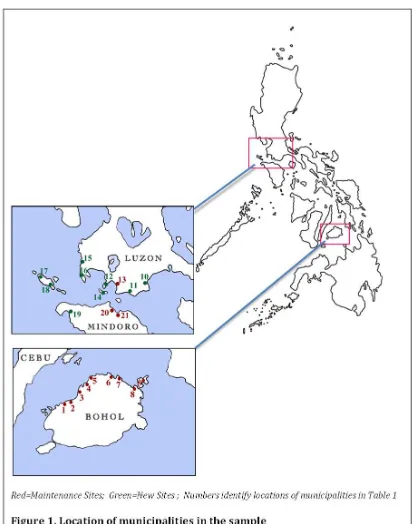
Data is derived from 20 randomly selected villages, which were involved in the earlier project (“maintenance” communities) and 20
non-maintenance (“new”) villages within 12 and nine municipalities,
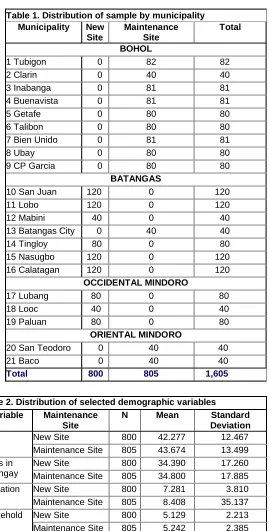
respectively, in the central Philippines (Regions IV-A, IV-B, and VII). Distribution of samples by municipality can be found in Table 1. Data for the sample was collected from July through October 2011. A random sample of 20 males and 20 females was interviewed in each village.
Table 1. Distribution of sample by municipality Municipality New
Table 2. Distribution of selected demographic variables Variable Maintenance
Site
N Mean Standard Deviation
Age New Site 800 42.277 12.467
Maintenance Site 805 43.674 13.499 Years in
Barangay
New Site 800 34.390 17.260
Maintenance Site 805 34.800 17.885
8
Sample Characteristics:
Table 2 includes selected demographic characteristics for the maintenance and new sites. None of the differences are statistically significant (all p>0.01)1.
1 With a sample over 1000 setting alpha at 0.01 is more appropriate than 0.05. With alpha=0.05 extremely
9 Percent distribution of
marital status in the sample can be found in Table 3. There is no difference between the maintenance and new sites (χ2=5.047, df =
3, p=0.168).
Occupations:
Like most rural communities in
developing regions, there is a great deal of occupational multiplicity. A total of 301 sources of livelihood were reported by villagers (see Appendix I), with some households reporting up to six sources (Table 4). Table 4 indicates that 27% of respondents came from households with one livelihood source, 39% from
households with two, and 26% from
households with three. New sites had a mean of 2.2 sources of livelihood and maintenance sites had a mean of 2.1. None of these
differences are statistically significant.
Distribution of relative high frequency (>3% for total sample) occupations ranked as either first or second in importance for household livelihood sources can be found in Table 5. Tables such as Table 5 have a special
interpretation. For example, the Table shows that among the 798 respondents from the new sites, 36.5% indicated fishing as their first or second most important occupation. In the maintenance site villages, 38.5% ranked fishing as first or second. As would be
expected in rural, coastal communities in the Philippines, highest frequency primary (first or second in importance) sources of
household livelihood in order of relative importance are fishing, farming, barangay employee, fish vendor and laborer. With regard to inter-site type, statistically
significant differences, new sites tend to have more farmers, animal-raisers, fish vendors, tricycle drivers and laborers, while the
Table 3. % distribution of marital status
New Site Maintenance Total N
Single 8.312 6.948 7.625 122.000
Married 78.212 77.916 78.063 1,249.000
Partnered 7.809 6.948 7.375 118.000
Divorced/Separated/Widowed 5.668 8.189 6.938 111.000
Total 100.000 100.000 100.000
N 794.000 806.000 1,600.000
Table 4. Number of sources of livelihood
Number New Site Maintenance Total N Table 5. Distribution of relatively high frequency
Occupation Site Type %
10
maintenance sites are more likely to have more sari-sari store owners and seaweed farm operators.
Material Style of Life:
Material style of life (MSL) is used as a substitute for income since collection of reliable income data is extremely difficult, if not impossible, among small-scale producers who practice multiple occupations. Reliable income data is also difficult to obtain from small-scale fishermen due to extreme day-to-day variations in harvest. The MSL small-scale is derived from an analysis of 33 household attributes. Appendix II includes distributions of all 33 attributes across new and maintenance sites.
Although the Tables containing the 33 individual attributes in Appendix II are informative, a more efficient way to examine MSL is to create scales through the use of principal
component analysis (PCA). As a first step in the analysis, the 33 items were analyzed using PCA. The scree test was used to select the number of components to be rotated (varimax). Items with low component loadings (<0.40 on all components) were removed from the data set and the PCA was run again using the same procedures. This was continued until all items had at least a loading of 0.40 on most components. This procedure resulted in four components comprising 25 items (Table 6). Items
associated with each component are shaded in Table 6.
Most items having their highest loadings (high negative) on component 1 are
structural items associated with traditional houses—houses commonly inhabited by the poor. Some of the other structural items loading highly (high positive) are associated with more modern houses. Two of these items have higher loadings on component 4. Component 1 is therefore identified as a Low Structure component. The negative loadings complicate matters since a high negative score associated with the component would be a “high” score on the component, so the
signs on the scores will be reflected (e.g., negative turned to positive and vice versa) to ease interpretation of further analyses. The items loading most highly on component 2 definitely indicate a highly modern structure and household items in the Philippine village context. Component 2 will be simply labeled as High. Items loading highest on component 3 are all household items—no structural items. Piped water in the home manifests its highest
Table 6. Principal component analysis of MSL items
11
loading on this component, but it did not reach the 0.40 loading level. Nevertheless, it was kept in the analysis because of its importance as an indicator. Items on component 3 tend to be found in the relatively more wealthy (more like “middle class”) households in rural villages. This component will be called Medium Items. Finally, items loading most highly on component 4 are structural items. Items associated with less developed structures have negative loadings and those associated with more modern houses have positive loadings. A high score on this component indicates a relatively modern house structure in the
Philippine village context, so it will be labeled as High Structure.
Factor scores for each individual in the sample were calculated as a measure of MSL. These factor scores are based on a sum of the items weighted in accordance with the component scores and standardized with a mean of 0.0 and a standard deviation of 1.0. Hence, where items are shared (relatively high scores on more than one
component), they will contribute proportionally to their different components. Since rotation was orthogonal (varimax), the factor scores manifest 0.00 correlations with each other and provide useful measures of different dimensions of MSL. Comparison of these MSL scores across new and
maintenance sites can be found in Table 7. Table 7 indicates that less modern houses (in terms of structure) are more likely to be found in the maintenance sites. Also, the
maintenance sites tend to score lower on the High and Medium Items MSL components. The analysis in Table 7 indicates a somewhat lower standard of living in the maintenance sites.
Perceived Changes in Income and Resources:
Most households in the coastal villages covered in this report depend on the productivity of the marine environment for their livelihoods. Many of the fishing households also farm and vice versa. Earnings from fishing (or the product itself) can be used to obtain farm products and vice versa. Hence, the health of the marine environment contributes to the overall well-being of the community and its members practicing other occupations, which provide services and products to the primary producers (fishers and farmers).
The method used to measure the indicators of change in income and status of the marine resources takes advantage of the human ability to make graded ordinal judgments
concerning both subjective and objective phenomena. Human behavior is based on graded ordinal judgments, not simply a dichotomous judgment of present or absent. This level of measurement allows one to make more refined judgments concerning perceived changes, and permits the use of more powerful statistical techniques to determine differences
between communities. The technique chosen for use in this study is a visual, self-anchoring, ladder-like scale that allows for making finer ordinal judgments, places less demand on
informant memory, and can be administered more rapidly (Pollnac and Crawford 2000).
Table 7. MSL scores across maintenance and new sites
Variable Site Type Mean Standard Deviation
Low Structure*
New -0.203 0.925
Maintenance 0.199 1.030
High* New 0.167 1.178
Maintenance -0.164 0.753 Medium
Items*
New 0.093 0.982
Maintenance -0.091 1.009 High
Structure
New 0.058 1.050
12
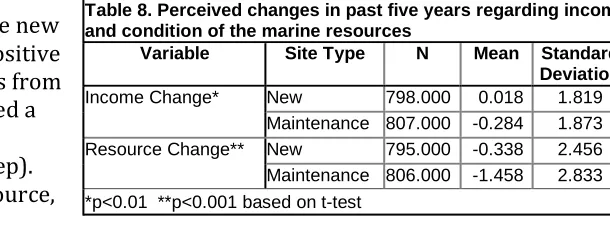
Using this technique, the respondent is shown a ladder-like diagram with 15 steps. The respondent is told that the first step represents the worst possible situation. For example, with respect to income, the respondent is told that the first step is “You have no income whatsoever and do not have enough money to buy food or shelter.” The highest step is described as “You are rich. You have enough money to buy whatever you want or need.” The respondent is then asked their situation five years ago and where they are today. With respect to condition of the resource, the respondent is told that the first step is “There are little or no fish in the sea. One can go out fishing for days and catch nothing.” The highest step is described as “There are so many fish in the sea that a fisherman can go out fishing for a very short time and fill his boat with the fish he wants.” The respondent is then asked the condition of the resource five years ago and where it is today. The perceived change is the difference between today and five years ago. These types of measures have been found to be valuable in determining perceived changes. In this report, we will refer to these scales as “self-anchoring ladder scales.” Results of the analysis of perceived changes in new and maintenance sites can be found in Table 8.
Table 8 indicates that while the new sites perceived a very slight positive change in income, respondents from the maintenance sites perceived a decrease in income (only
approximately a 1/4th scale step).
With regard to the fishery resource, individuals in the new sites
perceived a small decrease (approximately a 1/3rd scale step) while the maintenance site
inhabitants reported a negative change of about one and one-half scale step. Both of these differences are statistically significant.
Water Sources and Waste Disposal:
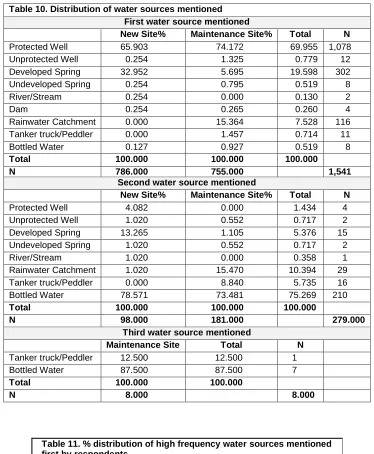
Water source – Locations of piped water in new and maintenance sites can be found in Table 9. Table 9 indicates that
new sites are more likely to have piped water in the house and less likely to have it in a public space. Respondents reported up to three sources of water. These sources can be found in Table 10. Inferential statistics are not calculated for the differences indicated in
Table 10 due to the fact that the very small cell frequencies would result in untrustworthy probabilities based on a chi-square test.
As a means of coping with this problem, all low frequency sources with regard to the first water source mentioned were converted to “other” and another tabular analysis was performed. The results of this analysis are in Table 11. Table 11 clearly demonstrates that
Table 8. Perceived changes in past five years regarding income and condition of the marine resources
Variable Site Type N Mean Standard *p<0.01 **p<0.001 based on t-test
Table 9. % distribution of piped water locations New Site Maintenance
13
maintenance sites are more likely to use a protected well or rainwater catchment (cistern) and less likely to use a developed spring source than the new sites.
Table 10. Distribution of water sources mentioned First water source mentioned
New Site% Maintenance Site% Total N
Protected Well 65.903 74.172 69.955 1,078
Unprotected Well 0.254 1.325 0.779 12
Developed Spring 32.952 5.695 19.598 302
Undeveloped Spring 0.254 0.795 0.519 8
River/Stream 0.254 0.000 0.130 2
Dam 0.254 0.265 0.260 4
Rainwater Catchment 0.000 15.364 7.528 116
Tanker truck/Peddler 0.000 1.457 0.714 11
Bottled Water 0.127 0.927 0.519 8
Total 100.000 100.000 100.000
N 786.000 755.000 1,541
Second water source mentioned
New Site% Maintenance Site% Total N
Protected Well 4.082 0.000 1.434 4
Unprotected Well 1.020 0.552 0.717 2
Developed Spring 13.265 1.105 5.376 15
Undeveloped Spring 1.020 0.552 0.717 2
River/Stream 1.020 0.000 0.358 1
Rainwater Catchment 1.020 15.470 10.394 29
Tanker truck/Peddler 0.000 8.840 5.735 16
Bottled Water 78.571 73.481 75.269 210
Total 100.000 100.000 100.000
N 98.000 181.000 279.000
Third water source mentioned
Maintenance Site Total N
Tanker truck/Peddler 12.500 12.500 1
Bottled Water 87.500 87.500 7
Total 100.000 100.000
N 8.000 8.000
Table 11. % distribution of high frequency water sources mentioned first by respondents
New Site Maintenance Site Total N
Protected Well 65.903 74.172 69.955 1,078
Developed Spring 32.952 5.695 19.598 302
Rainwater Catchment
0.000 15.364 7.528 116
Other 1.145 4.768 2.920 45
Total 100.0 100.0 100.000
N 786 755 1,541
14
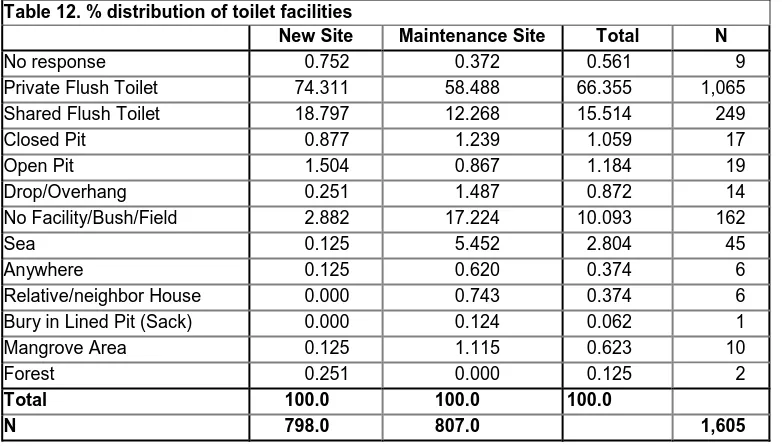
Toilet facilities – Table 12 indicates percent distribution of toilet facilities across maintenance and new sites. Once again, very small cell frequencies inhibited use of inferential statistics, so low frequency facilities were grouped as “other” and the tabular analysis was repeated. Results of this analysis are in Table 13.
Table 13 indicates that the maintenance sites have a lower percentage of private flush toilets and a higher percentage of use of bush, field, sea or other types of facilities.
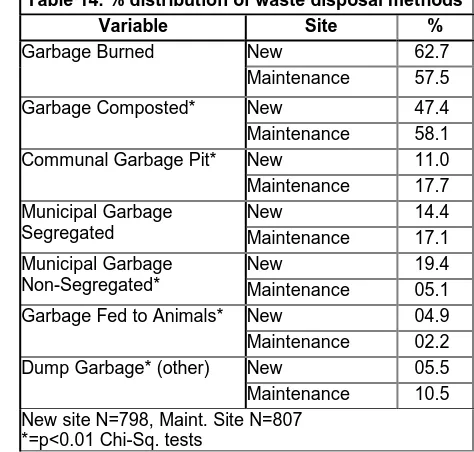
Waste disposal – Table 14 presents percent distribution of non-human waste disposal techniques. Categories in Table 14 are not mutually exclusive—respondents report using more than one garbage disposal technique. With regard to inter-site type statistically significant differences, maintenance sites are more likely to compost garbage, put it in a communal garbage pit or dump it in another location. New sites are more likely to use non-segregated municipal garbage disposal or feed it to animals.
Table 12. % distribution of toilet facilities
New Site Maintenance Site Total N
No response 0.752 0.372 0.561 9
Private Flush Toilet 74.311 58.488 66.355 1,065
Shared Flush Toilet 18.797 12.268 15.514 249
Closed Pit 0.877 1.239 1.059 17
Open Pit 1.504 0.867 1.184 19
Drop/Overhang 0.251 1.487 0.872 14
No Facility/Bush/Field 2.882 17.224 10.093 162
Sea 0.125 5.452 2.804 45
Anywhere 0.125 0.620 0.374 6
Relative/neighbor House 0.000 0.743 0.374 6
Bury in Lined Pit (Sack) 0.000 0.124 0.062 1
Mangrove Area 0.125 1.115 0.623 10
Forest 0.251 0.000 0.125 2
Total 100.0 100.0 100.0
N 798.0 807.0 1,605
Table 13. % distribution of frequently reported toilet facilities
New Site Maintenance Site Total N
Private Flush Toilet 74.874 58.706 66.729 1,065
Shared Flush Toilet 18.939 12.313 15.602 249
None/bush/field 2.904 17.289 10.150 162
Sea 0.126 5.473 2.820 45
Other 3.157 6.219 4.699 75
Total 100.00 100.0 100.0
N 792 804 1,596
15
Reproductive Health:
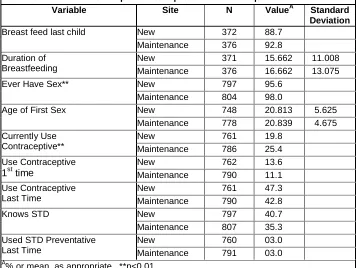
Distribution of responses to reproductive health questions D1a through D13a (see Appendix III) are in Tables 15 and 16. Table 15 indicates that the preferred number of children, number of pregnancies and number of births are greater in the maintenance site villages. Nevertheless, a greater percentage of respondents (females or male partners) from the maintenance villages who reported pregnancy in the past year, planned for that pregnancy (Alpha p<0.05 in this case due to smaller sample size).
Table 16 indicates that a slightly smaller proportion of respondents at the new sites report ever having sex. Finally, a larger
proportion of respondents at the maintenance sites report current use of contraceptives.
Percent distribution of birth control methods reported is found in Tables 17 through 19. Table 17 indicates that of the methods currently used, pills are the most frequent, followed by condoms and intrauterine device (IUD). The rest manifest relatively low percentages of use. With regard to this table,
inferential statistics would be unreliable due to low cell frequencies; hence low frequency methods (withdrawal, ligation and injection) were removed
from the tabular analysis and we find that the differences between the new and maintenance site villages are statistically significant (χ2=22.6, df = 3, p<0.001).
Table 14. % distribution of waste disposal methods Variable Site % New site N=798, Maint. Site N=807
*=p<0.01 Chi-Sq. tests
Table 15. Distribution of responses to reproductive health questions A Variable Site N ValueA Standard
16 Table 18 indicates that the
withdrawal method and condoms were most frequently mentioned as being used during the first sexual experience. These methods, in terms of frequency, were closely followed by the use of pills and the rhythm methods. Low frequency methods (injection, IUD and energy drink) were removed to allow use of inferential statistics, and the recalculation of the tabular
Table 16. Distribution of responses to reproductive health questions B
Variable Site N ValueA Standard
Table 17. % distribution of current birth control methods reported New Site Maintenance Total N
Table 18. Distribution (%) of birth control method used during first experience with sex
17 analysis indicates that differences between the maintenance and new sites are not statistically significant (χ2=5.99, df = 3, p=0.112).
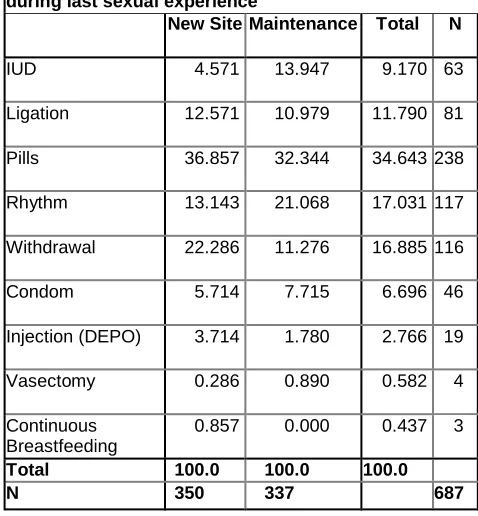
During the last sexual encounter, pills were the most common method of birth control mentioned as being used (Table 19). Next in terms of frequency were the rhythm and withdrawal methods. Ligation, IUD and condom, in order of decreasing frequency, were the next reported methods. To facilitate use of inferential statistics, extremely low frequency methods
(vasectomy and continuous breast feeding) were removed and the tabular analysis was recalculated. The differences between new and maintenance sites are statistically significant (χ2=39.8, df = 6, p<0.001).
Table 20 indicates sources reported as being used to obtain contraceptives. The public sector (reproductive health units/RHU and Barangay Health Station/BHS) are the largest source for both types of sites. Low frequency cells for community-based distributors (CBDs) and Pop Shops inhibited use of inferential statistics, so they were eliminated from the analysis and the results recalculated. It should be noted, however, that the RHUs often franchise the
Pop Shops. The recalculated results indicate that there are statistically significant differences between the new and maintenance sites (χ2=29.4, df = 2, p<0.001). Maintenance sites tend to use BHS more and a pharmacy less.
Health Situation:
To evaluate overall health, respondents were asked if any of their household members had suffered from any of a list of eight illnesses (illnesses are the 1st seven listed in Table 21)2
in the past 12 months. They were also requested to report any other illnesses that occurred in the household over the past 12 months—they reported 88 additional types of illness (see Appendix IV), with some respondents reporting up to six. Relative frequencies of the illnesses were examined, and those manifesting an occurrence of about 3% were added to the list in Table 21 for analysis.
2 Only 1 person reported sexually transmitted disease (STD) so it is not included in the analysis
Table 19. Distribution (%) of birth control method used during last sexual experience
New Site Maintenance Total N
IUD 4.571 13.947 9.170 63
18
Table 21 indicates that in comparison to the new sites, the maintenance sites manifest a higher percentage of household occurrences of severe diarrhea, skin disease and fever. Respondents in the new sites report higher
levels of malaria and high blood pressure.
PFPI Behavioral Monitoring Survey:
This section of the report analyzes results from the application of a section of a Behavioral Monitoring Survey (BMS) used by PFPI
(Appendix V). The survey was modified to reflect values in accordance with goals of PHE projects. The original PFPI BMS coding applied values from 1 to 5 for the categories “strongly agree” to “strongly disagree,” respectively. For example, for the statement “Everyone should have the right to choose how many children they want and when to have them,” “strongly agree” would be coded as 1 and “strongly disagree” as 5. Since
agreement with this statement is a goal of PHE projects, “strongly agree” is coded as 5 and “strongly disagree” as 1 in this baseline
assessment. Similarly, for the statement “Teens should NOT have access to contraceptives even if they are already having sex,” “strongly agree” is
coded as 1 and “strongly disagree” as 5 reflecting the goals of PHE efforts. In the analysis
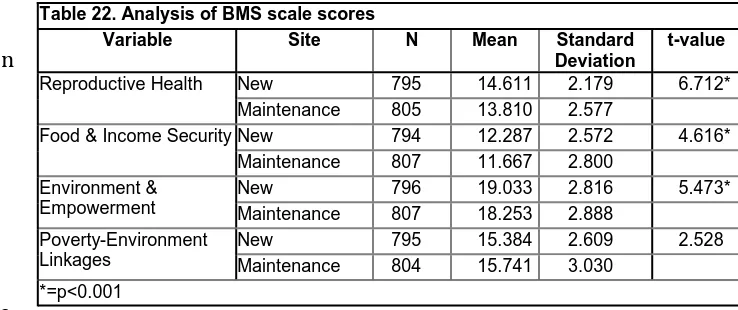
presented here, values for the responses to the distinct categories used by PFPI are summed to create a total scale score for each of the categories listed in Table 22.
Results of analyses of these scales are in Table 22. All of the hence, all means are
Table 21. Distribution of diseases
Variable Site %
Tuberculosis New 03.1
Maintenance 03.5
Jaundice New 01.9
Maintenance 03.1
Fever* New 47.5
Maintenance 61.8
Cold/Flu/Cough New 42.9
Maintenance 47.8
Table 22. Analysis of BMS scale scores
19
above the midpoint except the score for the maintenance site villages on the Food and Income Security Scale, which is only slightly below. All of the statistically significant differences (alpha=0.01)3 indicate slightly lower scale scores for the maintenance sites.
Coastal Resources Management Behaviors and Perceptions:
The final section of this report focuses on coastal resources management issues. Questions posed to community members can be found in Appendix VI. Additionally, some of the open-ended questions stimulated quite extensive responses. All these responses were coded into the data set and are made available in Appendix VI along with the questions. For example, respondents were asked if they ever asked local government officials to take actions to improve the coastal and marine environment. They provided 86 distinct responses that are included in Appendix VI. Respondents were also asked if they would support development of a marine protected area (MPA). If they already had one in the community, they were asked if they would support increasing the size of the existing MPA. Fully 103 distinct responses concerning reasons why resulted from this question, and these are also included in Appendix VI. Finally, they were asked what they did to prevent erosion, resulting in the 57 response categories included in Appendix VI.
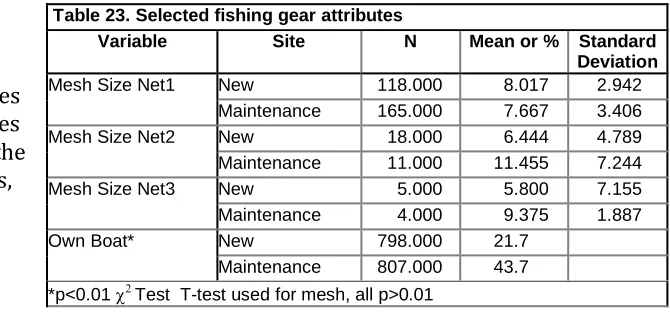
Table 23 provides information concerning attributes of selected gear types. The analysis indicates that there are no differences in net mesh size between the maintenance and new sites, but there is a greater
percentage of boat ownership in the maintenance sites. Presence or absence of
violations of selected categories of coastal resource management regulations are analyzed in Table 24. In all cases that are statistically significant, maintenance site inhabitants report a greater percentage of violations than the new sites. In most cases, the differences are relatively large. This might indicate more sensitivity to the importance of violations in the maintenance sites—a hypothesis that appears to be supported by differences in
community member knowledge and beliefs as indicated in the analysis presented in Table 25.
3 Although alpha was set at 0.01, the probabilities less than 0.01 in Table 22 are all less than 0.001 so the
lower value was used in the Table.
Table 23. Selected fishing gear attributes
Variable Site N Mean or % Standard Deviation
Mesh Size Net1 New 118.000 8.017 2.942
Maintenance 165.000 7.667 3.406
Mesh Size Net2 New 18.000 6.444 4.789
Maintenance 11.000 11.455 7.244
Mesh Size Net3 New 5.000 5.800 7.155
Maintenance 4.000 9.375 1.887
Own Boat* New 798.000 21.7
20 Most statistically significant differences
found in Table 25 indicate that maintenance site community members report knowledge, beliefs and behaviors that support coastal zone management. For example, they are more likely to report violations, participate in bantay dagat (guards of the sea), tell relatives that want to fish in local government unit
(LGU) waters to register, check outside fishers for permits, and if they do not have one, report them. They were also more likely to suggest the need to review penalties for illegal fishing and expressed the need to stop illegal fishing. The only response that is in a negative direction is that they are less likely to support existing regulations restricting fishing
activity.
Turning to the analysis presented in Table 26, we find that respondents from
maintenance sites are more likely to support MPAs and participate in beach clean-ups. They are, however more likely to cut mangrove trees than those from the new sites, and those who cut mangrove trees are almost equally divided (51% versus 49%) between those who report cutting only part of the tree or the whole tree, respectively. Most of the respondents at both types of
villages report that they pick up plastic garbage.
Table 24. % distribution of reported CRM violations Maintenance 3510 47.3 *p<0.01 χ2Test
Table 25. % distribution of CRM beliefs and behaviors Variable Site N %
Support Limits on Number of Fishers If No Permit Report
Outsider*
New 797 21.0
Maintenance 805 29.7 Know Citizen Lawsuit New 798 84.7 Maintenance 806 85.4 Need to Review Penalties
for Illegal Fishing*
New 798 15.8
Maintenance 807 23.2 Need to Clean up Beaches New 798 02.9 Maintenance 807 02.2 Need to Stop Illegal
Fishing*
New 798 08.1
Maintenance 807 13.1 *p<0.01 χ2Test
Table 26. % distribution of CRM behaviors
21
Respondents from households who did even a minimal amount of some type of farming were asked what they did to prevent erosion. The responses covered 57 types of behaviors (see Appendix VI). Behaviors mentioned by at least 3% of respondents were coded and analyzed across new and maintenance sites (Table 27). The analysis in Table 27 indicates that respondents from maintenance sites are more likely to mention planting mangroves or fruit trees while those from the new sites tend to mention planting trees in general.
Questions related to benefits of MPAs were posed in two parts of the interview. The first question asked if the respondent were aware if there is a fish, mangrove or sea grass sanctuary/reserve in their area. Maintenance site respondents were more likely to say “yes” than those interviewed in the new sites (66 versus 21%
respectively, χ2=330.7. df = 2, p<0.001). If
they were aware of a protected area or reserve, they were asked about benefits to the community. They indicated 72
perceived benefits (see Appendix VI). High frequency benefits were coded into the categories used in Table 28, which
indicates statistically significant differences
between the new and maintenance sites. Respondents from the maintenance sites are less likely to state that they do not know and more likely to indicate that MPAs protect or increase fish and provide livelihood and increase income.
Finally, respondents were also asked if they would support development of an MPA. If they already had one in the community, they were asked if they would support increasing the size of the existing MPA. Higher frequency categories (>2.5%) of the 103 responses resulting from this question (Appendix VI) were re-coded into the 17 categories analyzed in Table 29. Only four categories manifested statistically significant (alpha=0.01) differences between the new and maintenance
sites. New site respondents tend to say they would not support a reserve, but are also more likely to report that it benefits the community. Maintenance site villagers were more likely to respond that a reserve protects fish and provides fish for the future.
Table 27. % distribution of erosion prevention behaviors
22
Table 29. % distribution of reasons for supporting a marine reserve/sanctuary
Variable Site N %
Protects Sea New 798 09.3
Maintenance 807 05.9
Don’t Know New 798 05.1
Maintenance 807 04.0
Benefits Community* New 798 08.4
Maintenance 807 04.8
More Breeding Grounds New 798 01.6
Maintenance 807 03.3
Protects Fish* New 798 18.8
Maintenance 807 37.2
Improves Income New 798 13.2
Maintenance 807 15.0
Fish for the Future* New 798 02.9
Maintenance 807 05.7
Protects Marine Life New 798 08.6
Maintenance 807 05.8
Decreases Illegal Fishing New 798 05.5
Maintenance 807 03.6
Protects Breeding Area New 798 03.1
Maintenance 807 03.6
Protects Shoreline New 798 02.4
Maintenance 807 01.2
Protects Corals New 798 03.1
Maintenance 807 02.2
Prevents Disasters New 798 08.4
Maintenance 807 10.3
Limits Fishing New 798 01.4
Maintenance 807 02.5
Protects Environment New 798 03.1
Maintenance 807 02.5
Develops Village New 798 02.6
23
CONCLUSIONS AND RECOMMENDATIONS
In general, the baseline indicates that the maintenance sites have less occupational
diversity and a somewhat lower standard of living than the new sites. This is supported by the finding that the maintenance sites perceive greater negative changes in both income and status of the fishery resource. People closer to the margins in terms of available jobs, income and resources are less likely to have available time and resources for participation in project activities, especially if the benefits are not clear or too far in the future to be meaningful. Hence, they are less likely to participate in project activities, a factor most strongly related to achievement of project goals as found in a previous examination of a PHE project in the Visayas (Pollnac and Dacanay 2011). It, therefore, appears that more efforts to stimulate participation will need to be used in the maintenance sites.
There are mixed results with regard to water sources and trash disposal. For example, while maintenance sites are more likely to use a protected well or rainwater catchments (cisterns), they are less likely to use a developed spring source than the new sites. Further, maintenance sites have a lower percentage of private flush toilets and a higher percentage of use of bush, field, sea or other types of toilet facilities. These differences indicate
different needs in the two areas which are consistent with observed differences in development—the MSL scales (Table 7) indicate that less modern houses (in terms of structure) are more likely to be found in the maintenance sites, and that they also tend to score lower on the High and Medium Items MSL components. These different needs should be reflected in project plans.
In terms of health, maintenance sites manifest a higher percentage of household
occurrences of severe diarrhea, skin disease and fever, while respondents in the new sites report higher levels of malaria and high blood pressure. Disease saps energy and retards developmental growth. The higher incidence of severe diarrhea in the maintenance sites (consistent with differences in resources, income, human waste disposal and general development levels) is especially worrisome, especially if it results in malnutrition among children, which can impact their developing brains. Clearly, greater emphasis on health needs to be directed at communities experiencing higher incidences of illness, which reduce their ability to both participate and learn from project activities.
Turning to the reproductive health data, J. Castro and L. D’Agnes (2011, personal communication) report that the incidence and duration of breast feeding is higher than average in both the maintenance and new sites. Efforts should be made to support this desired activity. The results also indicate that preferred number of children, number of pregnancies and number of births are greater in the maintenance site villages.
24
contraceptives. If reduced population growth is a project objective, it is important to obtain more information to determine the complexities of these relationships.
With regard to resource management, maintenance site inhabitants report a greater percentage of violations than the new sites. In most cases, the differences are relatively large. This might indicate more sensitivity to the importance of violations in the
maintenance sites—a hypothesis that appears to be supported by differences in
community member knowledge and beliefs as indicated in the analysis presented in Table 25, where we find that maintenance community members report knowledge, beliefs and behaviors that support coastal zone management. This is further reflected in the finding that respondents from maintenance sites are more likely to support and be aware of MPAs and participate in beach clean-ups. They are, however, more likely to cut mangrove trees than those from the new sites. Further, they are less likely to support existing regulations restricting fishing activity. These last two findings are probably related to lower levels of income and resources in the maintenance sites and consistent with their views that protected areas protect or increase fish and provide livelihood and increase income. This suggests that rationales for resource protection should focus on increasing human, not natural, well-being.
Finally, all of the statistically significant differences on BMS scales indicate slightly lower scale scores for the maintenance sites. This is important due to the fact that the BMS scales reflect most of the goals of integrated PHE initiatives. The fact that the maintenance sites, which have been the targets of previous integrated PHE projects manifest slightly lower scores on these scales, is consistent with the findings of Pollnac and Dacanay (2011). Their finding that project participation was the strongest predictor of expected outcomes at the individual level indicates a need to focus on increasing participation levels in the current project if we want the project’s efforts to impact more than a small percentage of villagers.
Many researchers and field practitioners have been developing methods for increasing the amount and quality of public participation in project activities. Five aspects of participation have been identified as essential: 1) opportunity for input by local inhabitants; 2) local inhabitant influence over decisions; 3) adequate information exchange between project personnel and local inhabitants; 4) transparent decision making by project personnel; and 5) local inhabitant perceptions of fairness of decisions (Chess and Purcell 1999, Creighton 2005, Dalton 2006, Glass 1979, NRC 2008, Renn et al. 1995, Rogers 1996, Rowe and Frewer 2000, Rowe et al. 2008, Webler and Tuler 2002). Finally, Pollnac and Dacanay (2011) also report that aspects of community context (population size and density, percent Catholic and level of project integration) and individual characteristics (education, marital status and number of children) were good predictors of participation in maintenance sites in the Visayas.
With the above specifics in mind, we make the following general recommendations:
• Identify individual and community differences in target populations. Adapt strategies
25
that some types of individuals may also require specialized or more intensive interventions to attain similar results.
• Stimulate more project participation, with special efforts in larger, less densely
populated communities (Pollnac and Dacanay 2011).
• Encourage implementing municipalities (LGUs) to increase transparency and use more
participatory processes.
• Use well-known procedures for appropriate communication of project activities and
impacts to stimulate diffusion to a larger population (cf. Rogers 1996).
• Strive to implement the project with a more integrated approach (e.g., ensure that equal
capacity and emphasis are applied to the different components—i.e., population, health, and environment—of the integrated project).
• Encourage careful, detailed documentation of training at both the municipal and village
levels. This documentation should include detailed descriptions of activities (who, what, when, and where) at both municipal and village levels in terms of content and numbers and characteristics (cf. Crawford, et al. 2006, Rogers 1996) of both trainers and
trainees.
• Collect follow-up data identical to the baseline at a later date. The data should be
analyzed in a similar manner to provide information concerning PHE project impacts. Data should be collected at a mid-point in the project for adaptive management
purposes and then again at least two years after project termination to provide a post-project evaluation. At both these time periods, results should be examined comparing observed changes in at least two groups: the new sites and the maintenance sites. Ideally, a control group should be evaluated at the mid-project and post-project evaluation stages. The control group should consist of a random sample of non-maintenance, non-new site coastal villages from the same geographic areas.
Introduction of control sites will provide the strongest test of project impact (cf. Pollnac and Crawford 2002).
REFERENCES
Chess C, Purcell K (1999) Public participation and the environment: do we know what works? Environmental Science and Technology 33:2685-2692.
Crawford BR, Kasmadi M, Korompis F, Pollnac RB (2006) Factors Influencing Progress in Establishing Community-Based Marine Protected Areas in Indonesia. Coastal Management 34:39-64.
26
Dalton T (2006) Exploring participants’ views of participatory coastal and marine resource management processes. Coastal Management 34:351-367
Glass J (1979) Citizen participation in planning: the relationship between objectives and techniques. APA Journal 180-189.
National Research Council (2008) Public participation in environmental assessment and decision making, Panel on Public Participation in Environmental Assessment and Decision Making, Dietz T, Stern P (eds), The National Academies Press, Washington, DC.
Pollnac RB. and Dacanay K (2011) Evaluation of Value Added by Integration of Reproductive Health (Family Planning) and Environmental Management in the Visayas Region of the Philippines. Coastal Resources Center, University of Rhode Island.
Pollnac RB and Crawford BR (2000) Assessing Behavioral Aspects of Coastal Resource Use. Proyek Pesisir Publications Special Report. Coastal Resources Center Coastal
Management Report #2226. Coastal Resources Center, University of Rhode Island.
Renn, O, Webler T, Wiedemann P (1995) Fairness and competence in citizen participation: evaluating models for environmental discourse. Kluwer Academic, Boston,
Massachusetts.
Rogers EM (1996) Diffusion of Innovations. The Free Press, New York.
Rowe G, Frewer L (2000) Public participation methods: a framework for evaluation. Science, Technology & Human Values 25:3–29.
Rowe G, Horlick-Jones T, Walls J, Poortinga W, Pidgeon NF (2008) Analysis of a normative framework for evaluating public engagement exercises: reliability, validity and limitations. Public Understanding of Science 17: 419.
Webler T, Tuler S (2002) Unlocking the puzzle of public participation. The Bulletin of Science, Technology & Society 22:179-189.
27
APPENDIX I: LIST OF REPORTED OCCUPATIONS4
1=FISHING, 2=FARMING, 3=FISHING & FARMING, 4=CRAB FARMING & FISH CRAFT, 5=DELIVER ICE & PALM WINE, 6=CATCHING CRABS, 7=SARI SARI STORE, 8=PENSION, 9=WORKS AT RESORT, 10=ANIMAL RAISING (HOGS, COWS), 11=VENDING, 12=BEACH LABORER (RUNS ERRANDS), 13=TRICYCLE DRIVING, 14=BARBER/HAIRDRESSER, 15=SELLING FOOD, 16=VENDING FISH, 17=FINANCIAL ASSISTANCE FROM RELATIVE/FAMILY MEMBER, 18=LAUNDRY, 19=BARANGAY EMPLOYEE, 20=DOMESTIC WORK, 21=SHOE REPAIR, 22=NIPA ROOF MAKING, 23=REFLEXOLOGY, 24=PAINTING, 25=RESORT EMPLOYEE, 26=PALM WINE MAKING, 27=COOK, 28=FARMING & CARPENTRY, 29=CARPENTRY, 30=FISHING & CARPENTRY & MASON LABORER & BABY SITTING, 31=DRIVING, 32=CONSTRUCTION & BARANGAY EMPLOYEE, 33=BAKER, 34=MANICURE SERVICES, 35=ANIMAL PROCESSING, 36=GARBAGE COLLECTION, 37=CARPENTRY
ASSISTANT, 38=UTILITY WORKER, 39=GLEANING, 40=FIXING ELECTRIC FANS, 41=PRIEST’S SECRETARY, 42=FURNITURE DELIVERY, 43=BUYING & SELLING EGGS, 44=OFFICE WORK, 45=PASTOR & FISHING, 46=SEAMAN, 47=DRESS MAKING, 48=TEACHER, 49=CHEMICAL ENGINEER, 50=SOCIAL WORKER, 51=PRIEST, 52=COMPUTER ENGINEER, 53=TAXI DRIVING, 54=SARI SARI STORE & GOVERNMENT EMPLOYEE, 55=FACTORY WORKER, 56=LAUNDRY & COOKING, 57=SALES PERSON, 58=CARE GIVER FOR ELDERLY, 59=MOTORCYCLE DRIVING, 60=VENDING COPRA (DRIED COCONUT), 61=FISHING & CARPENTRY, 62=LOOMWEAVING, 63=STREET CLEANING, 64=FISHING & FISHPOND LABORER, 65=FISHPOND
LABORER/BUILDING DIKES, 66=CARPENTRY, 67=LAUNDRY & GLEANING & NANNY, 68=VENDING FISH & BARANGAY EMPLOYEE, 69=NGO WORKER, 70=CONSTRUCTION WORKER, 71=CITY TRAFFIC ENFORCER, 72=FISHING & COOKING IN RESTAURANT, 73=PALM WINE MAKING, 74=LABORER, 75=FARMING & FOOD VENDING, 76=MAT MAKING (RAFIA), 77=BASKET MAKING, 78=FISHPOND CARETAKER, 79=MILITARY, 80=CHOPPING AND SELLING WOOD, 81=GATHERING/CHOPPING FIREWOOD, 82=CARETAKER OF SECOND HOME, 83=HARVESTING COCONUTS, 84=CHOPPING WOOD AND SELLING COPRA, 85=CARPENTRY & POLICE OFFICER, 86=MUNICIPAL EMPLOYEE, 87=NURSE & FISHING, 88=MOTORCYCLE DRIVER & COMPUTER PROGRAMMER, 89=FISHING & FISH VENDING, 90=HOTEL RECEPTIONIST, 91=CRAB
PROCESSING, 92=PLUMBER, 93=PORTER, 94=PRODUCTION COMPANY, 95=CRAB BUYER, 96=FISHING NET ASSEMBLY, 97=BUY AND SELL ANIMAL, 98=LAUNDRY & SARI SARI STORE, 99=GRASS CUTTING, 100=SAND & GRAVEL FACTORY, 101=FIREWOOD DELIVERY & FISHING, 102=VENDING GOOSE EGGS & COCONUT SHELLS, 103=DRESS MAKING & ANIMAL GRAZING, 104=GLEANING & FISHING, 105=FINANCIAL
ASSISTANCE FROM RELATIVE & MOTORCYCLE DRIVING, 106=SELLING BREAD & OFFICE WORK, 107=BANK TELLER, 108=GLEANING & SELLING SNACKS, 109=SELLING VEGETABLES, 110=MOTORCYCLE DRIVING & WOOD CHOPPING, 111=FISHING & GLEANING & BGY. EMPLOYEE, 112=NIPA & COCONUT HARVESTER , 113=SELLING FIREWOOD, 114=NURSE, 115=FISHING & NIPA ROOF MAKING & SELLING COCONUT SHELLS, 116=FARE COLLECTOR FOR PUMPBOAT COMPANY, 117=AVON DEALER, 118=CREATES PRODUCT FOR SARI SARI STORE, 119=MOTORCYCLE DRIVER & POLICE OFFICER & CARE GIVER FOR ELDERLY, 120= FARMING & SELLING COCONUT SHELL, 121=LAUNDRY & VENDING & FARMING, 122=MASSAGE & FISHING &
CARPENTRY, 123=SEAWEED FARMING, 124=DAY CARE WORKER, 125=HARVESTING & SELLING WOOD & COCONUT, 126=SELLING SEAWEED, 127=WELDING & CARPENTRY & GLEANING, 128=HARVESTING BAMBOO AND MAKING INTO BROOMSTICK, 129=FARMING & HARVESTING BAMBOO AND MAKING INTO BROOMSTICK & GLEANING, 130=ELECTRICIAN, 131=MASSAGE, 132=BUY & SELL COGON GRASS,
133=SEAWEED FARMING & FISHING, 134=OWNS FISHPOND, 135=BUY & SELL RICE, 136=SEAWEED FARMING & FISH POND CARETAKER, 137= SEAWEED FARMING & GLEANING, 138=SEWING/TAILOR, 139= SHELLCRAFT MAKING, 140= SHELLCRAFT MAKING & FISHING, 141=FRUIT VENDING, 142=COCONUT VENDING, 143=CATTLE RAISING & BREAD MAKING & FRUIT TREE PLANTING, 144=DELIVERS WATER TO NEARBY ISLAND, 145=FISHING & LAUNDRY, 146=BARANGAY EMPLOYEE & LAMINATION,
147=SHELLCRAFT MAKING & SECURITY GUARD, 148=BARANGAY EMPLOYEE & GLEANING, 149=DRESS MAKING & GLEANING, 150=CONSTRUCTION & PAINTER & SHELLCRAFT MAKING, 151=GOVERNMENT EMPLOYEE, 152=SHELLCRAFT & FINANCIAL ASSISTANCE FROM RELATIVE, 153=WATER DELIVERY, 154=BREADMAKING & SEAWEED FARMING, 155=BABY SITTING 156=VENDING CRABS, 157=SEAWEED
4 Respondents were requested to report household sources of livelihood and then were requested to rank
28
FARMING & PROCESSING CRAB, 158=FISHING & SEAWEED FARMING & GLEANING, 159=SEAWEED FARMING & BARANGAY EMPLOYEE, 160=FISHING & BARANGAY EMPLOYEE, 161=FISHING & SEAWEED FARMING & DOMESTIC WORKER, 162=SEAWEED FARMING & FINANCIAL ASSISTANCE FROM RELATIVE, 163=SEAWEED FARMING & GLEANING, 164=PUMPBOAT DRIVER, 165=SMALL BUSINESS-FLOOR WAXING, 166=MAT WEAVING, 167=OWNS RICE FARM, 168=COCKPIT EMPLOYEE (COCKFIGHTING),
169=HOUSEBOY/GARDENER, 170=LABORER & FOOD VENDING, 171=SECURITY GUARD, 172=CASHIER, 173=CELLPHONE REPAIR, 174=RESTAURANT WORKER, 175=TRICYCLE DRIVER & TEACHER,
176=COOKING, 177=FISH CULTURE, 178=FARMING & TAILORING & LABOR, 179=MASON LABORER, 180=SEAWEED FARMING & FARMING & SALT VENDING, 181=BARANGAY EMPLOYEE & FISHPOND LABORER,182=FISHING & SARI SARI STORE, 183=SEAWEED & SEA CUCUMBER VENDING, 184=RICE MILL OPERATOR, 185=TILE MAKER, 186=FISHING & SEAWEED FARMING & CATCHING CRABS, 187=DELIVERY BOY & CANTEEN GIRL, 188=SEAWEED FARMING & SARI SARI STORE, 189=FISHING & VENDING SNACKS, 190=FISH VENDNG & FINANCIAL ASSISTANCE, 191=STORE EMPLOYEE, 192=LAUNDRY & GLEANING, 193=SEAWEED PROCESSING, 194=AUTO MECHANIC/MECHANIC, 195=METER READER, 196=DRIVER & BARANGAY EMPLOYEE, 197=BARANGAY EMPLOYEE & SOUND SYSTEM OWNER, 198= FARMING, BUILDING OF DIKES & CARPENTRY, 199=SARI SARI STORE, FARMING & PRIVATE EMPLOYEE, 200=FARMING & BUILDING OF DIKES, 201= FISHING & BANANA CUE VENDING, 202=GUEST RELATIO N OFFICER,
203=MOTOR BIKE DRIVING, MANICURE, BUILDING OF DIKES & PRIVATE DRIVER, 204= DOMESTIC WORK & BANANA CUE VENDING, 205= FARMING & CRAB VENDING, 206= COOKING & GLEANING, 207= FISH
WARDEN & FARMING & FOOD VENDING, 208= POLICE OFFICER, 209 = WATER COMPANY EMPLOYEE, 210 = BARANGAY OFFICIAL AND FINANCIAL ASSISTANCE FROM RELATIVES, 211 = SMALL TOWN
LOTTERY/GAMBLING, 212 = PRIVATE COMPANY EMPLOYEE, 213 = BUY AND SELL CHARCOAL, 214 = CHARCOAL MAKING, 215=VEGETABLE VENDING AND FARMING, 216 = BUSINESS MANAGEMENT (BAKERY), 217 = JEEPNEY CONDUCTOR, 218=SELLING OF CARS , 219 = SELLING PROCESSED GOODS, 220=FARMING AND DOMESTIC WORK, 221=CANNED GOOD AGENT, 222=SAVINGS, 223=CABLE DEALER, 224=SOFTWARE DEVELOPER, 225=TOURIST GUIDE, 226=CALL CENTER AGENT, 227=TATOO/HENNA MAKING,
228=PLUMBING, 229=LENDING/MONEY LENDING, 230=PAWNSHOP AND FABRIC BUSINESS, 231=MEDICAL AID, 232=DISPATCHER,233=OWNS OYSTER FARM,234=OWNS A CASSAVA FARM, 235= PLANTING
ROOTCROPS/SELLING CASSAVA, 236=PAID TO GUARD STUDENTS, 237=TRICYCLE DRIVING AND LAUNDRY, 238=TALABA CULTURE AND CATCHING CRABS, 239=RTW AND COSMETIC DEALER, 240=DELIVERY BOY, 241=PUMPBOAT HELPER, 242=LAUNDRY, 243=REAL ESTATE AND TEACHING, 244=OFW, 246=JEEPNEY DISPATCHER, 247=JEEPNEY OPERATOR, 248=WELDING, 249=OWNS A FACTORY, 250=SHIP CREW, 251=EATERY BUSINESS, 252=POULTRY, 253=BUY AND SELL, 254=TRICYCLE OPERATOR, 255=BARANGAY COOPERATIVE, 256=EATERY AND OWNER OF IRON WORKS, 257=DIVER, 258=HAIR
CUTTING/MANICURE/PEDICURE , 259= TRACER, 260=SELLS RECYCLABLES, 261= FISHING & BUY AND SELL WOOD, 262=FISHING & MAT WEAVING, 263= AVOCADO GARDENING, 264= MAKING OF
29
APPENDIX II: PERCENT DISTRIBUTION MATERIAL STYLE OF LIFE ATTRIBUTES
Shaded cells indicate differences that are statistically significant (p<0.01 χ2) New site N=792 to 795; Maintenance site N=802-895 due to missing data. Variable Maintenance
Site
%
Bamboo Wall New Site 25.2 Maintain Site 47.8 Wood Wall New Site 36.3 Maintain Site 45.3 Cement Wall New Site 57.3 Maintain Site 47.2 Nipa Roof New Site 24.2 Maintain Site 47.0 Wood Roof New Site 06.4 Maintain Site 05.1 Tin Roof New Site 76.4 Maintain Site 67.3 Tile Roof New Site 05.0 Maintain Site 01.1 Cement Floor New Site 57.3 Maintain Site 43.0 Tile Floor New Site 06.8 Maintain Site 04.6 Wood Floor New Site 13.7 Maintain Site 11.8 Dirt Floor New Site 13.2 Maintain Site 18.8
Variable Maintenance Site
%
Glass Window New Site 33.7 Maintain Site 23.9 Wood Window New Site 48.1 Maintain Site 59.3 Open Window New Site 27.0 Maintain Site 26.5 Water Piped New Site 45.8 Maintain Site 20.5 Indoor Toilet New Site 69.5 Maintain Site 58.3 Electricity New Site 83.5 Maintain Site 71.4
Radio New Site 51.8
Maintain Site 52.6
TV New Site 63.7
Maintain Site 50.6 Refrigerator New Site 30.3 Maintain Site 18.5 Benches New Site 41.7 Maintain Site 52.7 Chairs New Site 78.5 Maintain Site 78.9 Livingroom Set New Site 32.6 Maintain Site 22.9
Variable Maintenance Site
%
30
APPENDIX III: REPRODUCTIVE HEALTH QUESTIONS
D1a Have you ever been pregnant or gotten somebody pregnant? Yes [1] No [0]
D1b Did you plan that pregnancy? Yes [1] No [0]
D2 How many children do you prefer ___ ___ (If never been pregnant,
skip to next section)
D3 (For FEMALE) Number of pregnancies ever had ___ ___
D4 (For FEMALE) Number of children ever born ___ ___
D5a Have you/your partner gotten pregnant in the last 12 months? Yes [1] No [0] (If no, Skip to next section)
D5b Did you plan for that pregnancy? Yes [1] No [0]
D6a (For FEMALE) Did you breastfeed? Yes [1] No [0]
D6b Duration in breast feeding for last child in months___________
D7 Have you ever had sex? Yes [1] No [0] (If No, Skip this section)
D8 At what age did you have your first sexual intercourse? ___ ___
D9a Are you currently using any contraceptive? Yes [1] No [0]
D9b If YES, what contraceptive/s are you using?_________________
D10a Did you / your partner use any method/s to prevent pregnancy the first time you had sexual intercourse? Yes [1] No [0]
D10b
If YES, what did you/your partner use or do to prevent pregnancy the first time you had sex? ______________________________
D11a
The last time you had sex, did you/your partner use anything to prevent pregnancy? Yes [1] No [0]
D11b If YES, what did you/your partner use or do to prevent pregnancy the last time you had sex? __________________________________
D12
Do you know anything about sexually transmitted diseases? Yes [1] No [0]
D13a The last time you had sex, did you use anything to prevent sexual disease transmission? Yes [1] No [0]
D13b
If YES, what did you/your partner use or do to prevent sexual diseases? ________________ ______________________
D14
Where did you get supplies/services? 1 – RHU
2 – BHS
3 – Drugstore / Pharmacy 4 – CBD
5 – Pop shop
31
APPENDIX IV: ADDITIONAL REPORTED ILLNESSES
1=FEVER, 2=COUGH/COLD/FLU, 3=VOMITTING, 4=HIGH BLOOD PRESSURE, 5=STOMACHACHE,
6=ARTHRITIS, 7=TOOTHACHE, 8=ULCER, 9=SEVERE BODY/MUSCLE PAINS, 10=HEADACHE, 11=MUSCLE PAIN, 12=KIDNEY DISEASE, 13=HYPERACTIVITY, 14=SORE EYES, 15=ASTHMA, 16=MEASLES, 17=DIABETES, 18=KIDNEY STONES, 19=EAR INFECTION, 20=APPENDICITIS, 21=BLURRED VISION/ASTIGMATISM,
22=ALLERGIES, 23=SEPSIS, 24=STOMACH PROBLEMS, 25=MILD STROKE, 26=BLURRED VISION, 27=IRREGULAR BOWEL MOVEMENTS, 28=HEART DISEASE, 29=RHEUMATISM, 30=MEMORY LOSS,
31=NUMBNESS, 32=BROKEN ARM & RIBS, 33=HEART PROBLEMS, 34=TYPHOID FEVER, 35=EYE DISEASES, 36=CHICKEN POX, ,37=TONSILITIS, 38=BRONCHITIS, 39=CRAMPS, 40=DIZZINESS, 41=SINUSITIS,
42=GOITER, 43=NOSE BLEEDS, 44=ILLNESS RELATED TO CHILD BEARING, 45=LUPUS, 46=LUNG PROBLEMS, 47=CYST IN BREAST, 48=NERVOUS BREAKDOWN, 49=KIDNEY PROBLEMS, 50=”PASMO”— FEVER/SICKNESS, 51=EXTREME FATIGUE, 52=PARASITES IN INTESTINES, 53=HEPATITIS, 54=HEART ENLARGEMENT, 55=CONVULSION FROM HIGH FEVER, 56=DAMAGED LUNGS DUE TO COMPRESSOR USE, 57=BONE FRACTURE, 58=NECK FRACTURE, 59=STROKE, 60=BREAST INFECTION, 61=ABNORMAL ABDOMEN, 62=SKIN RASH, 63=MUMPS, 64=OVARIAN CYST, 65=INSOMNIA, 66=ANEMIC, 67=EPILEPSY, 68=UTI, 69=DIARRHEA,70=SORE THROAT,71=MENINGITIS , 72= LEUKEMIA, 73= INTESTINAL PROBLEMS, 74= BODY LUMPS, 75=CANCER, 76=DIFFICULTY BREATHING, 77=PIMPLES, 78=MYOMA, 79=HIGH
32
APPENDIX V: PATH FOUNDATION PHILIPPINES BMS SURVEY
REPRODUCTIVE HEALTH (HOUSEHOLD WELL-BEING)
Opinion Statement Strongly
Agree Agree
No
opinion Disagree
Strongly Disagree
Everyone should have the right to choose how
many children they want and when to have them 5 4 3 2 1
Adolescents should have access to information on
sexuality 5 4 3 2 1
Teens should NOT have access to contraceptives
even if they are already having sex 1 2 3 4 5
Condom use can protect us from unwanted
pregnancy AND sexual diseases 5 4 3 2 1
POVERTY- ENVIRONMENT LINKAGES
Opinion Statement Strongly
Agree Agree
No
opinion Disagree
Strongly Disagree
Barangays can face a crisis when there are too
many people and not enough fish to go around 5 4 3 2 1
If couples do not practice family planning, there may not be enough natural resources to go around in the future
5 4 3 2 1
Garbage problems can get worse when there is
overcrowding in barangays 5 4 3 2 1
Families with a large number of children are better off economically than families with only a few children
1 2 3 4 5
ENVIRONMENT AND EMPOWERMENT
Opinion Statement Strongly
Agree Agree
No
opinion Disagree
Strongly Disagree
Our community is helpless in protecting the
environment 1 2 3 4 5
Water is becoming more scarce in this area
1 2 3 4 5
Only the government is responsible for
conservation 1 2 3 4 5
Mangrove forests can provide protection against
the effects of strong currents and big waves 5 4 3 2 1
If we throw our garbage on the beach, the ocean
33 FOOD AND INCOME SECURITY
Opinion Statement Strongly
Agree Agree
No
opinion Disagree
Strongly Disagree
There has been a decline in fish availability in this
barangay over the past few years 1 2 3 4 5
We are not be able to afford to send all our
children to school 1 2 3 4 5
Sometimes there is not enough food to go around
and the family goes hungry 1 2 3 4 5
Aside from the sea, we have other sources to turn
34
APPENDIX VI: COASTAL RESOURCE MANAGEMENT QUESTIONS5
CRM-1 Would you support regulations limiting the number of fishermen allowed to fish in municipal waters? Yes [1] No [0]
CRM-2 Would you support regulations restricting fishing? Yes [1] Maybe [0.5] No [0]
CRM-3A
Have you ever heard of someone using illegal fishing methods or coastal activities in this community? If yes, which of the below?
CRM-4a Have you ever participated in bantay dagat patrols? Yes [1] No [0] CRM-4b Are you an active member of bantay dagat? Yes [1] No [0]
CRM-5 If you have a relative from another municipality who wants to fish here, would you tell him to register? Yes [1] No [0]
CRM-6
(Fisher only)
Do you check to see if municipal fishermen from other communities have a permit to fish in your waters? Yes [1] No [0]
If the non-local fisherman did not have a permit, would you report him to the bantay dagat? Yes [1] No [0] CRM-7 Fisher only If you are using a fishing net, what is the mesh size?____(how big)
CRM-8 Did you know that Philippine law allows a citizen to file a lawsuit against illegal fishermen? Yes [1] No [0] CRM-9 Do you own a fishing boat? Yes [1] No [0]
If yes, is your boat registered? Yes [1] No [0]
CRM-10
Have you ever asked your local government officials to take actions to improve the coastal and marine environment? Yes [1] No [0]
If yes, what actions did you suggest? 1_________________ CRM-13 Have you participated in a coastal clean-up? Yes [1] No [0]
CRM-14 Do you pick-up and properly dispose of plastic garbage you see on the beach or in front of your house? Yes [1] No [0]
CRM-15
If farming, what do you do to prevent erosion, if anything?
______________________________________________________________________________________
35
COMPLETE LIST OF ACTIONS SUGGESTED TO LOCAL GOVERNMENT OFFICIALS TO IMPROVE COASTAL & MARINE ENVIRONMENT
1=STRENGTHEN/REVIEW PENALTIES FOR ILLEGAL FISHERS, 2=COASTAL CLEAN-UP, 3=PATROLLING FOR ILLEGAL FISHING, 4=STOP/MINIMIZE ILLEGAL FISHING, 5=LIVELIHOOD PROJECTS SO MORE MARINE LIFE, 6=CREATE SANCTUARY, 7=LIMIT FISHING IN SANCTUARY, 8=STRENGTHEN BANTAY DAGAT
PATROL, 9=NO OUTSIDERS ALLOWED TO FISH, 10=FORBID HARVEST OF CORALS, 11=STRICT ENFORCEMENT OF COASTAL LAWS, 12=BUILD FISH CAGE, 13=PLANT MORE MANGROVES,
14=COOPERATION AMONG PEOPLE ON RULES OF SANCTUARY, 15=CANNOT REMEMBER, 16=NO USE OF FINE MESH NETS/NO CATCHING SMALL FISH, 17=PLANT SEAWEEDS, 18=DEVELOPMENT OF SEAWEED FARMING, 19=LIMIT FISHING AND CYCLE (FIRST FISH, THEN CRABS), 20=ADDITIONAL INCOME FOR FAMLIES, 21=PLANT TREES, 22=CLEAN ENVIRONMENT BY MAKING COMPOST PIT, 23=LIMIT MANGROVE CUTTING, 24=GIVE 3 CHANCES TO PEOPLE WHO GO IN SANCTUARY, 25=NOT TO ABUSE SANCTUARY, 26=ALLOW FISHING IN SANCTUARY, 27=PROTECT/GUARD MANGROVES, 28=PROTECT FISH & CORAL, 29=NO FISHING IN SANCTUARY, 30=DON’T TAKE SEA FOR GRANTED, 31=TELL COMMUNITY TO REPORT FISHERS USING SMALL MESH NETS, 32=REGISTRATION OF ALL FISHERS, 33=USE OF FISH CAGES, 34=MORE MONITORING OF THE SEA, 35=PROTECT COASTAL AREAS/ENVIRONMENT, 36= PROPER GARBAGE
DISPOSAL/PROHIBIT DUMPING GARBAGE ALONG SEASHORE, 37=REQUIRE COMPOSTING OF EVERY HOUSEHOLD, 38=TAKE CARE OF THE SEA, 39=MAINTAIN CLEAN & GREEN ENVIRONMENT, 40=MAINTAIN PLANTED MANGROVES, 41=PROTECT SANCTUARY, 42=COOPERATION TO PROTECT MANGROVES & SEA, 43=PROHIBIT MANGROVE HARVESTING, 44=PROVIDE PRO-ENVIRONMENT PROJECTS, 45=CONVINCE COMMUNITY TO STOP DYNAMITE FISHING, 46=PLANT FLOWERING PLANTS, 47=CONSTANTLY GUARD THE SEA, 48=STOP FISHPOND OPERATION WITHOUT PERMIT, 49=PROVIDE ACTIVITIES TO PROTECT
SANCTUARY & INCREASE FISH, 50=PROTECT MARINE LIFE, 51=STOP HABITAT DESTRUCTION WHILE FISHING, 52=IEC FOR ENVIRONMENTAL PROTECTION/CRM, 53=TRAINING ON FISHING RULES, 54=REPORT ILLEGAL FISHERS, 55=SANCTUARY MARKERS, 56=TRAINING FOR FISH WARDEN, 57=PROTECT NATURAL RESOURCES, 58=NO THROWING GARBAGE INTO SEA, 59= TAKE CARE OF THE SANCTUARY, 60=TRAINING FOR WOMEN, 61=FISH CAGE CONSTRUCTION AND MANAGEMENT, 62=MPA MANAGEMENT, 63=PROVISION OF FISHING MATERIALS, 64=STOP ILLEGAL ENTRY, 65=INSTALLATION OF VISIBLE DEMARCATION LINE IN THE BRGY SEA,66=CULTURING TALABA, 67=FISHPOND MANAGEMENT, 68=PRESERVATION OF MPAs, 69=MANGROVE MANAGEMENT, 70=STRENTHEN/REORGANIZE FISHERFOLK ORGANIZATION, 71=PROPER MANAGEMENT OF PO, 72=MAKING ORDINANCE REQUIRING PIGGERIES TO HAVE DEPOSITORIES, 73=USE NEW LOOK AND FISH NET ONLY IN FISHING, 74=PUTTING BENCHES AS WAITING AREAS INSTEAD OF TREES, 75=RESTRICTS POSSESSION OF AQUARIUM, 76=NO TO SPEEDBOAT IN THE MUNICIPAL WATERS, 77=FISHING PERMIT, 78= FISHING MADE PRIORITY TO LOCAL RESIDENTS (PROVIDE MORE BREEDING GROUNDS FOR FISH), 79= NO COMMERCIAL FISHING WITHIN MUNICIPALITY, 80= FINANCIAL ASSISTANCE/ SUBSIDY, 81= PROGRAM/ PROJECTS FOR ADDITIONAL FINGERLINGS, 82= CONSTRUCTION OF PUBLIC TOILET IN COASTAL AREAS, 83=PROVIDES ALTERNATIVE LIVELIHHODS FOR THE COMMUNITY, 84=PROHIBIT THE USE OF ELECTRICITY TO FISH, 85=PROHIBIT OIL