ISSN: 2339-076X, Volume 2, Number 3 (April 2015): 319 - 326
DOI:10.15243/jdmlm.2015.023.319
Research Article
The effect of Al, Si and Fe contents (selective dissolution) on soil
physical properties at the northern slope of Mt. Kawi
I. Nita*, S. R. Utami, Z. Kusuma
Department of Soil Science, Faculty of Agriculture, Brawijaya University Malang Jl. Veteran, Malang 65145, Indonesia
*corresponding author: [email protected]
Abstract
:A toposequence at the northern slope of Mt. Kawi (East Java), having andic properties, were studied. Soil samples at various horizons from five profiles along the toposequence were selected for this study. Selective dissolution analyses (oxalate acid, pyrophosphate and dithionite citrate extractions) were performed to predict the amorphous materials, as reflected from the extracted Si, Al, and Fe. The contents of these three constituents were then correlated to the soil physical properties. The andic characters were indicated by low bulk density (0.43-0.88 g/cm3) and considerable amounts of Alo(1.3-4.2%) and Feo(0.6-2%), which tended to increase with depth. As a consequence, high content of total pores (>70%) and water content at pF 0, 2.54, and 4, as well as strong aggregate stability were detected (MWD of 2.4-4.5 mm and 1.4-4.5 mm, respectively, in Andisols and Non-Andisols). Water content at pF 0, 2.54, and 4, were significantly affected by respectively %Sio,% Fed, % Fep, and % Fed. However, bulk density was
closely related to %Aldonly.
Keywords:aggregat stability, amorphous material, andic properties, bulk density, pF
Introduction
Soil physical properties are affected by soil forming factors such as parent material, organism, topography, climate and time. In a particular parent material, topography factor closely associated with microclimate and organism factors. This results in a strong influence of organic matter on soil properties, such as soil bulk density, porosity and water holding capacity (Emadi et al., 2008; Khresat et al., 2008). Previous study at northern slope of Mt. Kawi, however, revealed that % water available and bulk density were not significantly related to% organic matter. As this area was developed from volcanic ash, we then assumed that the soil physical properties would be much determined by the amorphous materials, such as allophane, imogolite, ferrihydrite (Otsuka and Takahara, 2010).
Soil developed from volcanic ash has special physical and chemical characteristics, such as low bulk density, high permeability, stable soil aggregate, high P fixation capacity, and
consequences of the high content of active Al/Fe (Nanzyo, 2002). The presence of the amorphous materials mentioned is also a reason of high water-holding capacity and availability of the water for plants (Khan et al., 2006).
Putra et al. (2013) classified soils at the northern slope of Mt. Kawi (from upper to lower slope) as Typic Hapludands (P1 and P2), Humic Udivitrand (P3), and Andic Dystrudept (P4). The study showed that the andic character weaken at the lower slope. As a result, soil physical properties would also be affected. However these authors were focussing on the pedogenesis, but very little emphasize on the effect of amorphous materials on the soil physical properties.
This study was aimed to elucidate the effect of Al, Si and Fe contents determined by oxalate acid, pyrophosphate and dithionite citrate extractions, on soil physical properties at the northern slope of Mt. Kawi.
District of Malang, East Java was selected for this study. Soil samples were collected from four pedons, which previously described by Putra et al. (2013). Soil samples were selected from horizons having bulk density <0.9 g/cm3, with a short range of organic material content. Soil physical properties (water content at pF 0, 2.54, and 4.2, aggregate stability, and soil pores) were measured using routine methods (Landon, 1984). Selective dissolution analyses (using oxalate acid, pyrophosphate and dithionite citrate) were then performed to determine Si, Al and Fe contents (Mizota and van Reeuwijk, 1989). Si, Al and Fe extracted by oxalate acid, pyrophosphate and dithionite citrate were measured with AAS, and respectively designated as Alo, Sio, Feo (oxalate),
Alp, Fep(pyrophosphate), Aldand Fed(dithionite).
The content of these constituents were then correlated to the soil physical properties.
Results and Discussion
Al, Si, and Fe content
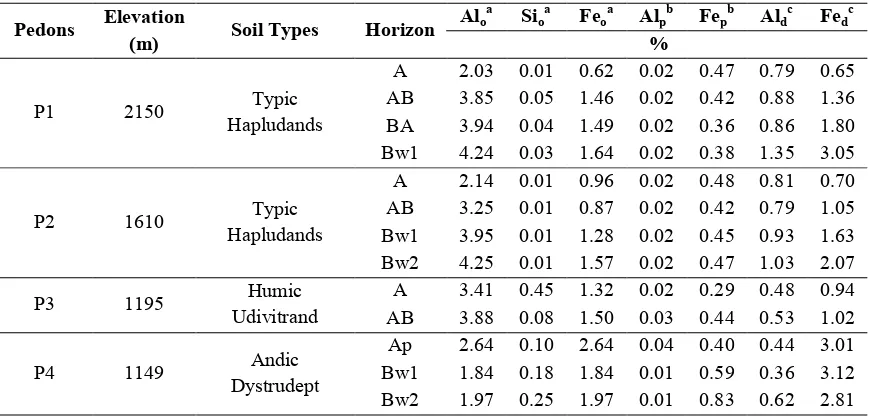
Table 1 shows the variation of Al, Si, and Fe contents in the studied pedons. The results showed that %Alo was the highest (1.32-4.24%),
followed by %Fed(0.65-3.12%) and %Feo
(0.62-1.97%). Andic characters (as reflected by %Alo+
½ %Feohigher than 2%), occured in all samples,
even in the non-Andisol (P4). These results
indicated strong influence of amorphous materials in the toposequence. However, the considerably high content of Fedreflected high amount of Fe in
the crystalline form, suggesting that the pedons were already developed. The contents of Alo, Feo,
Ald and Fed generally increased with soil depth.
However, no specific pattern was found for Sio,
Alp and Fep. This result was comparable to the
research of Bartoli et al. (2007). These authors suggested that the organic matter content in the soil supports the production of complex ligand and amorphous material (pyrophosphate extracted) and blocks the production of amorphous material (oxalate extracted). Increasing content of Fepwith soil depth was also
observed in P3 and P4, but not in P1 and P2. Apparently this could be related to the variation of organic material content in these pedons. Garcí a-Rodeja et al. (2004) stated that the pyrophosphate extraction could separate the Al and Fe in the humus complex. Pedons P1 and P2 were under forest, supplying more organic matter and hence forming high content of Fe-humus complex in the upper layer (Liu et al., 2005).
Soil physical characteristics
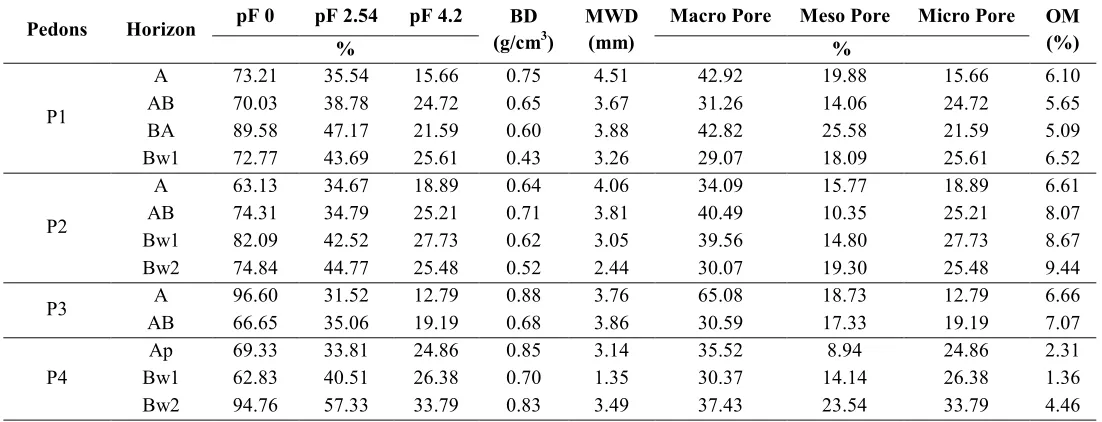
The soil physical characteristics (% water content, bulk density, aggregate stability, and % total pores) of the study area are presented in Table 2.
Table 1. The contents of soil Al, Si and Fe in the studied pedons
Pedons Elevation
(m) Soil Types Horizon
Aloa Sioa Feoa Alpb Fepb Aldc Fedc %
P1 2150 Typic
Hapludands
A 2.03 0.01 0.62 0.02 0.47 0.79 0.65
AB 3.85 0.05 1.46 0.02 0.42 0.88 1.36
BA 3.94 0.04 1.49 0.02 0.36 0.86 1.80
Bw1 4.24 0.03 1.64 0.02 0.38 1.35 3.05
P2 1610 Typic
Hapludands
A 2.14 0.01 0.96 0.02 0.48 0.81 0.70
AB 3.25 0.01 0.87 0.02 0.42 0.79 1.05
Bw1 3.95 0.01 1.28 0.02 0.45 0.93 1.63 Bw2 4.25 0.01 1.57 0.02 0.47 1.03 2.07
P3 1195 Humic
Udivitrand
A 3.41 0.45 1.32 0.02 0.29 0.48 0.94
AB 3.88 0.08 1.50 0.03 0.44 0.53 1.02
P4 1149 Andic
Dystrudept
Ap 2.64 0.10 2.64 0.04 0.40 0.44 3.01
Table 2. Soil physical characteristics of the studied pedons
Pedons Horizon pF 0 pF 2.54 pF 4.2 BD (g/cm3)
MWD (mm)
Macro Pore Meso Pore Micro Pore OM (%)
% %
P1
A 73.21 35.54 15.66 0.75 4.51 42.92 19.88 15.66 6.10
AB 70.03 38.78 24.72 0.65 3.67 31.26 14.06 24.72 5.65
BA 89.58 47.17 21.59 0.60 3.88 42.82 25.58 21.59 5.09
Bw1 72.77 43.69 25.61 0.43 3.26 29.07 18.09 25.61 6.52
P2
A 63.13 34.67 18.89 0.64 4.06 34.09 15.77 18.89 6.61
AB 74.31 34.79 25.21 0.71 3.81 40.49 10.35 25.21 8.07
Bw1 82.09 42.52 27.73 0.62 3.05 39.56 14.80 27.73 8.67
Bw2 74.84 44.77 25.48 0.52 2.44 30.07 19.30 25.48 9.44
P3 A 96.60 31.52 12.79 0.88 3.76 65.08 18.73 12.79 6.66
AB 66.65 35.06 19.19 0.68 3.86 30.59 17.33 19.19 7.07
P4
Ap 69.33 33.81 24.86 0.85 3.14 35.52 8.94 24.86 2.31
Bw1 62.83 40.51 26.38 0.70 1.35 30.37 14.14 26.38 1.36
Bw2 94.76 57.33 33.79 0.83 3.49 37.43 23.54 33.79 4.46
Bulk density
Soil bulk density in the studied pedons ranged from 0.43 to 0.88 g/cm3. In P1, P2 and P3, the bulk density tended to decrease with depth. This pattern was apparently in accordance with the pattern of Alo, Feo, Ald and Fed which also
increased with depth. Ӧzaytekin and Karakaplan (2012) mentioned that there is a negative relationship between the bulk density and the amorphous material content. In P4, a non-Andisol, however soil bulk density tended to increase in the third horizon. A high bulk density could be due to the increase of clay content (Tracy et al., 2013).
Soil pores
The number of macro, meso and micro pores varied with depth. The pores were dominated by macro pores, followed by micro and meso pores. Total porosity ranged from 67 to 97%. The high porosities were commonly recognizable in the soils having amorphous materials. The occurence of allophane and imogolite (Sinha et al., 2003; Levard et al., 2012) and the ferrihydrite (Xiong and Peng, 2008) produce very porous structure, as they containintra-andinterpores.
Water content at pF 0, 2.54, and 4.2
Water contents at pF 0, 2.54, and 4.2 ranged from 67 % to 97%, from 32% to 57%, and from 13% to 34%, respectively. The high water-holding capacity is common for soils having andic properties (Qafoku et al., 2000). The highest water content at pF 0 was found in P3, a Humic Udivitrand. The vitrandic character, which has coarse soil texture, is known to have very porous structure (Soil Survey Staff, 2014). This character together with humic properties (rich in organic matter) were possible reasons behind the very high water content at saturated condition (pF 0). The highest water content at pF 2.5 and pF 4.2 were, however, found in P4, a non-Andisol pedon. This showed that water content at high tension was mostly affected by the composition of the clay particles. Pedon P4 was a more developed soil than other pedons, as shown by lower content of amorphous materials (%Alo + ½%Feo) and
higher content of crystalline materials (%Fed).
The increase of water content at pF 0, 2.54, and 4.2 with depth was in accordance with the increasing amount of amorphous material (Aloand
Feo), soil porosity and the decrease of bulk density
(Dixon and Schulze, 2002).
(P4). The results showed that the aggregate stability of the soil samples were classified as stable to very stable. According to Candan and Broquen (2009), the stable aggregate is one of the characteristics of andic soil.
Relationship between Al, Si, Fe constituent, organic matter and soil bulk density
The statistical analysis showed that %Ald, Sio, Alo,
and %organic matter had relatively strong correlation to the bulk density (Appendix 1). The amorphous and crystalline material contents (Schipper et al., 2007) and the organic matter (Ӧzcan and Ӧzaytekin, 2011) strongly affected soil bulk density. The stepwise regression analysis showed that %Aldhad a significant influence on
the bulk density. Figure 1 indicates that about 70% variation of the bulk density could be explained by the variation of % Ald.
Figure1. Relationship between %Aldand soil bulk
density.
According to Nanzyo (2002), the bulk density of Andic soils is determined by the amorphous material < organic matter < crystalline minerals with decreasing magnitude. The structure of amorphous particles has very high porosity, hence resulting in a very low bulk density (Moldrup et al., 2003). These authors proved that allophane mineral is extremely porous, in which it may have 60%-85% of porosity. However, the significant role of %Ald in this study showed that in the
Andisol itself, the overall constituents might have combined effect on the bulk density.
Relationship between Al, Si, and Fe constituents, organic matter and soil water contents
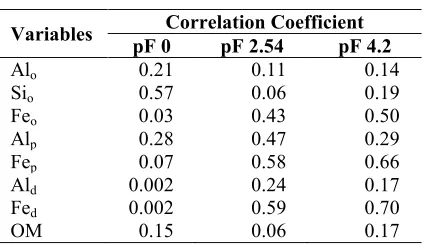
Table 3 shows the coefficient of correlations between soil constituents and water content at pF 0, 2.54, and 4.2. The results showed that Al, Si, and Fe constituents and the organic matter content were significantly correlated to water content in various pF values. Previous studies also showed
Table 3. The correlation coefficient between amorphous material, organic matter, and water content.
Figure 2 shows that about 31% of variation in water content at pF 0 could be explained by the %Siovariation. Although the proportion was
relatively small (31%), the regression analysis showed that among the observed variables, only %Sioaffected water content at pF 0 significantly
(Appendix 2). Van Ranst et al. (2002) stated that the concentration of Sio in the soil negatively
correlated to bulk density. These authors suggested that a lower bulk density meaned a higher porosity, which resulted in higher capacity to retain water.
The coefficient of determination (R2) between the %Fed and the water content at pF
2.54 was 35% (Appendix 3 and Figure 3), meaning that 35% variation of water content at pF 2.54 was determined by %Fed. According to
Hausner et al. (2009), ferrihydrite minerals are very active because of the hydroxylation of the soil surface and the wide range of the high surface (220-560 m2/g), hence it may form very high soil porosity (Pokrovski et al., 2003). These characteristics result in the high ability of the soil to retain water content even at pF 2.54. As shown previously, bulk density in the study area was less than 0.88 g/cm3, reflecting relatively high soil porosity.
Figure2. Relationship between %Sioand % water content at pF 0.
Figure3. Relationship between %Fedand % water content at pF 2.54
The stepwise regression analysis showed that only Fedand Fepsignificantly affected %water content
at pF 4.2 (Appendix 4).
y = 8.76 + 3.07x1 + 19.45x2
The content Fe-humus complexes (Fep) and Fed
affected water holding capacity at pF 4.2 through the hydrophilic characters that can multiply binding capacity to water (Ӧzcan and Ӧzaytekin, 2011).
Conclusion
The studied pedons showed andic properties, as indicated by low bulk density (0.43-0.88 g/cm3) and considerable amounts of Alo (1.3-4.2%) and
Feo(0.6-2%). The content of Alo, Feo, Aldand Fed
generally increased with soil depth. However no specific pattern was found for Sio,Alpand Fep. All
pedons had very high content of total pores (>70%) and water content at pF 0, 2.54, and 4.2 as well as strong aggregate stability (MWD of 2.4-4.5 mm and 1.4-3.5 mm respectively, in Andisols and non-Andisols). Water content at pF 0, 2.54, and 4.2 were significantly affected %Sio; % Fed;
% Fep and % Fedrespectively. However, bulk
density was closely related to %Ald only. About
70% variations of the bulk density could be explained by the variation of %Ald.
Acknowledgements
The first author wishes to thank staff of Bendosari village, Pujon, Malang Regency for their kind help in collecting soil samples. Special thanks are also given to DGHE (Directorate General of Higher Education) for scholarship grant under the frame of MSc-Fast Track Programme.
References
Bartoli, F., Poulenard, A.J. and Schouller, B.E. 2007. Influence of allophane and organic matter contents on surface properties of Andosols. European Journal of Soil Science58: 450-464.
Candan, F. and Broquen, P. 2009. Aggregate stability and related properties in NW Patagonian Andisols.
Geoderma154: 42-47.
Dixon, J. B. and Schulze, D. G. 2002. Soil mineralogy
physical and chemical properties in North Highland of Iran.Journal of Applied Sciences8 (3): 496-502. García-Rodeja, E., Nóvoa, J. C., Pontevedra, X.,
Martínez-Cortizas, A. and Buurman, P. 2004. Aluminium fractionation of European volcanic soils by selective dissolution techniques.Catena56: 155-183.
Hausner, F., Bhandari, N., Pierree-Louis, A., Kubicki, J. and Strongin, D. 2009. Ferrihydrite reactivity toward carbon dioxide. Journal of Colloid and Interface Science337: 492-500.
Khan, H., Matsue, N. and Hemni, T. 2006. Adsorption of water on nanoball allophane. Clay Science 12 (2): 261–266.
Kherast, S., Al-Bakri, J. and Al-Tahhan, R. 2008. Impacts of land use/cover change on soil properties in the Mediterranean region of northwestern Jordan.
Journal Land Degradation Development 19: 397-407.
Landon, J. R. 1984. Booker Soil Tropical Manual. Booker Agriculture International Ltd. 450 pp. Levard, C., Doelsch, E., Basile-Doelsch, I., Abidin, Z.,
Miche, H., Masion, A., Rose, J., Borschneck, D. and Bottero, J.Y. 2012. Structure and distribution of allophanes, imogolite and proto-imogolite in volcanic soils.Geoderma183-184: 100-108. Liu, A., Ma, B. L. and Bomke, A. A. 2005. Effects of
cover crop on soil aggregate stability, total organic carbon, and polysaccharides.Soil Science Society of America Journal69: 2041-2048.
Mizota, C. and van Reeuwijk, L.P. 1989. Clay mineralogy and chemistry of soils formed in volcanic material in diverse climatic regions.Soil Monograph 2, Department of Agricultural Chemistry, Kyushu Univ. Fukuoha, Japan. 186p. Moldrup, P., Seiko, Y., Torben, O., Toshiko, K. and
Dennis, E.R. 2003. Air permeability in undisturbed volcanic ash soils: Predictive model test and soil structure fingerprint. Soil Science Society of America Journal67: 32-40.
Nanzyo, M. 2002. Unique properties of volcanic ash soils. Global Environmental Research 6 (2): 99-112.
Nita, I., Listyarini, E. and Kusuma, Z. 2014. Study of available moisture on toposequence of the northern slopes of Mount Kawi Malang in East Java.Jurnal Tanah dan Sumberdaya Lahan 1(2): 49-57 (in Indonesian).
Otsuka, H. and Takahara, A. 2010. Structure and properties of imogolite nano tubes and their application to polymer nano composites. In:
Inorganic and Metallic Nanotubular Materials. Springer Berlin Heidelberg117: 169-190.
Ӧzaytekin, H. H. and Karakaplan, S. 2012. Soil formation on the Karadag volcano at a semiarid environment from the Central Anatolia. African Journal of Agricultural Research 7 (15): 2283-3396.
Parfitt, R. L. 2009. Allophane and imogolite: role in soil biogeochemical processes.Clay Minerals44: 135-155.
Pokrovski, G. S., Schott, J. Farges, F. and Hazemann, J-L. 2003. Iron (III)-silica interactions in aqueous solution: Insights from X-ray absorption fine structure spectroscopy. Geochim Cosmochim Acta
67: 3559-3573.
Putra, A.N, Sudarto and Rayes, M.L. 2013. Studies on the level of soil development on toposequence of the northern slopes of Mount Kawi Malang in East Java.Jurnal Tanah1(1) (in Indonesian).
Qafoku, N.P., Sumner,M. E. and West, L. T. 2000. Mineralogy and chemistry of some variable charge subsoils.Communication of Soil Science and Plant Analysis31: 1051–1070.
Schipper, L. A., Baisden, W. T., Parfitt, R. L., Ross, C., Claydon, J. J. and Arnold, G. C. 2007. Large losses of C and N from soil profiles under pasture in New Zealand during the past 20 years. Global Change Biology13: 1138-1144.
Sinha, R.S., Yamada, K.,Okamoto, M.,Ogami,A.and Ueda, K. 2003. New polylactide/layered silicate
nanocomposites. 3 High performance biodegradable materials. Chemistry of Materials15: 1456-1465. Soil Survey Staff. 2014. Keys to Soil Taxonomy. 11th
ed. USDA-NRCS. Washington DC. p77-96. Tracy, S. R., Black, C. T., Roberts, J. A. and Mooney,
S. J. 2013. Exploring the interacting effect of soil texture and bulk density on root system development in tomato (Solanum lycopersicumL.).
Environmental and Experimental Botany91: 38-47. Van Rast, E., Utami,S.R. and Shamshuddin, J. 2002. Andisols on volcanic ash from Java Island, Indonesia: Physico-chemical properties and classification.Soil Science167 (1): 68-79.
Wiskandar. 2002. Utilization of manure to improve soil physical properties in the terraced critical land area. Soil Science Socity of Indonesia, National Congress VII (in Indonesian).
Xiong, W and Peng, J. 2008. Development and characterization of ferrihydrite-modified diatomite as a phosphorus adsorbent. Water Research 42: 4869-4877.
Appendix 1. The stepwise regression analysis of all variables towards the bulk density
Regression R2 Equation
y = 0.98 – 0.39x 69.7*
y = 0.98 – 0.39x
y = 0.9 -0.32x1+ 0.26x2 74.1
y = 0.9 - 0.26x1+ 0.29x2- 0.02x3 75.8
y = 0.87- 0.27x1+ 0.32x2- 0.04x3+0.02x4 79.8 y = 0.75 -0.19x1+0.44x2-0.05x3+0.02x4+ 3.79x5 83.6 y = 0.81 - 0.17x1+ 0.5x2- 0.05x3+ 0.01x4+ 5.15x5- 0.05x6 85.4 y = 0.6 -0.12x1+0.63x2- 0.03x3-0.003x4+ 9.93x5-0.11x6+0.34x7 87.9 y = 0.63- 0.08x1+ 0.59x2- 0.04x3-0.001x4+ 7.57x5- 0.04x6+ 0.28x7-0.04x8 88.4
* = significant (pvalue<α); y = Bulk Density; x = Ald;x1= Ald; x2= Sio; x3= Alo;x4= OM; x5= Alp; x6= Feo;x7= Fep; x8 = Fed
Appendix 2. The stepwise regression analysis of all variables towards the soil water level at pF 0
Regression R2 Equation
y = 71.42 + 49.33x 0.319*
y = 71.42 + 49.33x
y = 77.14 + 46.19x1- 260.99x2 0.349
y = 66.17 + 54.85x1- 274.17x2+ 3.52x3 0.486
y = 64.18 + 56.73x1- 253.67x2+ 2.52x3+ 0.73x4 0.495 y = 48.23 + 59.11x1- 79.32x2+ 3.92x3+ 0.53x4+ 19.83x5 0.517 y = 48.41 + 58.82x1- 92.38x2+ 3.83x3+ 0.59x4+ 19.04x5+ 0.28x6 0.517 y = 35.36 + 77.27x1+ 204.97x2+ 3.13x3- 0.05x4+ 28.69x5- 2.78x6+ 14.57x7 0.549 y = 36.58 + 75.62x1+ 112.03x2+ 2.72x3- 0.004x4+ 26.15x5+ 0.12x6+ 16.18x7
-1.42x8
0.55
* = significant (pvalue<α); y = Soil water pF 0; x = Sio; x1= Sio; x2= Alp; x3=Alo; x4= OM; x5= Fep; x6= Feo; x7=Ald; x8= Fed
Appendix 3. The stepwise regression analysis of all variables towards the soil water level at pF 2.54
Regression R2 Equation
y = 30.07 + 5.14x 0.353*
y = 30.07 + 5.14x
y = 20.6 + 3.79x1+ 25.74x2 0.502
y = 31.57+4.15x1+14.88x2-318.49 x3 0.564
y = 34.03 +0.66x1+ 9.24x2- 577.02x3+ 7.97x4 0.604 y = 11.39 - 5.99x1+ 18.17x2- 760.08x3+ 21.43x4+ 18.95x5 0.839 y = 4.13 - 1.76x1+ 31.15x2- 521.25x3+ 13.63x4+ 7.58x5+2.99x6 0.887 y = 3.96 -1.76x1+ 32.87x2-497.76x3+13.09x4+ 7.66x5+ 3.32x6-0.22x7 0.888 y = 9.16- 2.61x1+ 26.78x2-661.88x3+16.11x4+ 5.72x5+ 2.94x6+ 0.02x7- 8.53x8 0.893
* = significant (pvalue<α);y = Soil water pF 2.54; x = Fed; x1= Fed; x2= Fep; x3= Alp; x4= Feo; x5= Ald; x6= Alo;x7= OM; x8= Sio
Appendix 4. The stepwise regression analysis of all variables towards the soil water level at pF 4.2
Regression R2 Equation
y = 15.92 + 4.09x 0.483*
y = 8.76 + 3.07x1+ 19.45x2
y = 8.76 + 3.07x1+ 19.45x2 0.667*
y = 9.74+ 3.65x1+ 18.97x2- 1.21x3 0.671
y = 7.94+ 4.17x1+ 21.28x2- 2.51x3+82.79x4 0.675 y = 14.27 + 0.62x1+ 13.69x2+ 6.38x3-285.78x4- 20.28x5 0.785 y = 7.27 - 0.03x1+17.77x2+7.24x3-233.04x4-14.99x5+ 4.48x6 0.806 y = 6.98+1.52x1+ 14.5x2+ 7.07x3-286.78x4- 18.89x5-1.89x6+0.93x7 0.851 y = 6.09 + 1.84x1+16.56x2+6.12x3- 249.42x4- 18.32x5- 2.42x6+ 0.81x7+ 0.37x8 0.852