v
PRODUKSI SAGU PALM (Metroxylon sagu rottb) RESISTAN TIPE III DENGAN METODE HIDROLISIS ASAM-AUTOKLAF SERTA
KARAKTERISASI FISIKOKIMIANYA
Nama Mahasiswa : Wiwit Sri Werdi Pratiwi
NRP : 1412 201 902
Pembimbing : Prof. Dr. Surya Rosa Putra, MS. Dr. Anil Kumar Anal
ABSTRAK
vii
EFFECT OF SiO2/Al2O3 RATIO ON SYNTHESIS ZSM-5 AND ITS CATALYTIC ACTIVITY FOR ESTERIFICATION REACTION
Name : Ummu Bariyah
NRP : 1412 201 003
Supervisor : Prof. Dr. Didik Prasetyoko, M.Sc
ABSTRACT
ZSM-5 with different SiO2/Al2O3 molar ratios i.e. 25, 50, 75 and 100 w ere
synthesized from kaolin without treatment and ludox as alumina and silica source. The solids were characterized using X-ray diffraction (XRD), infrared spectroscopy (IR), scanning electron microscopy (SEM), and pyridine adsorption techniques. XRD and IR results showed that SiO2/Al2O3 molar ratio effect on the phase and
crystallinity of ZSM-5. The morphology and particle size showed similar results, which are joined to form a spherical agglomeration with particle size of about 1-2 μm, as confirmed by SEM. Pyridine adsorption data showed all samples of ZSM-5 have both Lewis and Brønsted acid sites. The catalytic activity of ZSM-5 catalyst were studied in the esterification of kemiri sunan oil. The amount of free fatty acid conversion about 57,95% and the reaction reached equilibrium after 15 minutes.
ix
ACKNOWLEDGEMENTS
All the praise belongs to Allah who is the sustainer of the worlds. Thanks to Allah for His gracious kindness and infinite mercy in all.
Author wants to express her appreciation and deepest gratefulness to:
1. Dr Anil Kumar Anal as her advisor for his valuable advice, guidance, sympathy and encouragement during the entire periods of courses and research. His guidances have helped author in all time of research and study to achieve the best.
2. Prof Athapol Noomhorm and Dr Muanmai Apintanapong for their deeply useful lecture and as committee members who gave author precious advices and comments to improve this research.
3. Prof Surya Rosa Putra, Prof Mardi Santoso, Dr Adi Setyo Purnomo for their guidance, motivation and valuable lecturer especially when author studied at chemistry science-ITS.
Prof. Adi Soeprijanto as the coordinator of Graduate Program of ITS, Ria Asih Aryani Soemitro Ir., M.Eng., DR as the co-coordinator and Dr Matt Syai’in as the coordinator of Fastrack program and Miss Citra Amitiurna for providing great occasion and the great encouragement to study in AIT. 4. My beloved parent for their endless love, who always praying for me to
complete this master study well. Towitt Fawait Afnani and Robi Dwi Setiawan who always care, help and support me every time sothat I can finish my study.
5. DIKTI, Indonesia government scholarship for providing financial supports and guidance.
xi
2.5 Gelatinization of starch 12
2.6 Retrogradation of starch 13
xii
2.13 RS as an encapsulating agent in food production 20
2.14 Emulsion 21
2.15 Casein 22
2.16 Soy protein isolate 23
2.17 The previous studies 23
3 Materials and Methods 27
3.1 Materials 27
3.2 Methods 27
3.3 Statistical analysis 35
4. Result and discussion 37
4.1 Native sago starch analysis 37
4.2 RS starch contents 37
4.3 Chemical compositions 38
4.4 Microstructure analysis 40
4.5 UV/visible spectra analysis 43
4.6 Pasting properties 44
4.7 Solubility 45
4.8 Swelling power 46
4.9 Water holding capacity 47
4.10 Production fish oil emulsion from RS and Casein compared emulsion produced using RS and soy protein isolate (SPI)
49
5 Conclusion and Recommendations 61
5.1 Conclusions 61
5.2 Recommendations 62
References 63
xiii
LIST OF FIGURES
Figure Title Page
1.1 Overall experimental plan 6
2.1 Sago palm 8
2.2 Traditional method of extraction of sago starch 9
2.3 Structure of amylose 10
2.4 Structure of amylopectin 11
2.5 XRD diagrams of starches 14
3.1 Sago starch production by Alini company 27
4.1 Scanning electron microscopy of sago starch 41 4.2 Scanning electron microscopy of hydrolyzed starch by distilled
water
41
4.3 Scanning electron microscopy of lintnerized starch 42 4.4 Scanning electron microscopy of lintnerized-autoclaved starch 42 4.5 UV/visible spectra of native sago starch, hydrolyzed starch by
distilled water (DW), lintnerized starch (L) and lintnerized-autoclaved starch (LA)
43
4.6 Solubility of native sago starch, hydrolyzed starch by distilled water (DW), lintnerized starch (L) and lintnerized-autoclaved starch (LA)
46
4.7 Swelling power of native sago starch, hydrolyzed starch by distilled water (DW), lintnerized starch (L) and lintnerized-autoclaved starch (LA)
47
4.8 Water holding capacity of native sago starch, hydrolyzed starch by distilled water (DW), lintnerized starch (L) and lintnerized-autoclaved starch (LA)
48
4.9 Emulsion capacity of RS and Casein compared Emulsion produced using RS and Soy Protein Isolate
51
4.10 Emulsion stability of RS and Casein compared Emulsion produced using RS and Soy Protein Isolate
xiv
4.11 Stability of fish oil emulsions stored at 4oC (left side) and 25oC
(right side) at 0th days of storage period.
53
4.12 Stability of fish oil emulsions stored at 4oC (left side) and 25oC
(right side) at 0th days of storage period.
54
4.13 Stability of fish oil emulsions stored at 4oC (left side) and 25oC
(right side) at 3rd days of storage period.
54
4.14 Stability of fish oil emulsions stored at 4oC (left side) and 25oC
(right side) at 3rd days of storage period
55
xv
LISTS OF TABLES
Table Title Page
1.1 Variation of Concentration of Acid Citric and Time of Hydrolysis; RS contents
7
2.1 Taxonomy of sago palm 9
2.2 Chemical and physical properties of sago starch 11 2.3 Classified starched based on the action of enzymes 13 2.4 Classified starched based on X-ray diffraction 14 2.5 Some physicochemical properties of caseins 22
2.6 List of the previous researches 23
3.1 Formulations of fish oil emulsions 28
4.1 RS contents of lintnerized starch and lintnerized-autoclaved starch
38
4.2 Chemical compositions of native sago starch, hydrolyzed starch by water, lintnerized starch and lintnerized-autoclaved starch
40
4.3 Pasting properties of native sago starch, hydrolyzed starch by distilled water, lintnerized starch and lintnerized-autoclaved starch.
44
4.4 Viscosity and color value of fish oil emulsion from RS-Casein and RS-SPI
xvii
SEM Scanning electron microscopy
1 CHAPTER 1 INTRODUCTION
1.1 Background
Sago starch is extract of the sago palm (Metroxylon sago rottb).Starch is
highlycollected in the trunk of the sago palm, approximately 250 kg/dry weight plant. In Southeast Asia, It has been considered as one of the important socioeconomic crops, whereby produce 60 milliontones of sago starch annually (Singhalet al., 2008; Ahmad et al., 1999).For a long time, sago starch is used in the food industries for production of traditional foods as sago flour, sago pearl or functional materials (Abdorrezaet al., 2012; Mohamed. et al., 2008). Like other basic starches,characteristics of native sago starch arehigh viscosity, high clarity, low thermal stability, susceptible to acid condition, easily to molded (weak bodied) and gelatinization (Wattanachant et al., 2003; Adzahan, 2002). Besides that, native sago starch undergoes largely break during heating and shearing processes, and alsoretrogradation. Thus, it forms long cohesive gel (Karim et al., 2008).In order to overcome the inherent shortage of native sago starch andimprove its quality for novel food application, native sago starch needs modification.
2
RS is classified to type I (inaccessible starch in a cellular matrix), type II (native uncooked starch granules that form crystalline, and make them difficult to hydrolysis), type III (retrograded starch, which be formed in cooked), type IV (chemical modified starches) (Shamai, K et al., 2003; Aparicio et al., 2005).Nowadays, the scientists interest of RS formation especially utilization of RS in food production. RS has stability in heating processing and also contains high nutritions. RS type III is generated by combination of the gelatinization-retrogradation process. Gelatinization is interference of the granular structure by heating starch with over water, while retro-gradation is a slow recrystallization of starch main component (amylose and amylopectin) by cooling or dehydration. Initially, starch is heated at fix temperature, it will form starch gel. After cooling, the starch gel will affect crystalline structure. During retrogradation process, amylose is re-arrangement, which causes strong crystallization, finally RS type III is formed. Certain factors influence RS type III formation, including amylose content and chain length, autoclaving temperature, storage time and temperature of starch gel (Huai& Li, 2009).
3
toxic and strong acid. It is hoped to decrease application of hydrochloric acid in food industry. Zhao and Yang (2009) suggested that utilization citric acid to de-branch on RS type III formation is better than hydrochloric acid and acetic acid. They have reported that retrograded high amylose maize using citric acid at room temperature shows significantly increase RS yield. Present study is to evaluate optimization of the formation of RS type III of sago starch and its functionto enhance nutrient value then can be applied for food industry-rich healthy ingredient. A lintnerizedmethod which will use is acid citric. It is nutritionally harmless, compared to other derivatization.
On the other hand, fish oil, which is rich source of omega-3polynsaturated fatty acids and very susceptible to lipid oxidation is another important functional compound that is used in food applications, such as fish oil emulsion. Fish oil emulsion needs mixtures of protein and carbohydrate to form the Millard reaction products by increasing emulsifying properties and oxidative stability of fish oil emulsions (Kato, 2002; Morris et al., 2004; Anal et al., 2012). RS which has characteristics such as less solubility, high crystalinity and stability in high process temperature can be used in combination with proteins to prepare fish oil emulsion to keep oxidative stability of fish oil. Nasrin et al., (2014) reported that oil in water emulsions prepared by mixture of culled banana pulp resistant starch and soy protein isolate (SPI) were the most stable than mixture of Hylon VII and SPI or using SPI only, resulting the lowest amount of peroxide value and anisidine value as a total oxidation value which were occurred for storage times. In this study, RS production is utilized as mixture of fish oil emulsion and also by comparing using emulsifiers SPI as protein from vegetable and casein as protein from animal. Britten and Giroux (1991) found that emulsions stabilized with casein showed a better stability than those stabilized by whey proteins. Besides that, Mulvihill and Murphy (1991) reported that emulsions were more stable when using casein as emulsifier than that of sodium caseinate.
.
1.2 Statement of the Problems
4
nutrient, especially to increase its functional ingredients in food productions. To the best our knowledge, present study will use lintnerized-autoclaved method to optimize RS type III. Besides that, RS production will investigated the influence toward fish oil emulsion by comparison using emulsifier from SPI and casein because known RS has characteristics: less solubility, high crystalinity and stability in high process temperature which can stabilize lipid oxidation of fish oil.
1.3 Objectives of the Research
Overall objective of this study is to explore benefit sago starch by producing RS type III, to increase economical value of sago starch,to give the alternative food material-rich dietary fiber, and also to formulate fish oil emulsion by using casein and SPI as emulsifier.
1.3.1 Specific objectives
1. To optimize the lintnerized-autoclaved process to get high RS type III, focus on concentration of acid citric, and time of hydrolysis.
2. To enhance the physicochemical properties of sago starch by comparing physicochemical properties of lintnerized-autoclaved sample with native sago starch, lintnerized starch and hydrolyzed starch by distilled water.
3. To investigate the effect of RS with proteins as emulsifier to produce fish oil emulsion and also to compare those emulsions also using mixture of Hylon VII and emulsifier and using only emulsifier.
1.4 Scope
5
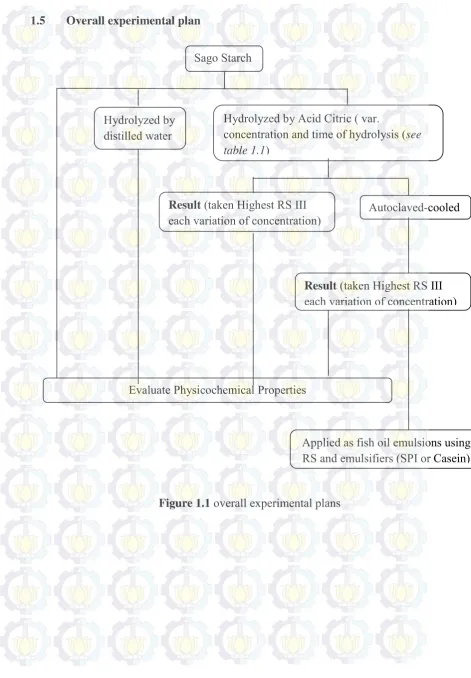
6 1.5 Overall experimental plan
Sago Starch
Result (taken Highest RS III
each variation of concentration) Autoclaved-cooled
Result (taken Highest RS III each variation of concentration)
Evaluate Physicochemical Properties
Applied as fish oil emulsions using RS and emulsifiers (SPI or Casein) Hydrolyzed by
distilled water
Hydrolyzed by Acid Citric ( var.
concentration and time of hydrolysis (see table 1.1)
7
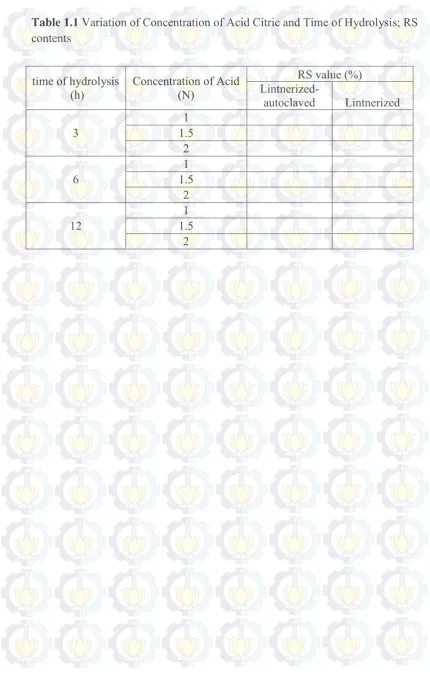
Table 1.1 Variation of Concentration of Acid Citric and Time of Hydrolysis; RS contents
time of hydrolysis
(h) Concentration of Acid (N)
RS value (%)
Lintnerized-autoclaved Lintnerized
3 1.5 1
2
6 1.5 1
2
12 1.5 1
9 CHAPTER 2 LITERATURE REVIEW
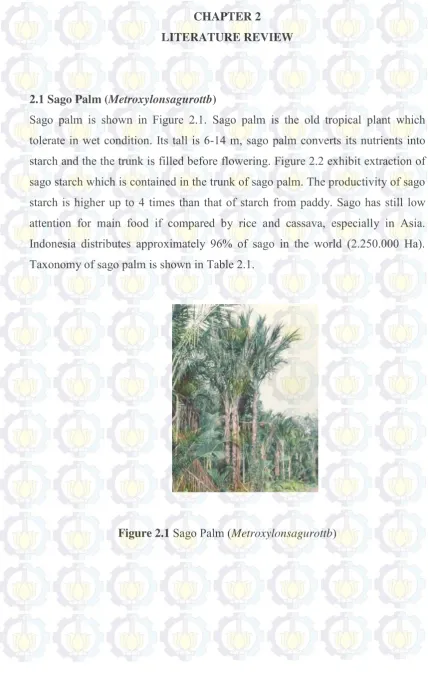
2.1 Sago Palm (Metroxylonsagurottb)
Sago palm is shown in Figure 2.1. Sago palm is the old tropical plant which tolerate in wet condition. Its tall is 6-14 m, sago palm converts its nutrients into starch and the the trunk is filled before flowering. Figure 2.2 exhibit extraction of sago starch which is contained in the trunk of sago palm. The productivity of sago starch is higher up to 4 times than that of starch from paddy. Sago has still low attention for main food if compared by rice and cassava, especially in Asia. Indonesia distributes approximately 96% of sago in the world (2.250.000 Ha). Taxonomy of sago palm is shown in Table 2.1.
10
A B C
Figure 2.2 Sago starch extraction by traditional method. A) Extract is scraped, separated from its peels; B) water is added and mixed them; C) Wet starch is collected.
(Karim et al., 2008).
Table 2.1 Taxonomy of Sago Palm (Source: IT IS report, 2014)
Specification Name
Kingdom Plantae
Division Tracheophyta Subdivision Spermatophytina
Class Magnoliopsida
Order Arecales
Family Arecaceae
Genus MetroxylonRottb
Species MetroxylonsaguRottb
2.2 Starch
11
is utilized to reduce oil absorption fried food, it forms strong film. Thus, high amylose can enhance crispiness. Amylose structure is shown inFigure 2.3 which has a linear structure, degree ofpolymerization around 6000 and a molecular weight of 105 to 106 g/mol, besides that the chains of amylose can easily form helix structure both single and double structure. Characteristics of amylose are also insoluble in water, the structure more compact and resistant to digest by enzymes. Therefore amylose can be used to produce resistant starch. In contrast, Amylopectin which is exhibited in Figure 2.4 has highly branches structure and soluble in water, thus it is so easy to digest by enzymes. Amylopectin has molecular mass 107 to 109 g/mol, and the degree of polymerization approximately 2 million. (Thompson et al., 2002; Sajilata, et al., 2006; Singh, 2012).
12
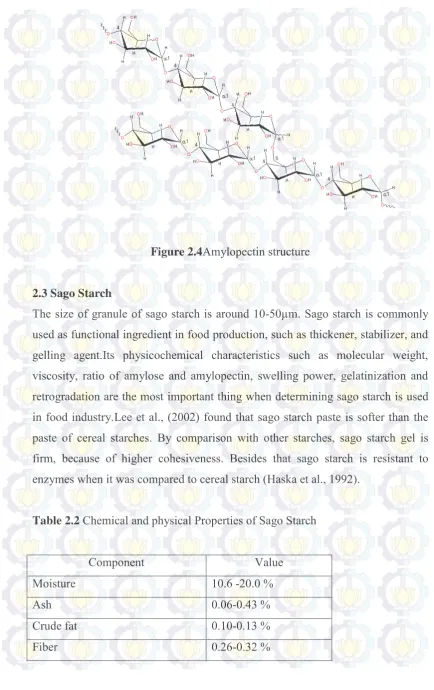
Figure 2.4Amylopectin structure
2.3 Sago Starch
The size of granule of sago starch is around 10-50µm. Sago starch is commonly used as functional ingredient in food production, such as thickener, stabilizer, and gelling agent.Its physicochemical characteristics such as molecular weight, viscosity, ratio of amylose and amylopectin, swelling power, gelatinization and retrogradation are the most important thing when determining sago starch is used in food industry.Lee et al., (2002) found that sago starch paste is softer than the paste of cereal starches. By comparison with other starches, sago starch gel is firm, because of higher cohesiveness. Besides that sago starch is resistant to enzymes when it was compared to cereal starch (Haska et al., 1992).
Table 2.2 Chemical and physical Properties of Sago Starch
Component Value
Moisture 10.6 -20.0 %
Ash 0.06-0.43 %
Crude fat 0.10-0.13 %
13
Crude protein 0.19-0.25 %
Amylose 41 %
Amylopectin 59 %
Molecular weight of amylose 1.41 x10⁶ – 2.23x10⁶
Molecular weight of amylopectin 6.70 x10⁶ – 9.23x10⁶
Viscosity of amylose 310-460 ml/g
Viscosity of amylopectin 6.70x10⁶-9.23x10⁶ ml/g Gelatinization temperature 69.5-70.2oC
(Source: Sim et al., 1991; Ahmad et al., 1999; Nisa et al, 2013).
2.4Swelling Power of Starch
The swelling occurs when starch is added over water and heated it. The starch granule will swell and its volume is over. Double helic structure of starch will break because hydrogen bond of starch is replaced by hydrogen bond of water which makes weaker interaction inside of starch. This interaction is affected by ratio of amylose and amylopectin that directly relates with structure of amorphous and crystalline of starch (Tester and Karkalas, 1996; Hoover ., 2001). Amylose-lipid complex and sodium chloride also affect on swelling of starch which can inhibit interaction between granulastarches. Maximum value of swelling power of sago starch is 31% of sago starch.The swelling decrease when sago starch concentration increase.
2.5 Gelatinization of Starch
14
granules and make up the continuous phase outside the granules (Hermansson and Svegmark, 1996).
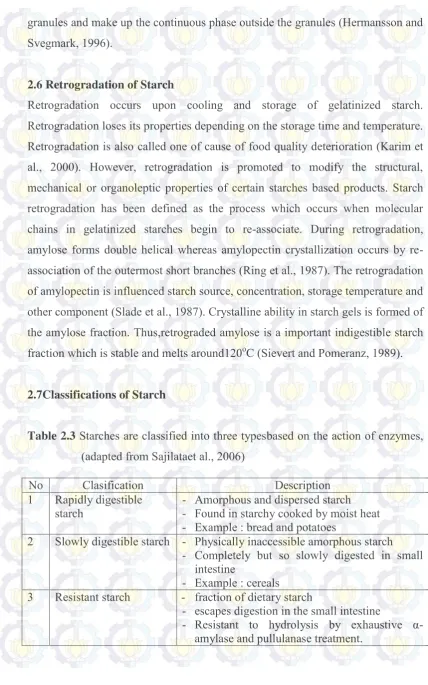
2.6 Retrogradation of Starch
Retrogradation occurs upon cooling and storage of gelatinized starch. Retrogradation loses its properties depending on the storage time and temperature. Retrogradation is also called one of cause of food quality deterioration (Karim et al., 2000). However, retrogradation is promoted to modify the structural, mechanical or organoleptic properties of certain starches based products. Starch retrogradation has been defined as the process which occurs when molecular chains in gelatinized starches begin to re-associate. During retrogradation, amylose forms double helical whereas amylopectin crystallization occurs by re-association of the outermost short branches (Ring et al., 1987). The retrogradation of amylopectin is influenced starch source, concentration, storage temperature and other component (Slade et al., 1987). Crystalline ability in starch gels is formed of the amylose fraction. Thus,retrograded amylose is a important indigestible starch fraction which is stable and melts around120oC (Sievert and Pomeranz, 1989).
2.7Classifications of Starch
Table 2.3 Starches are classified into three typesbased on the action of enzymes, (adapted from Sajilataet al., 2006)
No Clasification Description
1 Rapidly digestible
starch - - Amorphous and dispersed starch Found in starchy cooked by moist heat - Example : bread and potatoes
2 Slowly digestible starch - Physically inaccessible amorphous starch - Completely but so slowly digested in small
intestine
- Example : cereals 3 Resistant starch - fraction of dietary starch
- escapes digestion in the small intestine
15
Table 2.4 Native starches are classified into four typesbased on X-ray diffraction, (adapted from Wu and Sarko, 1978)
This bellow shows X-ray diffraction diagrams of these starches,
No Classifications Description
1 Type A
- Has amylopectin of chain lengths of 23 to 29 glucose units.
- Amylopectin contains 4 water molecules per 12 glucose residues
- The hydrogen bonding of amylopectin form outer double helical structure.
- Linear chain of amylose has densely packed double helices
- Found in cereals
2 Type B
- Has amylopectin of chain length of 30 to 44 glucose units.
- Contains 36 molecules per 12 glucose residues - Loosely packed double helices
- Found in potato and banana.
3 Type C
- A combination of type A and type B
- Has amylopectin of chain length of 26-29 glucose molecules
- Found in beans
4 Type V - - Has single helical Occurs in swollen granules
16
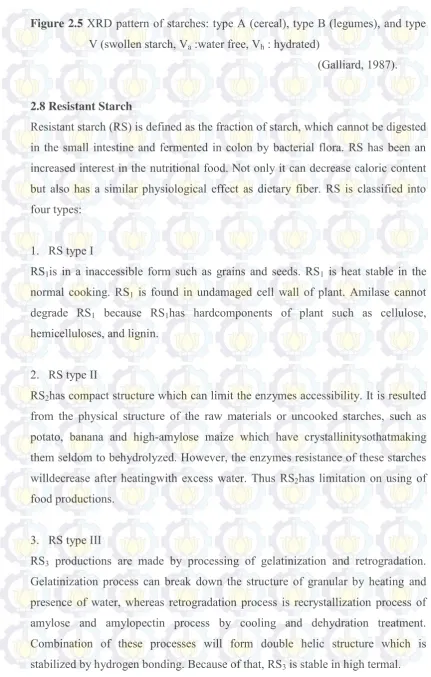
Figure 2.5 XRD pattern of starches: type A (cereal), type B (legumes), and type V (swollen starch, Va :water free, Vh : hydrated)
(Galliard, 1987).
2.8 Resistant Starch
Resistant starch (RS) is defined as the fraction of starch, which cannot be digested in the small intestine and fermented in colon by bacterial flora. RS has been an increased interest in the nutritional food. Not only it can decrease caloric content but also has a similar physiological effect as dietary fiber. RS is classified into four types:
1. RS type I
RS1is in a inaccessible form such as grains and seeds. RS1 is heat stable in the
normal cooking. RS1 is found in undamaged cell wall of plant. Amilase cannot
degrade RS1 because RS1has hardcomponents of plant such as cellulose,
hemicelluloses, and lignin.
2. RS type II
RS2has compact structure which can limit the enzymes accessibility. It is resulted
from the physical structure of the raw materials or uncooked starches, such as potato, banana and high-amylose maize which have crystallinitysothatmaking them seldom to behydrolyzed. However, the enzymes resistance of these starches willdecrease after heatingwith excess water. Thus RS2has limitation on using of
food productions.
3. RS type III
RS3 productions are made by processing of gelatinization and retrogradation.
17 4. RS type IV
RS4is new chemical bonds not only α-(1-4) or α-(1-6) bonding. Certain chemical
modifications to improve the physicochemical properties of sago starch have been studied, such as acetylation, hydroxypropylation and cross-linking. Characteristic of RS4 are more resistant to shear and acidic condition. RS4 is reaction of starch
and chemical reagents that can form ether or ester inter molecular linkages between hydroxyl groups of starch molecules.
2.9 Factors Influence Resistant Starch Certain factors give influence for RS yield :
1. Amylose
Amylose can form complex with lipid which has lower digestibility (Tester et al., 2006; Singh et al., 2010). Amylose-lipid complex reduces contact enzymes and substrate, thus it gives limited digestibility compared to free amylose.
2. Sugar
Englyst et al., (2003) reported that addition of sugars influences the degree of starch gelatinization. It can increase gelatinization temperature. Interaction sugar molecule and starch will change matrix of gelatinized starch, and it can decrease formation of RS.
3. Protein
18 4. Ions
Ions such as K+ and Ca2+also influence on RS formation. These ions inhibit the
formation of hydrogen bonds between amylose and amylopectin chains. Hence, it can decrease RS value (Hoebler et al., 1999).
5. Amylase Inhibitor
Compounds of amylase inhibitor such as tannin acid, lectin, polyphenols can inhibit amylase activity. They can also decrease glycemix index (Thompson et al., 1984)
6. Type, Granular Shape and Crystallinity of Starch
Different type of starch also influences the formation of RS. RS1 (e.g cereals) has
highest resistant in digestion than RS2 (e.g banana and potato). Granular shape,
surface characteristics also influence in RS formation. Small size of starch granules are easilyhydrolyzed by enzyme than that of bigger size (Svihus et al 2005; Noda et al., 2008; Parada, 2009). Crystalinity of starch depends on the chain lengths to build amylopectin lattice, the density of granules and water contents (Wu and Sarko, 1978). The crystalline of A and B hasthe same type of double helices conformation but having different water contents. Break down of plant cell increase interaction of enzyme and then will reduce RS value.
7. Linearization of amylopectin
Linearization of amylopectin also gives impact for RS formation. Linearization occurs during the long low temperature in present of certain organic acid, for example bread productions bake with added lactic acid. Berry (1986) has reported that RS formation increases during wet-autoclave.
2.10 Resistant StarchProcessing
19
changing of moisture, temperature, and duration of heating-cooling cycles (Perera et al., 2010). This below will explain food processing technique.
1. Milling
Milling is a high shear process. When starch granules are milled, their crystalline regions are damaged (Devi et al., 2009). The disruption of granule structure during miling increases the susceptibility to enzyme degradation (Lehmann et al, 2007; Mishra et al., 2009).
2. Cooking
Cooking increases the rate of starch hydrolysis by gelatinizing the starch and making it more easily to be attacked by enzymes (Bornet et al., 1989). Cooking process is done by using over water in high temperature. This treatment can disturb crystalline structure. RS formation increase by steam treatment.
3. Heating-cooling
Heating-cooling process improves the textural properties and also products of this process reduce digestibility of starch by enzymes (Whalen et al., 2000). When the starch gels are cooled, molecules of gelatinized starch begin to retrograde, and increase thecrytallinity of their structures. Hence, starch becomes less susceptible to be hydrolyzed byenzymes such as α-amylase (Oates, 1997; Buleon et al., 1998).Farhat et al., (2000) also reported Storage temperature affected on retrogradation of starch.Gelatinized starch which is stored alternately and repeatedly at cold temperature (4oC) and room temperature (30oC) increase RS
formation. Structure of amylose and amylopectin re-arrange to form crystalline structure. It can reduce digestibility or hydrolysis by enzymes or chemically(Park et al., 2009).
4. Extrusion
20
(1997; Unluet al., 1998;Farhat et al., 2001; Wolf, 2010) but Chanvrier et al., (2007) andHuth et al., (2000) reported that process of extrusion increase in RS value. Kim et al., (2006) also reported that RS contents of wheat flour increase from ranging 0.52% to 2.65% after extrusion.
2.11Resistant Starch Production
Resistant starch can be produce from certain methods.
1. Heat Treatment
Like previous explanation that heat treatment is done by heating with extra water above gelatinization temperature then dehydrated. Optimum result which is done using heat treatment is temperature of 120oC for 20 min. Garcia et al., (1999) studied that heat treatment procedure consist of gelanitinization and retrogradation process. After getting retrograded starch, that sample is dried at 60oC then milled it.
2. Acid Modification
Acid modification is one of chemical method used to prepare RS productions. Lintnerization or partial acid hydrolysis is hydrolysis by using mild acid at below gelatinization temperature of sample. After that process, sample usually is neutralized until neutral pH. Some factors which affect on acid modification are concentration of acid, time of reaction and temperature of hydrolysis. This method can change the properties of starch but it does not change the granula structure of starch. Partial acid hydrolysis improves the solubility adn gel strength of starch but it decreases it viscosity.Lintnerized process which is followed by autoclaving-cooling treatment can increase RS formation.
3. Enzymatic Treatment
21
have reported that maize starch which ishydrolyzed by pullulanase for 12 h, then two autoclaving-cooling cycles increases RS formation.
4. Chemical Modification
RS is also produced by chemical modifications such as acetylation, hydroxypropylation and cross-linking. Several reagents that used for this treatment are epychlorohydrin, phosphoryl chloride, sodium trimetaphosphate, sodium tripolyphosphate, and a mixture of adipic acid and acetic anhydride (Lim et al., 1993; Ratnayake et al., 2008; Carmona et al., 2009).
2.12 Resistant Starch as Dietary Fiber
Dietary fiber is carbohydrates which are resistant to digest in human small intestine but it are fermented in colon (large intestine). Analogous dietary fiber is material which has the similar properties of fiber. Examples of analogous dietary fiber are modified cellulose, resistant starch which has interested the scientists to explore deeply (AACC, 2001). On the other hand, Peres et al.,(2008) andCharalampopoulus et al., (2002) reported that resistant starch has better texture, mounthfeel than pure fibers (grains, or fruit fibers). Thus, resistant starch can be raw material of food production, such as bread, cake, and pasta. Besides that, RS also is health food especially providing energy to bacteria in large intestine which can increase healthy fermentation.
2.13 RS as an encapsulating agent in food production
22
other hand, Sultana et al., (2000) obtained that Hi-maize starch was used to encapsulate Lactobacillus acidophilusand Bifidobacteriumspp, increasing the their
survival in yogurt.
2.14 Emulsion
An emulsion, one of encapsulation techniques, is mixture of two liquids that hold their obvious characteristics, considered immiscible liquids, such as mixtures of fat and water. In oil in water emulsion, oil is defined as the dispersed phase and water is continuous phase. Examples of oil in water emulsion are mayonnaise, cream and milk. Adding more of the continuous phase will thin an emulsion whereas more of the dispersed phase will thicken an emulsion. Only mixture of oil and water cannot mix well so that shearing powers such as shaking, homogenizer are needed in emulsion process to break down the dispersed phase then trapped it into continuous phase. To get smaller of dispersed phase, it needs more shearing power. It also makes emulsion more stable. But in fact, it will be unstable again by nature. Thus, emulsion system needs emulsifiers to make stable a long time.
There are two basic types of emulsifiers: amino acid chains and phospholipids. Amino acid chains will link together, forming proteins. Some amino acid chains have also hydrophobic and hydrophilic part, such as casein. The second form of emulsifiers are phospholipids such as lecithin, found in soy, classified as a surfactant, meaning it has a water friendly head and a fat friendly tail. Lecithin also has a positively charged tail which makes it anhighly effective emulsifier for fat in water emulsion.
23
Temperature; high temperature oxidize lipid rapidly. Recommended, during production and storage, the emulsion should be kept in cold temperature. (5) Emulsifier and pH; emulsifiers can increase the stability of emulsions, it decrease surface tension between oil and water. Level of pH also can affect on emulsion, so it should adjust pH appropriately. (6) Antioxidants have a great influence on oxidative properties of fat. It can grab free ions and oxygen (Mei et al., 1999; Mozyraityle et al., 2006).
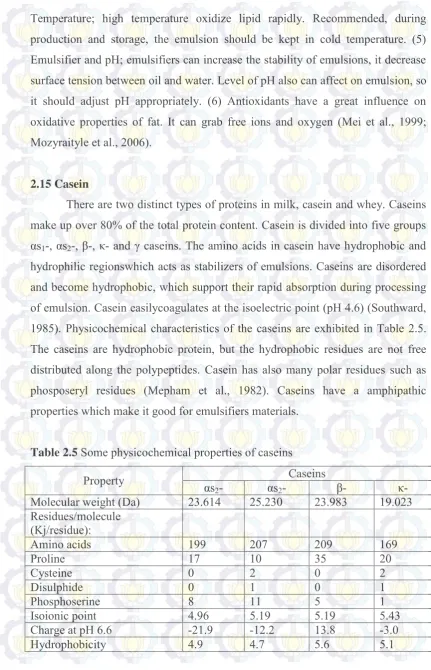
2.15 Casein
There are two distinct types of proteins in milk, casein and whey. Caseins make up over 80% of the total protein content. Casein is divided into five groups αs1-, αs2-, β-, κ- and γ caseins. The amino acids in casein have hydrophobic and
hydrophilic regionswhich acts as stabilizers of emulsions. Caseins are disordered and become hydrophobic, which support their rapid absorption during processing of emulsion. Casein easilycoagulates at the isoelectric point (pH 4.6) (Southward, 1985). Physicochemical characteristics of the caseins are exhibited in Table 2.5. The caseins are hydrophobic protein, but the hydrophobic residues are not free distributed along the polypeptides. Casein has also many polar residues such as phosposeryl residues (Mepham et al., 1982). Caseins have a amphipathic properties which make it good for emulsifiers materials.
Table 2.5 Some physicochemical properties of caseins
Property αs Caseins
2- αs2- β- κ-
24 2.16 Soy protein Isolate
Soy isolate protein (SPI) contains 90% protein, the major components are glycinin and β-conglycinin with the molecular weight 320-375 kD and 140-210 kD respectively. These fractions consist of 34 and 27% of the isolate proteins, respectively. Solubility of SPI in is affected by pH, ionic strength and temperature. Solubility of SPI is high at ends of the pH scale but it is not soluble around its isoelectric point (pH 4.5) (Wolf, 1983; Kinsella, 1979). On the other hand, solubility of SPI increases more than 20% when the temperature is increased up to 50oC (Lee et al., 2003). Heating treatments of SPI dispersions increase viscosity because it candenaturate protein which increase interaction of each protein.
Emulsion capacity (EC) and stability (ES) of soy protein are lowest at the isoelectric points and increase at pH below or above of isoelectric points. EC and ES are also higher for the protein rich β-conglycinin fraction than protein rich with glycinin fraction (Aoki et al., 1980). It relates with properties of hydrophobicity of β-conglycinin fraction. Besides that, emulsion will be better if using high concentration of protein, around 1.25- 1.5 mg/ml. Heating process also influences on SPI properties to prepare good emulsion because heating can increase hydrophobicity of SPI (Santiago et al., 1998).
2.17The Previous Studies
This bellow shows certain previous studies which support this research. Table 2.5 List of the previous research
Title Description Researcher and Years
25
27
29 CHAPTER 3 METHODOLOGY
3.1 Materials
Sago starch was brought from Indonesia, processed by AliniCompany (Figure 3.1). All other chemicals (citric acid, NaOH,sodium maleate buffer, sodium acetate buffer, sulfuric acid, o-dianisidine reagent, iodine, H2SO4, HCl, petroleum
ether, bromocresol green indicator, methyl red indicator, pancreatic α-amylase, amyloglucosidase, acetic acid, chloroform, potassium iodide, iodine, sodium thiosulphate, casein,hylon VII,para-anisidine, glacial acetic, isooctane, fish oil) used in this research were analytical grade.
Figure 3.1 Sago starch production by AliniCompany, Indonesia
3.2 Methods
1. Lintnerization of Starch
The modified methods of Nasrin et al., (2014) were used to produce lintnerized sago starch. Sago starch was suspended into 1 N; 1.5 N; and 2 N citric acid solution at 1:1.5 (w/v) ratios. Mixtures were heated at 60o C and used variation
30 2. Distilled Water Hydrolysis of Sago Starch
Water hydrolysis was prepared according to Zhao and Lin’s method (Zhao and Lin, 2009) with modification. Sago starch (10 g) is dispersed in 40 ml of distilled water and the mixture is autoclaved at 121o C for 1 h. hydrolysis sample was dried
at 40oC for 2 days, cooled down and milled to produce fine particle through 100
mesh sieves and then stored into dessicators.
3. Preparation of Resistant Starch
Samples, includinglintnerized starch and lintnerized-autoclaved starchwere suspended in water (1:10 w/w) and gelatinized at 85o C for 30 min. Samples were autoclaved at 135oC for 30 min, cooled down and store at 4oC for 24 h. Autoclaving-storing treatments were repeated three times at same temperature and time. Samples were dried at 50oC, cooled down, milled and sieved through 100
meshes.
4. Preparation of fish oil emulsion
Mixture starch (using RS or usingHylon VII as native starch rich amylose) and emulsifier (casein or soy protein isolate) based on Table 3.1 were added with water 60oC to get aqueous suspensions (10% total solids, w/w), heated at 100oC,
cooled at room temperature and then frozen and lyophilized. Freeze-dried materials were added fish oil and water based on Table 3.1 to obtain 15% w/w emulsions. Each mixture was blended then homogenized. All emulsions were adjusted at pH 7.5, thenanalyzed for emulsion stability, emulsion capacity, viscosity and color value. Besides that, during storage the emulsions were analyzed peroxide value and anisidine value.
Table 3.1 Formulations of fish oil emulsions Emulsion
systems Emulsifier RS Compositions (% w/w) Hylon
VII Fish oil Water Total solid
E1 7.5 0 0 7.5 85 15
E2 3.75 3.75 0 7.5 85 15
31
5. Analysis of Physicochemical Properties
I. For Lintnerized and lintnerized-autclaved starch samples 1. Resistant Starch
The resistant starch analysis used the methods described by McCleary and Monaghan(2002) with modification. Sample (100 mg) was placed into a centrifuge tube. Sodium maleate buffer 1 M (pH 6.0) containing pancreatic α-amylase (10 mg/ml) and amyloglucosidase (3 U/ml) was added 4 mL. The tube was closed, mixed up on vortex mixer and incubated them in shaking water bath at 37oC for 16 h. The reaction was stopped, added 4 ml ethanol (99%) and
followed by centrifugation at 3000 rpm for 10 min. Supernatant was separated, then starch lump was added ethanol (50% v/v) 8 ml, stirred and centrifuged again.Resistant starch is measured by adding 2 ml KOH 2 M, and added 8 ml sodium acetate buffer 1.2 M (pH 3.8) and 0.1 ml of amyloglucosidase (3000 U/ml). The mixture was incubated with continuous shaking at 50o C for 30 min.
The glucose was determined by glucose oxidase assay.Sampel was added glucose oxidase peroxidase solution containing o-dianisidine reagent, and then incubated at 37oC for 30 min. Sulfuric acids 12 N was added 2 ml to stop its reaction. The
absorbance was measured by spectrophotometer (Model UV2, Unicam, England) at 540 nm( Bergmeyer and Bernt, 1974).
II. For native starch, hydrolyzed starch by distilled water, lintnerized starch and lintnerized-autoclaved starch samples
1. Amylose
32
boiling water bath, cooled and volume of erlenmeyerwas added water until reaching total 100 mL of that erlenmeyer. Mixture was taken 5 ml and poured into other erlenmeyer. Acetic acid 1 N and iodine solution were added 1 ml and 2 ml, respectively. Volume of erlenmeyer was made up to 100 ml with distilled water, waited for 20 min and then absorbance was measured at 620 nm by spectrophotometer (Model UV2, Unicam, England) (Juliano, 1971).
2. Crude Fiber
Samples 2 g were put into flask; added 200 mL hot H2SO4, and then heated at
100o C for 30 min. Residue was separated by filter, mixed with 200 mL NaOH 1.25% solution and heated-stirred again at 100o C for 30 min. After cooling down, residue was separated and washed with hot water and ethanol 95%. Residue was dried, weighed, incinerated at 400o C and reweighed. Crude fiber calculation:
Crude fiber = 𝑤𝑒𝑖𝑔 𝑡𝑙𝑜𝑠𝑠𝑖𝑛 𝑓𝑢𝑟𝑛𝑎𝑐𝑒
𝑤𝑒𝑖𝑔 𝑡𝑜𝑓𝑠𝑎𝑚𝑝𝑙𝑒 x 100 (1)
(AOAC, 2002).
3. Moisture
Sample 5 g was put into petri disk which known weight, then put into an oven pre-set at 110o C for 3 h. Sample was cooled in desiccators and reweighted, then returned into oven at 110o C for 30 minutes until constant weight was obtained (AOAC, 2004).
Moisture content = 𝑤𝑒𝑖𝑔 𝑡𝑜𝑓𝑖𝑛𝑖𝑡𝑖𝑎𝑙 𝑠𝑎𝑚𝑝𝑙𝑒 −𝑤𝑒𝑖𝑔 𝑡𝑜𝑓𝑓𝑖𝑛𝑎𝑙 𝑠𝑎𝑚𝑝𝑙𝑒
𝑤𝑒𝑖𝑔 𝑡𝑜𝑓𝑖𝑛𝑖𝑡𝑖𝑎𝑙 𝑠𝑎𝑚𝑝𝑙𝑒 x 100
(2)
4. Protein
Crude protein was determined by Kjeldahl method. Sample 0.5 g was put in digestion tube. Concentrated H2SO4 and catalyst (CuSO4: K2SO4, 0.5: 1 w/w) was
33
liberated nitrogen bond and form ammonium sulphate. Destilled water and NaOH 40% were added 10 ml and 85 ml respectively into the tube. The distillate 25 mL was gotten, added 4% boric acid and indicator (mixing of 0.1% (w/v) of bromocresol green and 0.1% (w/v) of methyl red. Titration usedHCl 0.1 until color changes (AOAC 2002).
Total Nitrogen = 𝑡𝑖𝑡𝑟𝑎𝑡𝑖𝑜𝑛𝑤𝑒𝑖𝑔 𝑡𝑣𝑜𝑙𝑢𝑚𝑒𝑜𝑓𝑥𝑠𝑎𝑚𝑝𝑙𝑒𝑁𝐻𝑐𝑙 𝑥 14.007x 100 (3)
Protein content = % total N x 6.25 (4)
5. Fat
Crude fat of 2 g sample was determined by AOAC method using Soxtec system (Model HT6, Tecator, Sweden). Crude fat was extracted from sample with 60 mL Petroleum ether which put in weighted glass cup and evaporated 110o C for 30
min for immersion, 30 min for washing and 60 min for recovery time. Yield was dried at 100oC, cooled down and weighed.
Crude fat
=
𝑊𝑒𝑖𝑔 𝑡𝑜𝑓 𝑐𝑢𝑝 𝑎𝑓𝑡𝑒𝑟𝑤𝑒𝑖𝑔 𝑡𝑒𝑥𝑡𝑟𝑎𝑐𝑡𝑖𝑜𝑛 −𝑖𝑛𝑖𝑡𝑖𝑎𝑙𝑜𝑓𝑠𝑎𝑚𝑝𝑙𝑒 𝑤𝑒𝑖𝑔 𝑡𝑜𝑓 𝑐𝑢𝑝x 100 (5)6. Ash
Sample (5 g) was incinerated at 600o C for 3 h in muffle furnace (Model FSE
621-210D, Sanyo Gallenkamp, UK). Previously, silica dish was weighted. After incinerating process, the disk and sample was cooled in desiccator and weighed again.
34 7. Carbohydrate
Carbohydrate content was measured from the total (100) minus of contents of protein, fat, ash, and fiber
Carbohydrate = 100 – (crude fiber + protein + fat + ash) (7)
8. Pasting Properties
Peak properties were measured by Rapid ViscoAnalyzer (Model 4, Newport Scientific Pvt., Ltd. Australia). Sample (2.5 g) were kept into canister and mixed with 25 ml distilled water. Suspended sample was kept at 50o C for 1 minute, then temperature was increased until reached 95oC, kept for 3.2 min, and then decreased to 50o C. Sample was mixed and homogenized with 960 rpm for 10 seconds during starting of test, then decrease 160 rpm and continued it throughout.
9. Swelling Power and Solubility
Swelling power and solubility were analyzed according to Konik’s et al (1993) method. One gram of sample was dispersed in 50 ml distilled water in centrifuge tubes, then heated into water bath at different temperatures (60-95o C) for 30 min
with continuous stirring. Sample was cooled, centrifuged at 3000 rpm for 15 min. Supernatant was dried at 105o C for 5 h. solubility of that sample can be
calculated. While, for swelling determination, wet sample (sediments) was weighted.
Solubility (%) = 𝑊𝑒𝑖𝑔 𝑡𝑜𝑓𝑤𝑒𝑖𝑔 𝑡𝑑𝑟𝑦 𝑠𝑎𝑚𝑝𝑙𝑒𝑜𝑓𝑑𝑟𝑦 𝑖𝑛𝑠𝑎𝑚𝑝𝑙𝑒𝑠𝑢𝑝𝑒𝑟𝑛𝑎𝑡𝑎𝑛𝑡 x 100 (8)
Swelling power (%) = 𝑊𝑒𝑖𝑔 𝑡𝑜𝑓 𝑤𝑒𝑡 𝑟𝑒𝑠𝑖𝑑𝑢𝑒
35 10.Water Holding Capasity (WHC)
Sample (1 g) was dispersed in 50 ml distilled water into centrifuge tube, heated into water bath at different temperature (40-90o C) for 30 min with continuous
stirring. Treated sample was cooled at room temperature, and then centrifuged at 3000 rpm for 20 min. Separated supernatant, sediment was weighted and dried.
WHC = 𝑊𝑒𝑖𝑔 𝑡𝑜𝑓 𝑤𝑒𝑡𝑤𝑒𝑖𝑔 𝑡𝑟𝑒𝑠𝑖𝑑𝑢𝑒 −𝑤𝑒𝑖𝑔 𝑡𝑜𝑓 𝑑𝑟𝑦 𝑟𝑒𝑠𝑖𝑑𝑢𝑒𝑜𝑓𝑑𝑟𝑦 𝑟𝑒𝑠𝑖𝑑𝑢𝑒 x 100 (10)
11.UV visible spectrometer analysis
Sample (1 g) was dispersed in 50 ml distilled water then heated in water bath at 95oC for 30 min with continuous shaking and then cooled at 25oC. Gelatinized
starch (10 ml) was put in Erlenmeyer, added distilled water 25 ml and neutralized with HCl 0.1 M until pH 3. The suspension was mixed with 100 ml distilled water and 0.5 ml of iodine solution. The absorbance was measured at 190-900 nm by UV spectrophotometer ((Model UV2, Unicam, England) (Xin et al., 2012).
12.Scanning Electron Microscopy
The sample particle is sprayed onto the surface of metal plate covered with double-side tape, put into a vacuum chamber. The sample is observed in a tool-coated SEM (S-3400N HITACHI) with an accelerating voltage of 20 kV (Maulani R.R et al., 2013).
III.For emulsion samples
1. Emulsion capacity and emulsion stability
Emulsion capacity and stability was estimated according to Ahmedna et al., (1999) and Abdul et al.,(2000) with some modification. Sample gotten in each emulsion was centrifuged at 2,100xg for 30 min. The ratio of the height of the
emulsified phase to the height of total liquid was emulsion capacity (%) After that, the homogenized sample was incubated at 45oC for 30 min and centrifuged at
2,100xg for 30 min. The ratio of the height of the emulsified phase to the height of
36 2. Peroxide value
Sample (2 ml) was dissolved with 20 ml acetic acid- chloroform (3:2) solution. 0.25 ml of KI 95% was added, incubated shaking water bath 25oC for 1 min and
added 12 ml distilled water. Sample was titrated with 0.01 N sodium thiosulphate solutions until the color changing (transparent). Indicator of soluble starch 1 % was used.
Peroxide value (meq/kg sample) = (Sx M x 1000)/ ml of sample (11)
Where: S = ml of sodium thiosulphate
M= 0.01, concentration of sodium thiosulphate
(AOAC, 1990).
3. Anisidine value
Sample (0.5 ml) was put in volumetric flask 25 ml and made up to volume with isooctane. The absorbance (Ab) of the resulting solutions at 350 nm was determinate. Besides that 5 ml of each solution was pipette into a test tube and reagent also, and then para-anisidine solution (para-anisidine dissolved in acetic acid 0.25 g/100 ml solution) was added to each tube and mixed well. After 10 min, the absorbance (As) of the sample solutions was read. Anisidine value was calculated:
Anisidine value = [25x (1.2 As-Ab)]/ ml of sample (12)
4. Color Spectra
37 5. Viscosity
Sample were determined at 25oC using Brookfield viscometer (model No-LV
DV-II+PX, USA), transferred to a 100 ml beaker and leveled up to the brim. The spindle number 61 was used for all emulsions at the speed of 5 rpm.
3.3 Statistical Analysis
39 CHAPTER 4
RESULTS AND DISCUSSION
4.1 Native Sago Starch Analysis
Native sago starch was analysed for amylose and amylopectin contents.In present study,amylose content of native sago starch was 41.14% whereas its amylopectin content was 58.86%. Anggraini et al., (2013) also found that amylose and amylopectin content of native sago starch were 41% and 59% respectively. Amylose and amylopectin content of starch will affect on resistant starch (RS) formation. Thus, before producing of resistant, it should be known amylose content of raw material.In this research, native sago starch used is proper to product resistant starch type 3 (RS3). Aparico et al., (2005) found amylose content
of banana starch was 37% and it can produce RS3 around 45.5%. Nasrin et al.,
(2014) also reported that amylose content of culled banana starch was 39.8% and it can produce RS around 13%.
4.2 Resistant Starch Contents
40
autoclaving-cooling treatment. Partial acid hydrolysis broke down the amylopectin structure, generating short linear chains so that increasing the mobility of molecules. When autoclaving-cooling treatment, these chains rearranged and recrystallized, forming resistant product which have tightly packed structure stabilized by hydrogen bonding while only partial acid hydrolysis was treated, the resistant product cannot be formed. Therefore lintnerized starch generated low RS.
Table 4.1 RS contents of lintnerized starch and lintnerized-autoclaved starch Time of
Data were mean and standard deviations of three determinations.
4.3 Chemical composition
41
content. Ozturk et al., (2011) reported that after autoclaving, RS value was decrease. Indeed, autoclaving-cooling treatments gave big effect on RS value. Zhao et al., (2009) found effect of cycle times of autoclaving-cooling of maize starch on RS.Maize starch was dispersed in distilled water then autoclaved-cooled, repeated 1-5 times, increasing RS value. Moreover, this case was proved, when hydrolyzed starch by citric acid without autoclaving-cooling treatment resulted low RS and low amylose content.Sandhu, Singh and Lim (2007) reported decreased of amylose contents (from 16.9 % to 13.3 %) after hydrolyzed of corn starch by acid. Atichokudomchai et al., (2000) explained the decreased of amylose content during acid hydrolysis acid that acid attacked the amorphous regions mostly where amylose resides.
42
Table 4.2 Chemical compositions of native sago starch, hydrolyzed starch by water (DW), lintnerized starch (L) and lintnerized-autoclaved starch (LA)
Chemical
composition Native Amount of content (%) DW L LA Amylose 41.14 ± 0.006 30.14 ± 0.001 36.52 ± 0.001 57.20 ± 0.006 Amylopectin 58.86 ± 0.006 69.86 ± 0.001 63.48± 0.001 42.8 ± 0.006 Carbohydrate 97.33 ± 0.017 95.22 ± 0.001 97.31 ± 0.006 96.22 ± 0.025 Protein 0.58 ± 0.058 0.35 ± 0.001 0.26 ± 0.001 0.15 ± 0.058 Fat 1.67 ± 0.006 1.0 ± 0.000 0.83 ± 0.006 0.50 ± 0.000 Ash 0.36 ± 0.000 1.44 ± 0.001 0.45 ± 0.002 0.32 ± 0.001 Crude fiber 0.06 ± 0.005 1.99 ± 0.035 1.15 ± 0.015 2.5 ± 0.044
1. Data were mean and standard deviation of three determinations. 2. Dry basis
3. Production of lintnerization starch uses citric acid 2 N for 12 h.
4. Production of lintnerization-autoclaved starch uses citric acid 2 N for 12 h, and it is autoclaved at 135oC for 30 min and cooled 4oC. Autoclaving-cooling treatments were
repeated three times at same temperature and time.
4.4Microstructure analysis
43
Figure 4.1Granule morphology of sago starch
44
Figure 4.3Granule morphologyof lintnerized starch
45 4.5UV/visible spectra analysis
UV/visible spectra exhibited the amylose-iodine complex at 550-600 nm. From the figure 4.5 there were the difference absorbances of native starch, hydrolyzed starch by distilled water, lintnerized starch and lintnerized-autoclaved starch. The highest intensity of peak was reached by lintnerized-autoclaved starch whereas the lowest intensity of peak was reached by lintnerized starch. Nasrin and Anal (2014) also reported intensity of peak from lintnerized starch of culled banana pulp starch as the lowest value. The present study, values of intensity of peak were lower than lintnerized-autoclaved of culled banana pulp starch, the absorbance was around 0.9.
46 4.6Pasting Properties
The pasting properties of native sago starch, hydrolyzed starch by distilled water, lintnerized starch, and lintnerized-autoclaved starch were analyzed by RVA (Table 4.3). All of the viscosity values (except peak time and pasting temperature) of modified starch samples were found to be less than those of the native starch. Pasting temperature (oC) of hydrolyzed starch by distilled water was higher than native starch while pasting temperature of lintnerized starch and lintnerized- autoclaved starch were not detected. These values are similar with Nasrin’s report (2014), when lintnerized starch using 1 N hydrochloric acid still showed 87.5oC of pasting temperature but lintnerized starch used 1.5 N and 2 N hydrochloric acid, the pasting temperatures (oC) were not detected. Acid hydrolysis caused reduction in the molecular weight of starch, thus the viscosity decreased significantly (Wang L., 2001).Setback value of lintnerized-autoclaved starch was lowest than other samples, indicating that sample had highest retrogradation while through viscosity represented lowest viscosity measuring the capacity of paste to hold out breakdown during cooling.
Table 4.3 Pasting properties of native sago starch, hydrolyzed starch by distilled water, lintnerized starch and lintnerized-autoclaved starch.
47
Data were mean and standard deviation of three determinations.
Native = sago starch; DW = hydrolyzed starch by distilled water; L= lintnerized starch; LA = lintnerized-autoclaved starch
4.7Solubility
Figure 4.6 shows thesolubility of native starch, hydrolyzed starch by distilled water, lintnerized starch and lintnerized-autoclaved starch. Solubility of lintenrized starch drastically increased than other samples. Nasrin et al., (2014) also found increased solubility of lintnerized starch using hydrochloric acid 2N compared lintnerized starch using hydrochloric acid 1N and 1.5 N. In this study, solubility at 95oC of lintnerized-autoclaved sample (52.67%) was almost similar
48
Figure 4.6 Solubility of native sago starch, hydrolyzed starch by distilled water (DW), lintnerized starch (L) and lintnerized-autoclaved starch (LA).
4.8 Swelling power
49
Figure 4.7 Swelling power of native sago starch, hydrolyzed starch by distilled water (DW), lintnerized starch (L) and lintnerized-autoclaved starch (LA)
From Figure 4.7, the lowest value of swelling power at 95oC was lintnerized-autoclaved starch (12. 37%) whereas the highest value at the same temperature was native starch (27.62%). Swelling power of lintnerized starch was 21.71% and for hydrolyzed starch by distilled water was reached 16.69%. In theoretically,lintnerized-autoclaved samples presented lower swelling power (lower water retention features) than native and lintnerized starch. Aparicio et al., (2005) and Nasrin et al., (2014) also found that swelling power of lintnerized-autoclaved starch was lower than native and lintnerized starches.
4.9Water holding capacity
Water holding capacity (WHC) expressed the ability of sample to retain its inherent moisture even though heating was applied to it. Rodriguez et al., (2008) explained that WHC was largely influenced by physical conditions of starch granules, dietary fibre, protein, and amylose contents in the sample. The WHC value at different temperature (40oC-90oC) of native sago starch, hydrolyzedstarch
50
by distilled water, lintnerized starch and lintnerized-autoclaved starch were exhibited in Figure 4.8. The lowest value of WHC at 90oC was
lintnerized-autoclaved starch (10.52%) whereas the highest value of WHC was native starch (20.30%), which proportional with swelling power value. Hydrolyzed starch by distilled water also can hold water capacity (11.79%) compared lintnerized starch (18.39%). Lintnerized starch had most number of available binding sites for water as containingamorphous region in the starch granule. Thus, it made easily to absorb excess water. Lintnerized-autoclaved starch which had dense and compact structure can retain its inherent moisture, resulting lowest of WHC value.
Figure 4.8 Water holding capacity of native sago starch, hydrolyzed starch by distilled water (DW), lintnerized starch (L) and lintnerized-autoclaved starch(LA)
0.00 5.00 10.00 15.00 20.00 25.00
40 50 60 70 80 90
WH
C
(g/g
)
Temperature (⁰C)
native
DW
L
51
4.10 Production Fish oil Emulsions from RS and Casein compared Emulsion produced using RS and Soy Protein Isolate (SPI)
1. Viscosity and color values of emulsions
Viscosities of fish oil emulsions made from RS-casein and RS-SPI were showed in Table 4.4. The ranges of emulsions type from RS-Casein were lower (20.00cP-31.99 cP) than those of RS-SPI (37.05cP-52.07 cP). Nasrin et al., (2014) reported that ranges of viscosity of fish oil emulsions made from mixture of culled banana pulp resistant starch and SPI were (34.60-146.48 cP). For comparison, emulsions from emulsifier (SPI or casein) and Hylon VII were made, resulting lower viscosity compared emulsions made from emulsifier and RS. In each type of emulsions obtained that viscosity increased with decreasing oil load.
52
12.39 (3.75% SPI + 3.75% Hylon VII + 7.5% fish oil). Decreasing b* value of RS-SPI emulsions was proportional with reducing oil load.
Table 4.4 Viscosity and color value of fish oil emulsion from Casein and RS-SPI Data were mean and standard deviation of three determinations.
E1= 7.5% emulsifier (casein or SPI) + 7.5% fish oil; E2= 3.75% emulsifier + 3.75% RS +
7.5% fish oil; E3= 3.75% emulsifier + 3.75% Hylon VII + 7.5% fish oil; E4= 10%
emulsifier + 5% fish oil; E5= 5% SPI + 5% RS + 5% fish oil; E6= 5% Hylon VII + 5%
fish oil.
2. Emulsion capacity and emulsion stability values
53
casein+ 3.75 RS + 7.5% fish oil. Emulsion capacity made from only emulsifier (casein or SPI) with fish oil showed the lower value. When compared emulsion from Hylon VII and emulsifier (casein or SPI), the emulsion capacity also showed lower value. These results indicated that RS may improve emulsifying characteristics. Ozturk et al., (2009) reported emulsion capacity value of mixture Hylon VII and albumin was gotten 12%, this result was higher than using mixture of Hylon VII and casein (3.33%), because the Ozturk’s research didn’t use the same amount of water in the emulsion system, thus the value of emulsion capacity was higher that this research.
Figure 4.9 Emulsion capacity of RS and Casein compared Emulsion produced using RS and Soy Protein Isolate.
54
Emulsion stabilities (Figure 4.10) also exhibited that the highest value was gotten from mixture of emulsifier (Casein or SPI) and RS, but the higher value of emulsion capacity was obtained when using mixture of RS and SPI (11.33%) than that of RS and casein (8.00%).However, emulsion made from RS-casein showed increasing of fish oil load increased emulsion stability value. Ibrahim et al., (2012) and San et al., (2009) reported that the emulsion containing 10% oil was more stable than containing 5% oil, because at higher oil concentration, the packing fraction of oil droplets will increase so that enhancing viscosity of emulsion by reducing the creaming rate. Sun and Gunasekaran (2009) also found that the oil concentration played important role in determining emulsion stability.
On the other hand, all emulsions were immediately kept at cold temperature (4oC) and room temperature (25oC) after preparation of emulsions. Figure 4.11- 4.14
showed stability of fish oil emulsions stored at cold temperature and room temperature during storage period. All emulsions were damaged after 3rd days
kept in room temperature and all emulsions looked like stable in cold temperature at up 9th days, only a little creaming for emulsion (E1) made from RS-casein, but
it can mix well after shaking by hand (see circle mark in Figure 4.14).Mozyraityle et al., (2006) and Rahmani et al., (1998) reported that high temperature contributed to oxidize lipid rapidly and it will be two times more severe per 10o
55
Figure 4.10 Emulsion stabilityof RS and Casein compared Emulsion produced using RS and Soy Protein Isolate
E1= 7.5% emulsifier (casein or SPI) + 7.5% fish oil; E2= 3.75% emulsifier + 3.75% RS +
7.5% fish oil; E3= 3.75% emulsifier + 3.75% Hylon VII + 7.5% fish oil; E4= 10%
emulsifier + 5% fish oil; E5= 5% SPI + 5% RS + 5% fish oil; E6= 5% Hylon VII + 5%
fish oil.
56
E1= 7.5% SPI + 7.5% fish oil; E2= 3.75% SPI + 3.75% RS + 7.5% fish oil; E3= 3.75%
SPI + 3.75% Hylon VII + 7.5% fish oil; E4= 10% SPI + 5% fish oil; E5= 5% SPI + 5%
RS + 5% fish oil; E6= 5% Hylon VII + 5% fish oil.
Figure 4.12 Stability of fish oil emulsions stored at 4oC (left side) and 25oC (right side) at 0th days of storage period.
E1= 7.5% casein + 7.5% fish oil; E2= 3.75% casein + 3.75% RS + 7.5% fish oil; E3=
3.75% casein + 3.75% Hylon VII + 7.5% fish oil; E4= 10% casein + 5% fish oil; E5= 5%
casein + 5% RS + 5% fish oil; E6= 5% Hylon VII + 5% fish oil.
57
E1= 7.5% SPI + 7.5% fish oil; E2= 3.75% SPI + 3.75% RS + 7.5% fish oil; E3= 3.75%
SPI + 3.75% Hylon VII + 7.5% fish oil; E4= 10% SPI + 5% fish oil; E5= 5% SPI + 5%
RS + 5% fish oil; E6= 5% Hylon VII + 5% fish oil.
Figure 4.11 shows stability of fish emulsion at 0th days made from RS and SPI where as Figure 4.12 shows emulsion made from RS and casein. At 0th days all these emulsion looked like the same at room temperature and cold temperature, but after 3rd days of storage periods, emulsions kept in room temperature were broken, figure 4.11 (right side) and figure 4.12 (right side) show differences in damages of emulsions made from RS-SPI and RS-casein. Emulsions made from RS-SPI occurred sedimentation, large droplets were moving faster to the bottom because the density was larger than that of the medium but emulsion (E1) occurred
flocculation, an aggregation of the droplets into larger units without any change in primary droplet size (Tadros, 2013). Besides that, emulsions made from RS-casein also underwent flocculation and a little sedimentation compared emulsions were made from RS-SPI. E1 and E3 from RS-casein emulsions looked like change
the color to yellow; it may be influenced by casein which had also yellow color, because of instability condition, it changed the color of emulsion.
58
E1= 7.5% casein + 7.5% fish oil; E2= 3.75% casein + 3.75% RS + 7.5% fish oil; E3=
3.75% casein + 3.75% Hylon VII + 7.5% fish oil; E4= 10% casein + 5% fish oil; E5= 5%
casein + 5% RS + 5% fish oil; E6= 5% Hylon VII + 5% fish oil.
3. Peroxide and anisidine values of RS and Casein compared Emulsion produced using RS and Soy Protein Isolate
Peroxide value (PV) and anisidine value (AV) were a measure of oxidation or rancidity. PV is an indicator of initial stages of oxidative change, whereby a lipid can be decay or still stable of hydroperoxide concentration by monitoring the amount of hydroperoxides as a function of time. Hydroperoxide is called as primary oxidation products and unstable, so that being susceptible to decomposition become the secondary oxidation products such as aldehydes, ketones, alcohols, epoxy compounds. One of Methods for knowing secondary oxidation products was through anisidine value. AV method measures the content of aldehydes generated during the decomposition of hydroperoxide (Shahidi et al., 2002; Riuz. et al., 2001; Doleschall et al., 2002).
From Figure 4.15-4.18, PV and AV of each emulsion increased with increasing storage time. Peroxide values of emulsions made from RS-casein at the storage time were higher that these of emulsion made from RS-casein. Emulsion made from 5% SPI+ 5% RS+ 5% fish oil (E2) had the lowest of peroxide value (1.67
meq/L) compared other emulsions (Figure 4.15 and 4.16) and also emulsion made from 5% casein+ 5% RS+ 5% fish oil (E2) had the lowest of peroxide value (3.67
meq/L) if compared with emulsion made from only casein or mixture of casein and Hylon VII (Figure 4.15). At the 9th days of storage period, PV of E2 made
from SPI+RS was 6.33 meq/Lwhere as PV of E2 made from casein+RS was 6.67
59
fish oil than emulsion made from RS. The highest of PV was gotten emulsion made from 10% casein+5% oil (25.00 meq/L) and also from 10% SPI+5% fish oil (24.33meq/L). In this present study, emulsifier (casein or SPI) gave high effect because emulsion made from 7.5% emulsifier (casein or SPI)+ 7.5% fish oil result PV < 10 meq/L. Nasrin et al., (2014) reported that emulsion made only 7.5% SPI + 7.5% fish oil were more susceptible to oxidation that made by 10% SPI + 5% oil.
Anisidine values of each emulsion were shown in Figure 4.17-4.18. Each emulsion made from RS-casein had lower value than made from RS-SPI. However, emulsion made from 5% emulsifier (casein or SPI)+ 5% RS+ 5% fish oil was lower value than other emulsion systems. At the 0th day, the AV made from 5% SPI+ 5% Hylon VII+ 5% fish oil were the highest value (4.86) compared other emulsions (AV< 2), but that value was still lower than Nasrin’s report which showed that AV of all emulsions at 0th days were more than 6.
Figure 4.14 Peroxide valueof emulsions from RS and Casein
60
E1= 7.5% casein + 7.5% fish oil; E2= 3.75% casein + 3.75% RS + 7.5% fish oil; E3=
3.75% casein + 3.75% Hylon VII + 7.5% fish oil; E4= 10% casein + 5% fish oil; E5= 5%
casein + 5% RS + 5% fish oil; E6= 5% Hylon VII + 5% fish oil.
Figure 4.16 Peroxide valueof emulsions from RS and SPI
61
Figure 4.17 Anisidinevalueof emulsions from RS and Casein
E1= 7.5% casein + 7.5% fish oil; E2= 3.75% casein + 3.75% RS + 7.5% fish oil; E3=
3.75% casein + 3.75% Hylon VII + 7.5% fish oil; E4= 10% casein + 5% fish oil; E5= 5%
casein + 5% RS + 5% fish oil; E6= 5% Hylon VII + 5% fish oil.
Figure 4.18 Anisidinevalueof emulsions from RS and SPI
62
E1= 7.5% SPI + 7.5% fish oil; E2= 3.75% SPI + 3.75% RS + 7.5% fish oil; E3= 3.75%
SPI + 3.75% Hylon VII + 7.5% fish oil; E4= 10% SPI + 5% fish oil; E5= 5% SPI + 5%