Chapter 7
Chapter 7: Balance of Payments
Indonesia’s Balance of Payments continued to show positive performance. At the end of 2007,
the Balance of Payments recorded a surplus that mainly came from current account amounting to
2.5% of GDP. The increase in the current account surplus was driven by higher commodity prices
in international markets and fairly strong global demand. Meanwhile, the surplus in the capital and
financial accounts was supported by the attractive return on rupiah in the domestic financial market
and the continued domestic macroeconomic stability. With these developments, foreign exchange
reserves continued to accumulate, thereby having a positive impact on the confidence of players
in the economy whilst also subduing the impact of the shocks from global financial markets. In
general, the Balance of Payments performance and external vulnerability indicators continued to
improve, such that rupiah stability was achieved.
The Balance of Payments in 2007 shows continuing strong developments. The condition of global economy and the domestic economy were still conducive for improvements in the performance of Balance of Payments. From the international side, despite slower than 2006, the global economy in 2007 still expanded fairly rapidly. The impact of slowing US economy on global economy was offset by strong growth in the developing countries like China and India. Nonetheless, the fairly rapid global economic expansion which continued in the first semester of 2007 was hampered due to shocks in the global financial markets as a result of the US sub-prime mortgage crisis. The main impact of this crisis was the reversal of private capital flow from developing countries, starting at the beginning of the second semester of 2007. The strength of the economies of emerging market countries increased foreign investors’ interest, and hence supported the positive developments of Indonesia’s financial markets.
From the domestic side, various improvements in the macroeconomic field already provided a strong foundation, such that Indonesia’s financial markets stood up well when facing external shocks. The inflow of foreign capital, either in the form of direct investment (FDI) or portfolio investment, have continued and increased compared to their levels in 2006. The return
on the rupiah was still attractive compared to the returns offered in neighboring countries, and was in line with the lower risk factor, as shown by the rating upgrades from various ratings agencies, thus bringing in more foreign investment to Indonesia.
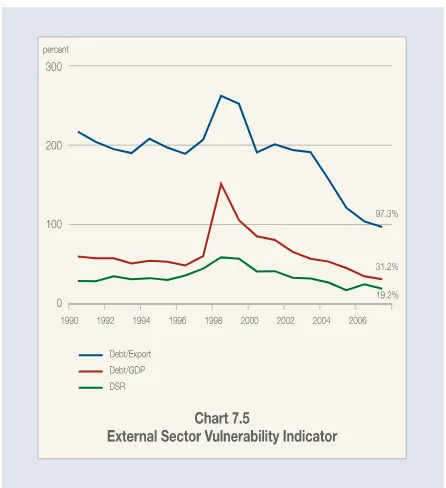
The increase in domestic economic activities as reflected in higher investment and consumption, helped boost imports. Nonetheless, the increase in the value of exports, which is greater than the increase in the value of imports, resulted in a higher trade surplus. Given these developments, the Balance of Payments recorded a fairly high surplus of $12.5 billion such that the nation’s foreign exchange reserves rose to $56.9 billion equivalent to 5.7 months of imports and repayments of government foreign debt (Table 7.1). In line with these developments, the external vulnerability indicators showed an
improvement compared to 2006 (Table 7.2).
101
regulations1. Besides that, the government also issued apolicy to boost exports, especially of textile commodities and textile products, by giving aid for machinery purchases as well as providing low cost financing. Other policies in managing the government’s foreign debts in a more independent way were marked with the scrapping of the CGI forum which had for some time been a forum for Indonesia’s creditors. The scrapping of the CGI was also in line with the government’s policy to lessen the country’s dependency on foreign financing and efforts to lower Indonesia’s debt ratio such that resistance to external shocks has improved.
1 Among others are the Law No. 25/2007 concerning Foreign Investment and Presidential Instruction No. 6/2007 concerning policies to accelerate the development of the real sector and the empowerment of micro, small and medium size businesses.
Current Account
The current account recorded a higher surplus of $11.0 billion or 2.5% of GDP (Table 7.3). In line with rising prices of commodities in the international markets and the fairly strong external demand, the value of Indonesia’s exports recorded a fairly large increase. In the non oil and gas mining sector, the increase in export volume was also supported by greater production capacity. In the oil and gas mining sector, especially oil, although there has been a natural decline in production each year, the volume of crude oil exports still experienced an increase. From the side of imports, increasing domestic economic activities and the relatively stable rupiah exchange rate helped propel imports growth higher. Imports of crude oil also experienced an increase to help fulfill the domestic refinery needs.
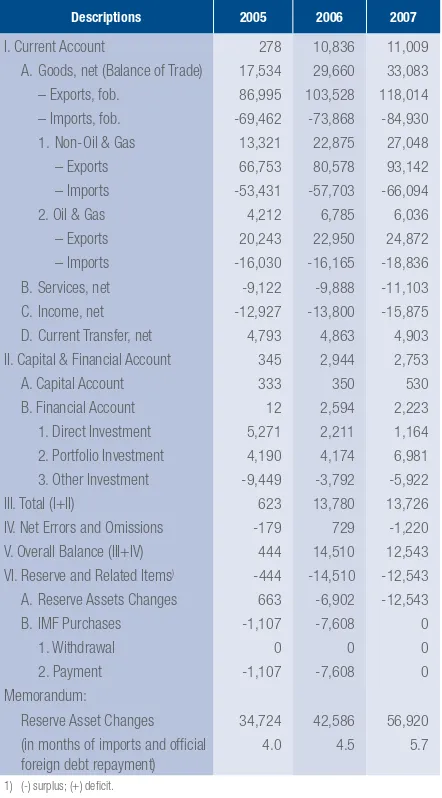
Table 7.1
Indonesia’s Balance of Payments
millions of $
Descriptions 2005 2006 2007
I. Current Account 278 10,836 11,009
A. Goods, net (Balance of Trade) 17,534 29,660 33,083
– Exports, fob. 86,995 103,528 118,014
– Imports, fob. -69,462 -73,868 -84,930 1. Non-Oil & Gas 13,321 22,875 27,048
– Exports 66,753 80,578 93,142
– Imports -53,431 -57,703 -66,094
2. Oil & Gas 4,212 6,785 6,036
– Exports 20,243 22,950 24,872
– Imports -16,030 -16,165 -18,836
B. Services, net -9,122 -9,888 -11,103
C. Income, net -12,927 -13,800 -15,875
D. Current Transfer, net 4,793 4,863 4,903 II. Capital & Financial Account 345 2,944 2,753
A. Capital Account 333 350 530
B. Financial Account 12 2,594 2,223
1. Direct Investment 5,271 2,211 1,164
2. Portfolio Investment 4,190 4,174 6,981 3. Other Investment -9,449 -3,792 -5,922
III. Total (I+II) 623 13,780 13,726
IV. Net Errors and Omissions -179 729 -1,220 V. Overall Balance (III+IV) 444 14,510 12,543 VI. Reserve and Related Items) -444 -14,510 -12,543 A. Reserve Assets Changes 663 -6,902 -12,543
B. IMF Purchases -1,107 -7,608 0
1. Withdrawal 0 0 0
2. Payment -1,107 -7,608 0
Memorandum:
Reserve Asset Changes 34,724 42,586 56,920 (in months of imports and official
foreign debt repayment)
4.0 4.5 5.7
1) (-) surplus; (+) deficit.
Table 7.2
Indicators of External Vulnerability
percent
Descriptions 1996 1997 2005 2006 2007
Current Account/GDP -3.4 -2.3 0.1 2.9 2.5
Exports of Goods and
Services/GDP 25.7 29.1 37.5 33.5 32.0
Non-Oil & Gas Exports/
GDP 16.7 19.7 23.1 21.8 21.2
Foreign Debt Interest/
GDP 2.7 3.0 1.0 1.3 1.2
Foreign Debt Payments/ Exports of Goods and Services1)
35.9 44.5 17.3 24.8 19.2
Capital Flows/GDP 4.8 1.1 0.1 0.7 1.3
Foreign Debt/Exports of
Goods and Services 188.7 207.3 120.7 104.1 97.3
Foreign Debt/GDP 48.5 60.3 45.3 34.9 31.2
International Reserves/
Debt Services2) 91.2 73.4 185.6 138.8 210.8 International Reserves/
Foreign Debt 17.4 15.7 26.6 33.1 41.7
International Reserves/ Imports and Government Foreign Debt Payments (months)3)
5 5.5 4.3 4.5 5.7
Foreign Debt (billions $) 110,171 136,088 130,652 128,736 136,640 International Reserves
(billions $)4) 19,215 21,418 34,724 42,586 56,920 Source: Bank Indonesia and BPS-Statistics Indonesia.
1) Debt Service Ratio (DSR) increase in 2006 due to IMF debt repayment. 2) Foreign debt repayments including principal and interest.
3) In 1996 and 1997, the international reserves divisor did not include payments on government foreign debt.
The services account and the net income account recorded a higher deficit compared to 2006. The increase in the services account deficit is related to the increase in the number of foreign tourist visits, while for the income account the increase was related to an increase in profit transfers to company head offices overseas as business activities in Indonesia improved further.
For the current account, the surplus was relatively the same as in the previous year, among other things supported by hikes in the wages of Indonesian overseas
workers in 2007, especially in a number of countries in the Middle East.
Export Developments
Exports grew fairly strongly, driven mainly by non oil and gas exports. The total value of exports in 2007 rose 14.0% to $118.0 billion (Table 7.4). The increase in the value of exports was mainly attributable to higher commodity prices, although the increase in export volume was also seen among several commodities. Nonetheless, the increased volumes were not uniform and were still concentrated in natural resource commodities, especially mining commodities. This was in line with the tendency of price increases among mining commodities which has been evident since 2004. Meanwhile, increases in industry volume exports had not been uniform, and there was even a decline in exports of main commodities such as CPO derivatives
Table 7.3 Current Account
millions of $
Descriptions 2005 2006 2007
Current Account 278 10,836 11,009
– Non-Oil & Gas -2,548 5,424 6,225
– Oil & Gas 2,826 5,412 4,784
Goods, net (Balance of Trade) 17,534 29,660 33,083 – Non-Oil & Gas 13,321 22,875 27,048
– Oil & Gas 4,212 6,785 6,036
Exports, fob 86,995 103,528 118,014
– Non-Oil & Gas 66,753 80,578 93,142
– Oil & Gas 20,243 22,950 24,872
Imports, fob -69,462 -73,868 -84,930
– Non-Oil & Gas -53,431 -57,703 -66,094 – Oil & Gas -16,030 -16,165 -18,836
Services, net -9,122 -9,888 -11,103
Income, net -12,927 -13,800 -15,875
Current Transfer, net 4,793 4,863 4,903
Table 7.4 Exports
Descriptions
2006 2007 2007
Changes (%) fob Value (millions of $)
Share (%)
Non-Oil & Gas Exports 20.7 15.6 93.142 78.9
Agriculture 255.4 14.7 11.704 9.9
Mining 130.1 17.2 21.609 18.3
Industry -7.0 15.2 59.829 50.7
Oil & Gas Exports 13.4 8.4 24.872 21.1
Total 19.0 14.0 118.014 100.0
Source: BI and BPS-Statistics Indonesia.
IHKEI Growth
(yoy) 2005 2006 2007 Non Oil and Gas 12.6 33.8 14.9 Agriculture 13.4 35.7 9.5 Mining 26.6 50.3 10.5 Manufacturing -2.8 9.9 26.1 Oil and Gas 29.6 19.0 6.6
103
and electrical equipment. This was also the case forthe performance of the oil and gas sector, which has not shown a significant improvement and still shows a decline in natural production due to the rather slow response of investors in regard to the exploration of new oil fields.
The increase in commodity prices on international markets is still the main factor behind the increase in the value of non oil and gas exports. The price of Indonesia’s non oil and gas export commodities rose by 14.9% overall compared to 2006 (Chart 7.1). In more detail, the increases in prices in the agriculture group, the mining group, and the manufacturing group reached 9.5%, 10.5%, and 26.1%, respectively. A number of commodities that experienced fairly large price increases include CPO (74.1%), nickel (55.6%), tin (65.5%), and coffee (25.7%). In line with price increases which have gone on for some time now, a number of export commodities showed increased volumes, among others nickel, aluminum, machinery and mechanical equipment, along with chemical products. Nonetheless, a number of commodities experienced lower volume, among them some main commodities such as CPO derivatives, shrimps, copper, textile and product textiles, as well as electrical equipment.
Amidst the rising prices of commodity globally, the opportunity to raise export volume of a number of commodities could not be realized due to a number of problems. One commodity which experienced a fairly significant drop in export volume is CPO and its derivatives. The drop in CPO export volumes which occurred at the beginning of the year was related to the peak in the harvesting of fresh palm fruits which
shifted forward to the end of 2006 from the beginning of 2007. Meanwhile, the reason for the drop in exports of CPO derivatives was related to the increase in CPO export taxes in the middle of the year following scarcity of cooking oil in the domestic market2. The government increased export taxes to safeguard the stability of the prices of basic needs – especially cooking oil - in the domestic market. However, in terms of potential, the opportunity to increase CPO exports is still open given the wide area of CPO plantations in Indonesia, which have continued to increase and become the largest in the world. Currently, the total area in use is around 5.5 million hectares with around another 3.7 million hectares that can be developed.
The problems of increasing export volumes were also seen in copper commodities. The drop in copper export volume was related to labor force problems. Meanwhile, the drop in shrimp exports was related to the continuation of mudflows in Sidoarjo which had an impact on the centralized shrimp ponds in the province of East Java, which is one of the centers of shrimp production. Problems regarding textile and textile-related products, in relation to the relatively low productivity of the machinery used, have been evident for some time now. The low productivity levels reduced output and had an impact on the variation and quality of the products. With regard to this matter, the government issued a policy on the development of exports of textile and textile-related products by providing help for the purchase of machinery in addition to low interest rate loans. This policy is expected to help in the restoration of
2 Minister of Finance Regulation No. 61/PMK,011/2007 dated15 June 2007 concerning the fifth change of Minister of Finance Regulation No. 92/PMK,02/2005 concerning the determination of types of export goods and rates of export tariff.
Table 7.5
Major Non-Oil and Gas Export Commodities Share by Country of Destination in Year 2007
Japan United States Singapore China India
Commodities Share Commodities Share Commodities Share Commodities Share Commodities Share
Metal Ores &
Metal Residual 4.22 Garments 3.84
Electrical Machines. Tools & Fittings
1.35 Fixed Vegetable Oil & Fats 1.33
Fixed Vegetable Oil & Fats 2.36
Coal, Coke &
Briquettes 1.4 Crude Rubber 1.29
Office Machinery & Automatic Data Processing
1.05 Metal Ores &
Metal Residual 0.82
Coal, Coke &
Briquettes 0.93
Nonferrous Metal 1.23 Fish & Crust 0.81 Nonferrous Metal 0.98 Crude Rubber 0.78 Metal Ores &
Metal Residual 0.57 Electrical Machines, Tools & Fittings 0.93 Manufacturing Goods 0.62 Telecommunication
& Rep App 0.64
Organic
Chemicals 0.59
machinery in the textile and textile-related sector, such that more competitive products can be produced for sale in the international market.
The good performance of exports at a time of slowing global growth was also driven by efforts to diversify the countries to which Indonesia’s products are exported. Although exports are still focused to a number of main destination countries, intraregional trade (i.e. in Asia) increased. The five main destination countries for Indonesia’s non oil and gas exports are Japan (14.3%), the US (12.0%), Singapore (9.6%), China (7.3%), and India (5.3%) (Chart 7.2). The total share of exports to these five countries reached around 48.5% of Indonesia’s total non oil and gas exports, slightly down compared to 2006. Scrutinized more closely, it can be seen that there are positive developments such that Indonesia has become less dependent on developed nations as main trading partners. The share of non oil and gas exports to the US, Japan and the European region are currently around 40% of the total, or down from 50% in 2000. By spreading out the share of exports to different destination countries, it is hoped that Indonesia’s exports performance will become more flexible in anticipating the changes in the economic cycle in a number of the county’s trading partners, especially any slowdown in the economies of developed nations (Box: Intraregional Trade in Asia).
The types of commodities exported to Indonesia’s main trading partners were quite mixed (Table 7.5). The main non oil and gas commodities exported to the US and Japan were clothing and metal ore, respectively. Meanwhile, exports to China and India, were dominated by exports of vegetable oils and fats. The other
commodity exports were relatively well distributed – a positive development. Such a condition can lessen
Table 7.6
Revealed Comparative Advantage (RCA)
Description SITC RCA World Rank
1)
2004 2005 2006 2004 2005 2006
Agriculture
– Shrimps, Crust, etc, fresh/frozen 036 9.4 6.2 7.1 3 6 4
– Coffee 071 3.9 4.0 4.1 9 6 5
– Cocoa 072 12.1 9.4 10.8 3 4 4
– Natural Rubber Latex & Other Natural Rubber 231 66.0 14.5 35.6 1 2 2
Mining
– Copper Ores 283 20.6 12.8 16.9 2 2 2
– Coal 321 11.6 9.5 14.0 4 3 2
– Tin Products 687 29.1 34.3 31.5 1 1 1
Industry
– Textile Products
– Textile Yarn 651 8.1 4.9 4.9 7 7 7
– Men/Boy Apparels Knitted 843 2.8 2.3 3.2 12 12 6
– Wood & Wood’s Products
– Charcoal 245 7.2 5.6 6.0 5 2 3
– Plywood, etc 634 8.4 8.8 6.8 4 3 5
– Wood Goods 635 5.2 4.4 4.2 6 7 6
Other Fixed Vegetable Oil, liquid or thick (CPO) 422 46.6 39.5 42.2 2 1 1
Source: UNCOMTRADE.
105
the dependency on certain products as well as certainexport destinations.
In general, Indonesia’s export products are still concentrated on natural resource based commodities. Based on the competitiveness indicator which is measured from the Revealed Comparative Advantage (RCA), Indonesia’s prime commodities exports are still competitive. Agricultural commodities (such as natural rubber) have a high RCA and are ranked second in terms of value of Indonesia’s exports. Mining commodities, such as tin, copper and coal, also have a fairly high competitiveness and are ranked first in world trade. Meanwhile, in the industrial goods group, CPO had the highest RCA (Table 7.6).
During 2007, the rupiah remained stable, thereby supporting Indonesia’s competitiveness. On average, the rupiah tended to strengthen in 2007. Nonetheless, compared with other countries in the region, the strengthening of the rupiah was still relatively low such that it supported Indonesia’s exports competitiveness from the side of prices.
The value of Indonesia’s oil and gas exports rose in line with the rising price of crude oil in international markets. The value of oil and gas exports rose by 8.4% to $24.9 billion. This growth was driven more by soaring prices of crude oil. On average, the price of various types of crude oil in international markets experienced increases, and for the WTI type the price even approached the $100 per barrel in November 2007 (Chart 7.3).
Developments in fundamental factors, which were reflected in a limited increase in supply and low remaining oil production capacity, meant the price of oil was vulnerable to non-fundamental factors such as sentiment
and geopolitical factors. Besides that, the weakening trend in the value of the US dollar triggered an increase in speculation by increasing noncommercial transactions in the oil market. As a result of these developments, the average price of Indonesia’s crude oil exports rose 12.2% to $70.1 per barrel in 2007.
Based on contribution, the value of gas exports were slightly lower than the value of oil exports. In 2007, gas exports reached $12.4 billion, while oil exports reached $12.5 billion. From the volume side, although there was a tendency for oil production to decline, crude oil exports still showed an increase. This stemmed from the fact that the use of domestic oil for processing in domestic refineries is still not optimal. From another aspect, oil imports, either crude or derived products, also continued to show an increase for fulfilling refinery requirements and domestic fuel consumption. Meanwhile, for gas, the increase in the value of exports was not accompanied by an increase in volume. This condition was related to government policies that prioritized the use of natural gas for domestic use, among others to support the government’s program to persuade the public to switch from using kerosene to LPG.
Import Developments
Imports growth was quite high and in line with the more rapid pace of economic growth. Overall, total imports (C&F) grew by 15.0% to $92.4 billion (Table 7.7). The
Table 7.7 Imports
Description
2006 2007* 2007
Changes (%) C & F Value
(millions $) Share (%)
Non-Oil & Gas Imports
8.0 14.6 71.907 78.2
Consumer Goods 18.4 46.8 7.241 6.1
Raw Materials 7.8 12.0 50.502 56.1
Capital Goods 5.4 11.0 14.164 15.9
Oil & Gas Imports 3.0 16.7 20.474 21.8
quite significant increase in imports was experienced by oil due to higher oil prices, the decline in domestic production and the increase in domestic fuel
consumption. The stability of rupiah helped push imports of non oil and gas products higher, especially imports of consumption goods which rose 46.8%. Nonetheless, the increase in imports needs to be looked at in closer detail, since it might indicate that the competitiveness of domestically made products has declined further. Meanwhile, imports of capital goods and raw materials also showed an increase in line with the domestic economic expansion.
Based on the country of origin, the proportion of imports from the five main countries was relatively unchanged. Overall, the proportion of non oil and gas imports (C&F) from the top five countries reached 54.5% or $39.2 billion, or relatively unchanged from the proportion in 2006 of 56.5% (Chart 7.4). The higher penetration of goods imported from China means that the proportion of goods imported from China is already as large as the proportion of goods imported from Japan. The imports of cheap products from China are a substitute for imports of goods from other countries, such that imports from Japan and the US tended to show a decline. The type of imported products from Indonesia’s main trading partners was fairly mixed. Imports of vehicles were mainly from Japan and Thailand. Meanwhile, imports of machinery generally originated from Indonesia’s top five trading partners, with Singapore providing the largest proportion (Table 7.8).
Developments in the Services Account, the Net Income Account, and the Current Account
The deficit in the services account and the net income account experienced an increase, while the surplus in the current account was relatively unchanged. The increase in the deficit for the services account mainly originated from an increase in transportation costs for imports and the flow of Indonesian tourists to other countries, including overseas travel for Hajj and Umroh. From the side of receipts, the flow of incoming foreign exchange was mainly contributed by foreign tourists whose number increased to 5.5 million or reaching a new high. The increase in foreign tourist visits reflects the improved security conditions, along with an increase in MICE (meetings, incentives, conferences and exhibitions) on an international scale. Various efforts have already been made by a number of parties including the government to attract foreign tourists including promotions in a number of tourism exhibitions, developments in main tourism regions, in addition to the increase in the number of countries which received the visa on arrival (VOA) facility from 52 in 2006 to 63 at the end of 2007.
The deficit in the net income account rose 15.0% to $15.9 billion. The increase in the deficit mainly stemmed from an increase in the profits transferred and the reinvested earnings of multinational companies in Indonesia. This reflects the better profitability of multinational companies resulted from Indonesia’s improving business prospects. Meanwhile, the current account recorded a surplus mainly due to the contribution from money transfers made by Indonesian overseas workers. In 2007, the incoming funds transferred by Indonesian overseas workers recorded
Table 7.8
Major Non-Oil and Gas Import Commodities Share by Country of Origin
Singapore Japan China United States Thailand
Commodities Share Commodities Share Commodities Share Commodities Share Commodities Share
Electrical Machines,
Tools & Fittings 2.24 Motor Vehicles 1.92 Iron & Steel 1.65 Other Transportation Equipment
0.89 Motor Vehicles 1.53
Telecommunications
& Rep. App 1.44 Iron & Steel 1.56
Telecommunications & Rep. App 1.23
Industrial Machinery & Fittings
0.54 Sugar & Honey 0.49
Organic Chemicals 1.43
Specialized Industrial Machinery
1.25 Electrical Machines, Tools & Fittings 0.96
Textile Fiber &
their waste 0.53
Industrial Machinery & Fittings
0.43
Office Machines & Automatic Data Processor
1.10
Industrial Machinery & Fittings
1.23 Textile, Textile Yarn & Textile Products 0.93
Oil Ores, Nuts &
Seeds Oil 0.52
Electrical Machines, Tools & Fittings
107
a surplus of $4.9 billion or up 7%. One effort related tothe development of Indonesian overseas workers was the wage increases for Indonesian overseas workers in a number of countries and especially the Middle East in 20073. Based on country, Saudi Arabia and Malaysia remained the largest employers of Indonesian overseas workers. Overall, positions filled by Indonesian overseas workers in 2007 reached 4.3 million, or lower than the 4.6 million in 2006.
Capital and Financial Transactions
Compared to the previous year, the capital account and the financial account recorded a lower surplus of $2.8 billion. Based on its composition, the net inflow of portfolio investment was still quite dominant, while foreign direct investment (FDI) showed positive developments. The continued high return on the rupiah and the macroeconomic stability encouraged inflows of portfolio investments. Meanwhile, some progress on the infrastructure front has helped create a more conducive investment climate, thus giving a boost to FDI.
Direct Investment Transactions
In 2007, FDI recorded a surplus that was lower than in the previous year, yet with a more balanced composition than in 2006. The increase in net incoming FDI was offset by an increase in net FDI outflows (Table 7.9). From the liabilities side, FDI recorded a bigger surplus in line with the improving investment climate and more rapid economic activities. FDI investment in the oil and gas sector has continued to increase as crude oil prices have soared. This increase also reflects government efforts to raise oil production through direct bidding of a number of oil and gas blocks since 2006. In 2007, new contracts were obtained for 35 upstream projects and 26 oil and gas blocks with total commitment reaching $13.0 billion. It was a similar story for FDI in the non oil and
3 Regulated through Circulation Letters No. 01/BNP2TKI/V/2007 dated May 16, 2007 dan No. 02/BNP2TKI/VI/ 2007 dated June 14, 2007 concerning the increase of minimum wages of Indonesian overseas workers in Singapore and Saudi Arabia, respectively.
gas sector which recorded an increase in 2007. The FDI inflow, either from loan withdrawals from parent company head offices overseas or from increasing capital (equity) rose quite significantly. One source for quite significant increase in FDI was in the form of reinvested earnings. The increase from this source reflects the greater certainty in Indonesia’s business climate as investors continued to expand their businesses. In 2007, the inflow of net FDI in the oil and gas sector recorded increases of 18.3% and 12.4% to $0.9 billion and $4.6 billion respectively. From the asset side, there was an increase in capital outflows by 63.0% to $4.4 billion. This can be viewed as a positive development since Indonesian companies were better able to compete overseas. As such, although overall the net FDI recorded a surplus which was relatively unchanged, based on its composition it showed a positive development.
Various efforts have been made to attract foreign investors to Indonesia. One of them, which is to improve business certainty, has already been carried out through Law No 25 / 2007 concerning foreign investment and Presidential Instruction No. 6/2007 concerning policies to accelerate the development of the real sector and the empowerment of micro, small and medium size businesses. Through adoption of this regulation, the certainty of foreign business in Indonesia is expected to be better guaranteed, for example from the risk of nationalization, the determination of business sectors which are open and closed, along with integrated services from a better structured bureaucracy. Through this presidential instruction all action plans can be implemented, by monitoring implementation of each action plan which had already been proposed in 2006 and 2007. In 2007, foreign investor confidence in Indonesia’s investment climate tended to improve. Various rating agencies raised their sovereign ratings for
Table 7.9
Foreign Direct Investment (FDI)
millions of $
Description 2005 2006 2007
FDI (net) 5,271 2,211 1,164
Abroad (net) -3,065 -2,703 -4,407
In Indonesia (net) 8,336 4,914 5,571
Non-Oil and Gas 7,282 4,122 4,633
Oil and Gas 1,054 793 938
Table 7.10
Portfolio Investment (Liabilities Side)
millions of $
Description 2005 2006 2007
Public Sector, net 4,826 4,514 5,270
Foreign Exchange Bond 2,095 1,930 1,425
Government Securities 2,054 2,209 2,612
SBIs 677 375 1,233
Private Sector, net 444 1,593 4,711
Stocks -165 1,898 3,559
Corporation Securities 609 -305 1,152
Indonesia. In turn, Moody’s, Rating and Investment, and Japan Credit Rating Agency raised their ratings to Ba3, BB+, and BB, respectively.
Portfolio Investment Transactions
The portfolio investment transactions recorded a bigger surplus and showed greater resilience toward the effect of global financial shocks. During 2007, the total surplus of the portfolio investment transactions reached $7.0 billion or higher than in the previous year. From the external side, the increases in portfolio capital inflows were still supported by significant liquidity in the global financial markets. From the domestic side, the increased surplus mainly stemmed from improved confidence in macroeconomic condition and economic prospect. The investment return in rupiah terms was also relatively still more attractive compared to the returns available in other emerging markets. Indonesia’s capital markets showed greater resilience to the impact of global market shocks. Capital outflows, as a result of shocks in global financial markets that were triggered by the sub-prime mortgage crisis in the US, were not too large.
Based on each component, portfolio investment inflows on liabilities side increased compared to the previous year, while on the asset side there was relatively little change. Overall, portfolio investment on the liabilities side recorded a higher surplus of $10.0 billion (Table 7.10). In the public sector, the increased surplus was contributed by rupiah denominated SUN and SBI, while the
contribution from foreign currency denominated SUN declined. In the private sector, the increased surplus was contributed by foreign purchases of stocks and bonds issued by domestic companies.
Table 7.11
Other Investment Transaction
millions of $
Description 2005 2006 2007
Other Investment, net (Public Sector) -848 -2,497 -2,363
Assets 0 0 0
Liabilities -848 -2,497 -2,363
Other Investment, net (Private Sector) -8,601 -1,296 -3,559
Assets -8,646 -1,588 -5,633
Liabilities 45 292 2,075
Total -9,449 -3,793 -5,922
Table 7.12
Indonesia’s Foreign Debt Position
millions of $
Notes 2005 2006
2007
March June September December*
Government 75,406 67,722 69,085 66,155 68,088 69,340
Private 48,601 50,983 51,127 52,073 53,641 53,909
a. Financial Institutions 6,371 6,560 6,992 6,900 6,948 7,465
– Bank 4,042 4,544 4,963 4,935 4,837 5,351
– Non-Bank 2,329 2,017 2,029 1,965 2,111 2,114
b. Non-Financial Institutions 42,229 44,423 44,135 45,173 46,693 46,444
Securities 6,646 10,031 11,071 15,253 15,218 13,391
– Government 4,666 8,087 9,105 13,233 13,147 11,269
– Bank 15 30 47 75 52 50
– Non-Financial Institutions 1,965 1,914 1,919 1,944 2,019 2,073
Total 130,652 128,736 131,283 133,482 136,947 136,640
109
Other Investment Account
Other investment transactions recorded a higher deficit than in the previous year, which is of $5.9 billion, in line with the government’s more independent debt management strategy. In the public sector, other investment transactions recorded a higher deficit of $2.4 billion (Table 7.11). This is a reflection of government policy which tried to reduce the burden of foreign debts by adopting a strategy that withdrawals should be lower than than debt repayments. An interesting development in the management of government debts in 2007 was the scrapping of the CGI forum at the beginning of 2007. As a result, flexibility in the management of government foreign debts could be better conducted on a bilateral basis. These efforts were also accompanied by the effectiveness of disbursement of remaining loan commitments which had not been withdrawn.
The scrapping of the CGI did not immediately bring about a drastic decline in drawdowns of government debts. Although the drawdown of project loans declined, drawdown of program loans increased. Drawdown of government loans in the form of program loans which were obtained in 2007 even rose to $1.9 billion from $1.5 billion in 2006. The same was also the case with the drawdown of project loans which were mostly CGI commitments from the previous year. Although the drawdown of government loans did not in general experience any obstacles, the size of the loans was adjusted in accordance with fiscal repayment requirements and was maintained at a lower level than the payments. The government’s independent debt management strategy was also reflected in the priority of domestic financing.
In the private sector, the other investment transaction recorded a higher deficit to $3.6 billion. One factor causing the increase in the deficit was capital outflows recorded on the asset side in the form of savings owned by residents living overseas. Based on experience, these capital outflows can become a source of supply of foreign currencies if there is a shock which results in increased demand for foreign currencies in the domestic market. This phenomenon is also one factor which can explain the relative stability in the movement of the rupiah exchange rate amidst uncertainty in global financial markets.
External Vulnerability Indicator
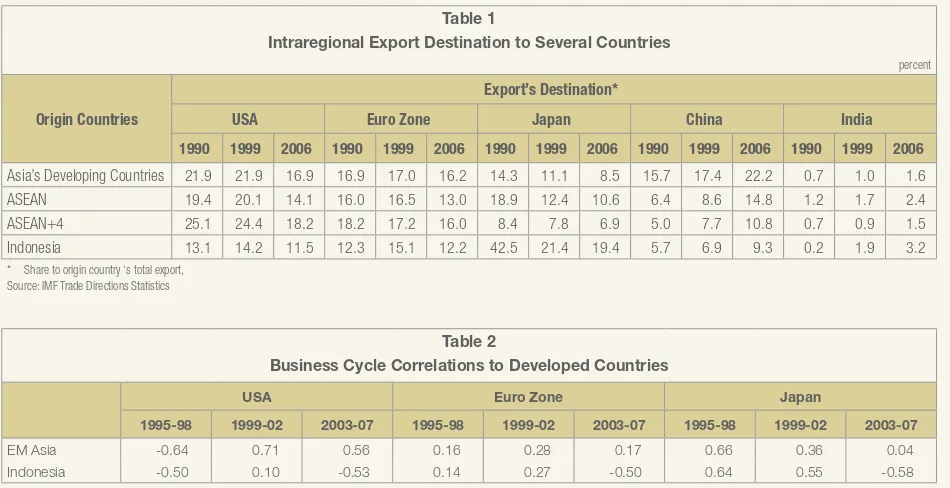
Asia intraregional trade has tended to increase in the last few years. The increase in intraregional trade has thus reduced Asia’s share of trade with developed countries. The share of intraregional trade in ASEAN, ASEAN+4, and developing countries in Asia has continued to increase relative to the total world trade (Chart 1)1. Intraregional trade growth in developing countries in Asia reached 44% in 2006, or increased sharply from 33% in 1990 (Chart 2). As such, the share of trade from developing countries in Asia to the main developed nations or the G3 (the US, the European region, and Japan) declined from 53% in 1990 to around 42% in 2006. Although the role of trade to the G3 developed nations is still quite large, the decline in the trade share to developed nations is a positive development amidst the current economic slowdown taking place in developed countries. This shows greater independence in the trade of developing countries in Asian region. Asia intraregional trade to the US, European region and Japan has continued to decline, while trade with China has increased rapidly (Table 1). With the economies of developed nations slowing, the impact of the slowdown can be partly compensated by increased trade with China and other countries in Asian region.
The increase in intraregional trade has been supported by rapid economic growth in Asian region, especially in China and India. Strong GDP growth and the very large size of the population underpinned the external demand in Asian region. In 2007, the share of Chinese and Indian GDP toward GDP of developing countries in Asia was already more than 50% combined, or amounting to 47.6% and 16.0%, respectively2. Other developments which supported increased intraregional trade were industry relocation policy by developed nations, especially from Japan, to various countries in Asia. This
1 (Asia Developing Nations = Asia-Japan-Middle East countries). (ASEAN = Indonesia, Malaysia, Singapore, Thailand, Vietnam, Philippines, Brunei Darussalam, Cambodia, Myanmar, dan Laos). (ASEAN+4 = ASEAN + Japan+ China + India + South Korea). 2 Using nominal GDP from WEO-IMF Oktober 2007 database.
development was also supported by large foreign direct investment flows to Asia along with various bilateral and multilateral trade cooperation policies in the Asia region which have been quite intensive since the 1990s.
111
Lower intraregional dependency on the G3 wassupported by an intraregional trade structure, which was intra-industry in nature, while trade with developed nations was more inter-industry in nature3. Intra-industry trade in the trade with Asia countries indicates specialization in line with the comparative competitiveness of each country for export purposes. This is in line with the increased business cycle correlation to the countries in Asia, while the business cycle correlation of developing countries in Asia with developed nations tended to decline (Table 2)4. The decline in the dependency of trade with developed nations was also reflected in the decline in the business cycle correlation between Indonesia with those three developed regions. The correlation was even negative (in the period 2003-2007), as Indonesia’s economic growth tended to accelerate amidst the economic slowdown taking place in developed nations.
From the aspect of traded commodities, intraregional trade in Asia is dominated by raw materials or intermediate goods. In general, the export share from developing countries in Asia, including Indonesia, is mainly in the form of raw materials (Table 3)5. The tendency of raw materials to dominate the share of
3 Intra industry trades tend to increase business cycle correlations among countries, while inter industry trades tend to decrease business cycle fluctuation. See Harm Zebregs, Intraregional Trade in Emerging Asia, IMF Policy Discussion Paper, PDP/04/1, April 2004. 4 The computation of business cycle correlations is based on Phase
Average Trend model developed by OECD.
5 The commodity classification is based on Broad Economic Indicators (BEC), United Nations Statistic Division, April 9, 2007.
exports occurred in both intraregional trade and trade with the G3 developed regions. These exports of raw materials are mainly primary products which have to be processed further. This exports structure, unfortunately, has a relatively low added-value in real sector activities, for example, in the absorption of workers. For
Indonesia, the structure of exports to the US is already relatively good, dominated by consumption goods (55%), especially textile and textile-related products. Nonetheless, Indonesian exports to other countries are still dominated by raw material commodities (primary products). Exports dominated by primary commodity also took place to main export destination countries such as Japan (mining goods, unprocessed rubber), China (CPO and unprocessed rubber), and India (CPO and mining goods).
For the domestic economy, the not so well-balanced structure of exports implies the need to make improvements on the supply side and to enhance the competitiveness of exports to benefit from the high growth momentum in developing countries and the need for an industrial strategy directed toward exports of finished goods such that the added-value is greater.
Table 1
Intraregional Export Destination to Several Countries
percent
Origin Countries
Export’s Destination*
USA Euro Zone Japan China India
1990 1999 2006 1990 1999 2006 1990 1999 2006 1990 1999 2006 1990 1999 2006
Asia’s Developing Countries 21.9 21.9 16.9 16.9 17.0 16.2 14.3 11.1 8.5 15.7 17.4 22.2 0.7 1.0 1.6
ASEAN 19.4 20.1 14.1 16.0 16.5 13.0 18.9 12.4 10.6 6.4 8.6 14.8 1.2 1.7 2.4
ASEAN+4 25.1 24.4 18.2 18.2 17.2 16.0 8.4 7.8 6.9 5.0 7.7 10.8 0.7 0.9 1.5
Indonesia 13.1 14.2 11.5 12.3 15.1 12.2 42.5 21.4 19.4 5.7 6.9 9.3 0.2 1.9 3.2
* Share to origin country ‘s total export, Source: IMF Trade Directions Statistics
Table 2
Business Cycle Correlations to Developed Countries
USA Euro Zone Japan
1995-98 1999-02 2003-07 1995-98 1999-02 2003-07 1995-98 1999-02 2003-07
EM Asia -0.64 0.71 0.56 0.16 0.28 0.17 0.66 0.36 0.04
Table 3
Intraregional’s & Indonesia’s Exports Commodities to Several Zones
percent
Origin Countries
Country of Export’s Destination*
USA Euro Zone Japan China India
1995 1999 2006 1995 1999 2006 1995 1999 2006 1995 1999 2006 1995 1999 2006
Asia’s Developing Countries
Capital Goods 20.1 20.0 26.0 17.5 20.6 27.0 10.2 12.5 16.6 12.5 11.8 19.0 14.9 11.1 22.0
Raw Materials 34.8 35.3 34.0 39.4 39.9 39.3 49.3 46.5 53.2 66.5 66.1 67.4 75.8 73.7 68.4
Consumer Goods 43.6 42.0 36.6 40.2 36.3 29.6 39.9 37.5 25.6 20.2 18.4 9.6 6.3 8.2 5.1
Indonesia
Capital Goods 12.1 6.0 4.9 3.8 4.4 7.8 1.0 1.6 2.5 2.4 1.6 4.9 1.1 0.8 2.8
Raw Materials 42.5 39.5 39.4 55.9 50.2 59.1 81.3 81.7 84.7 84.6 83.2 87.8 89.7 81.4 91.8
Consumer Goods 45.3 51.3 55.4 40.3 40.6 33.1 17.0 13.2 6.8 12.5 13.1 5.0 5.7 6.3 3.9
Chapter 8
Chapter 8: Government Finances
Implementation of fiscal policies in 2007 faced some fairly serious challenges. The high price of
crude oil on international markets, which was accompanied by a decline in domestic oil lifting
put fairly significant pressures on efforts to keep the fiscal deficit within a safe level. Nonetheless,
various government policy measures which included the extensification and intensification of
government revenues, the policy to cut down and increase efficiency of Ministry/Institutional
spending were able to safeguard fiscal sustainability. This was reflected in the decline of
government debts to GDP ratio and the preservation of the primary balance surplus.
Fiscal policy in 2007 was, in general, aimed at increasing the fiscal stimulus by continuing to ensure fiscal sustainability. With this expansionary direction, the APBN-P 2007 deficit was fixed at 1.5% of GDP, or higher than the 2006 realized deficit of 0.9% of GDP. Fiscal expansion was expected to increase the fiscal contribution to the real sector, either through government consumption or investment. Besides the direct contribution, the government also gave a number of tax incentives to increase activity in the real sector without sidelining efforts to increase government revenues. Meanwhile, to reduce the level of poverty the government still carried out various programs to help the people. The increase in the deficit has not harmed the prospects for fiscal sustainability, as reflected in estimates of a fall in the outstanding Government debt ratio and the continuing primary balance surplus.
Implementation of the 2007 APBN faced a number of challenges which originated from both external environment and internal problems. On the external side, the budget was implemented at a time of continued increases in the price of crude oil since the second quarter of 2007. Overall, the yearly price of crude oil reached around $72.3/barrel1 on average, or above
the assumption in the 2007 APBN-P of $60/barrel. Accompanied by various parameters in the calculation of energy subsidies, which exceeded the initial estimates at the beginning of the year, the increases in the price of crude oil significantly pushed up the amount of subsidies, thereby potentially increasing the budget deficit toward
1 Average ICP January-December 2007 used to calculate fuel and electricity subsidies.
2% of GDP. Entering the third quarter of 2007, the subprime mortgage crisis in the United States triggered a decline in the price of Government debts which could affect the financing of the budget deficit. From the domestic side, national finances were impacted by the domestic oil lifting which continued to decline. Overall, yearly oil lifting reached on average 899,000 barrels per day, or below the 2007 APBN-P assumption of 950,000 barrels per day. This condition led to lower revenues from the oil and gas sector. Other internal challenges concerned the absorption of Government Expenditure which lagged behind in the first half of 2007 although efforts have already been made in regard to regulations connected to the procurement of government goods and services. This lag in the absorption of Government Expenditure was caused by increased caution and efficiency in the carrying out of procurement auctions for government goods and services.
115
surpassed. From the aspect of expenditures, increased efficiency in Ministry/Institutional spending allowed the government to pay energy subsidies in the framework of safeguarding price stability. With these steps, the deficit is still expected to remain in line with the target set in the 2007 APBN-P, that is 1.5% of GDP. From the aspect of financing, the front loading strategy in issuing Government Debts (SBN) meant that the financing target deficit could be met before financial sector conditions experienced volatility due to the sub-prime mortgage crisis in the United States.
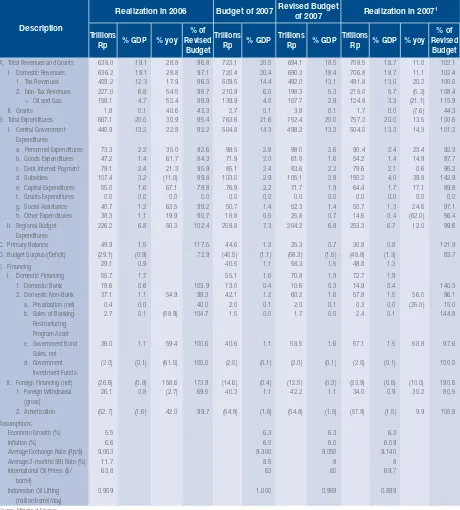
The realization of a lower-than-targeted budget deficit was mainly attributable to the absorption of Ministry/ Institutional spending (K/L spending) which was below the target set in the 2007 APBN-P. Steps taken to improve efficiency, which were accompanied by greater caution in the procurement of government goods and services, meant that the government was still able to provide fuel subsidies despite large increases in the price of crude oil. Nonetheless, as a consequence, the realization of the Government Spending was lower than the realization of the State Income such that realization of the deficit lagged behind. From March until November 2007, government financial operations continued to accumulate a budget surplus. At the end of the year, the deficit only reached 1.3% of GDP2, or below the
2007 APBN-P target of 1.5% of GDP. This deficit was supported by the prospect of fiscal sustainability. The ratio of government debt declined from 39% of GDP in 2006 to 35% of GDP in 2007. Meanwhile, the
2 Or 1.2% of GDP by using realized 2007 GDP of Rp3.957 trillion.
primary balance still recorded a surplus of 0.8% of GDP (Chart 8.1 and Chart 8.2).
Government Revenues and Grants
The performance of Government Revenues and Grants in 2007 was marked by good performance in tax collection, but was overshadowed by weak performance in the oil and gas sector due to further declines in oil lifting. As estimated in the 2007 APBN-P, the performance of Government Revenues and Grants in 2007 recorded lower growth than in 2006 when the growth reached 29%. This slowdown in growth was mainly due to the decline in revenues from the oil and gas sector. Meanwhile, the performance of the tax sector was quite reasonable. The tax revenue increased by 20% in line with the 2007 APBN-P. This figure is higher than the growth in 2006 of 18%. With this development, Government Revenues and Grants reached around 19% of GDP, relatively unchanged from the level in 2006 (Chart 8.3). Around 69% of Government Revenues and Grants stemmed from tax revenues with a tax ratio of 13% of GDP, while the rest stemmed from non tax revenues (PNBP) amounting to 6% of GDP (Chart 8.4).
The less than optimal performance of the oil and gas sector is reflected in lower oil and gas revenues at a time when crude oil price continued to increase and reached a level of $69.7/barrel3. This condition can be
partly explained by the lower domestic oil lifting which has continued to decline to 899,000 barrels/day. From
Table 8.1
Summary of Government Finance Operation
Description
Realization in 2006 Budget of 2007 Revised Budget
of 2007 Realization in 2007
1
Trillions
Rp % GDP % yoy
% of Revised
Budget Trillions
Rp % GDP
Trillions
Rp % GDP
Trillions
Rp % GDP % yoy % of Revised
Budget
A. Total Revenues and Grants 638.0 19.1 28.8 96.8 723.1 20.5 694.1 18.5 708.5 18.7 11.0 102.1
I. Domestic Revenues 636.2 19.1 28.8 97.1 720.4 20.4 690.3 18.4 706.8 18.7 11.1 102.4
1. Tax Revenues 409.2 12.3 17.9 96.3 509.5 14.4 492.0 13.1 491.8 13.0 20.2 100.0
2. Non-Tax Revenues 227.0 6.8 54.5 98.7 210.9 6.0 198.3 5.3 215.0 5.7 (5.3) 108.4
– Oil and Gas 158.1 4.7 52.4 98.9 139.9 4.0 107.7 2.9 124.8 3.3 (21.1) 115.9
II. Grants 1.8 0.1 40.6 43.3 2.7 0.1 3.8 0.1 1.7 0.0 (7.6) 44.3
B. Total Expenditures 667.1 20.0 30.9 95.4 763.6 21.6 752.4 20.0 757.2 20.0 13.5 100.6
I. Central Government Expenditures
440.9 13.2 22.8 92.2 504.8 14.3 498.2 13.2 504.0 13.3 14.3 101.2
a. Personnel Expenditures 73.3 2.2 35.0 92.6 98.5 2.8 98.0 2.6 90.4 2.4 23.4 92.3
b. Goods Expenditures 47.2 1.4 61.7 84.3 71.9 2.0 61.8 1.6 54.2 1.4 14.9 87.7
c. Debt Interest Payment 79.1 2.4 21.3 95.9 85.1 2.4 83.6 2.2 79.6 2.1 0.6 95.2
d. Subsidies 107.4 3.2 (11.0) 99.8 103.0 2.9 105.1 2.8 150.2 4.0 39.8 142.9
e. Capital Expenditures 55.0 1.6 67.1 78.8 76.9 2.2 71.7 1.9 64.4 1.7 17.1 89.8
f. Grants Expenditures 0.0 0.0 0.0 0.0 0.0 0.0 0.0 0.0 0.0 0.0 0.0 0.0
g. Social Assistance 40.7 1.2 63.5 99.2 50.7 1.4 52.3 1.4 50.7 1.3 24.6 97.1
h. Other Expenditures 38.3 1.1 19.9 90.7 18.8 0.5 25.8 0.7 14.6 0.4 (62.0) 56.4
II. Regional Budget Expenditures
226.2 6.8 50.3 102.4 258.8 7.3 254.2 6.8 253.3 6.7 12.0 99.6
C. Primary Balance 49.9 1.5 117.5 44.6 1.3 25.3 0.7 30.8 0.8 121.9
D. Budget Surplus/(Deficit) (29.1) (0.9) 72.9 (40.5) (1.1) (58.3) (1.5) (48.8) (1.3) 83.7
E. Financing 29.1 0.9 40.5 1.1 58.3 1.5 48.8 1.3
I. Domestic Financing 55.7 1.7 55.1 1.6 70.8 1.9 72.7 1.9
1. Domestic Bank 18.6 0.6 103.9 13.0 0.4 10.6 0.3 14.9 0.4 140.3
2. Domestic Non-Bank 37.1 1.1 54.9 99.3 42.1 1.2 60.2 1.6 57.8 1.5 56.0 96.1
a. Privatization (net) 0.4 0.0 40.0 2.0 0.1 2.0 0.1 0.3 0.0 (25.0) 15.0
b. Sales of Banking Restructuring Program Asset
2.7 0.1 (58.9) 104.7 1.5 0.0 1.7 0.0 2.4 0.1 144.8
c. Government Bond Sales, net
36.0 1.1 59.4 100.6 40.6 1.1 58.5 1.6 57.1 1.5 58.8 97.6
d. Government Investment Funds
(2.0) (0.1) (61.5) 100.0 (2.0) (0.1) (2.0) (0.1) (2.0) (0.1) 100.0
II. Foreign Financing (net) (26.6) (0.8) 158.6 173.9 (14.6) (0.4) (12.5) (0.3) (23.9) (0.6) (10.0) 190.6 1. Foreign Withdrawal
(gross)
26.1 0.8 (2.7) 69.5 40.3 1.1 42.2 1.1 34.0 0.9 30.2 80.5
2. Amortization (52.7) (1.6) 42.0 99.7 (54.8) (1.6) (54.8) (1.5) (57.9) (1.5) 9.9 105.8
Assumptions:
Economic Growth (%) 5.5 6.3 6.3 6.3
Inflation (%) 6.6 6.5 6.0 6.59
Average Exchange Rate (Rp/$) 9.063 9.300 9.050 9.140
Average 3-months SBI Rate (%) 11.7 8.5 8 8
International Oil Prices ($/ barrel)
63.8 63 60 69.7
Indonesian Oil Lifting (million barrel/day)
0.959 1.000 0.959 0.899
Source: Ministry of Finance 1 Provisional Figures, January 2008
the point of view of the 2007 APBN-P target, the tax income target was able to be achieved due to the fact that all components of tax revenue exceeded its target. Meanwhile, realization of non tax revenue (PNBP) also surpassed its target. This is still mostly contributed by oil and gas income, albeit lower than last year’s, due to the fact that higher increase of oil prices outweighed the decline in oil lifting. With this development, the realization
of Government Revenues and Grants exceeded the target in the 2007 APBN-P (Table 8.1).
117
toward tax subjects and objects, improvement of the tax system and administration, increased monitoring efforts and increased excise tax tariffs, combined with the better macro economic conditions, resulted in better performance in tax collection. This better performance was reflected in both the increase of the tax ratio which reached 13% of GDP, up from 12.3% of GDP in 2006 as well as the increase in the number of tax objects from around 20.8 million in 2006 to around 23.1 million in 20074. The increase in tax revenues occurred in all
components of tax revenues with the largest increase stemming from Export Tax revenues. The increase in Export Tax revenues was mainly due to higher exports of CPO, mineral fuels and mining products along with rubber and rubber made goods, which were driven by higher oil prices. In terms of Domestic Taxes, the main increase occurred in Value Added Taxes (VAT), and other taxes and excise taxes in line with private consumption growth which has continued to rise since the first quarter of 2007.
The increase in tax revenues was also influenced by policy factors. Especially concerning excise taxes, the increase in excise tax revenues was supported by both higher production volumes of products such as cigarettes and alcoholic drinks and the impact of increases in the retail selling prices (HJE) for all types of cigarette by 7% per stick/gram effective March 1, 2007 and the imposition of specific taxes of Rp3-7/stick according to the industry group effective as of July 1,
4 Including tax payer (WP) who doesn’t have a NPWP.
20075. Efforts to prevent the sale of cigarettes without
banderole or with fake banderole also helped to boost excise tax revenues. From all components of income tax revenues, only the realization of non oil and gas income tax (PPh) failed to reach its target. This was due, among other things, to a decline in the amount of PPh Section 25 (PPh for firms) year 2007 due to the low realization of profits in a number of large companies and a number of potential tax payers in 2006, as well as because of natural disasters in 2006-2007 which affected activities in the real sector for a time.
Implementation of tax polices also included providing a limited fiscal stimulus and continuing a program to harmonize tariffs. Various tax facilities were given in 2007 which were aimed at raising production activities and investment. In the field of income tax, facilities given include a reduction in net income by 30% from the specified amount of investment, speeding up depreciation and amortization, lowering the Income Tax rate on dividends which are paid to Overseas Tax Subjects, lengthening of the period for loss compensation6; the granting of exception facilities
for agriculture goods7; along with the granting of
PPN facilities on contributions and donations in the
5 Finance Minister regulation No. 118/PMK.04/2006 concerning the two changes above PMK No. 43/PMK.04/2005 on Setting the Base Price and Excise Tax Tariffs for Cigarette Products.
6 Government Regulation No. 1 Year 2007 Concerning Income Tax Facilities for Investment in Certain Areas and/ or Certain Regions. 7 Government Regulation No. 7 Year 2007 Concerning the Third
framework of the rehabilitation and reconstruction of Nanggroe Aceh Darussalam (NAD) and Nias8. In the field
of international tax, the Program to Harmonize Import Duties is still carried out. This program was aimed at raising the efficiency and competitiveness of domestic industry, providing business certainty to investors, anticipating economic globalization, increasing customs administration efficiency and preventing smuggling.
In terms of non-tax revenues, the continued decline in domestic oil lifting was the main factor in the decline of the non tax revenue realization (PNBP). As assumed in the 2007 APBN-P, the performance of PNBP experienced a decline compared to 2006, mainly due to the fall in receipts from oil and gas. The decline in oil and gas PNBP was due to domestic oil lifting which only reached 899,000 barrels/day, or lower than the assumption of 950,000 barrels/day, while the price of crude oil actually rose to $69.7/barrel, or above the assumption of $60/barrel. This decline in domestic oil lifting was related to high natural declining rate of oil wells in Indonesia now reaching around 5%-11% per year due to its mature age, while new wells like Cepu and Lapangan Jeruk are not yet producing.
The decline in the realization of PNBP was also caused by lower profits contributed by SOE and other PNBP. This was because the carried over SOE dividends and the excess Surplus of Bank Indonesia were not included in the calculation of SOE 2007 profit as was the case in 2006. Receipts from excess surplus of Bank Indonesia were put in a separate component in the 2007 APBN-P and were realized in line with the target, that is around Rp13 trillion. Nonetheless, SOE contributed profits exceeded the target in the 2007 APBN-P because of an increase in the dividends contribution in relation to higher crude oil prices. Meanwhile, the lower increase in other PNBP, among other things, was because receipts from the auction for rights to use certain radio frequencies to support third generation based cellular telecommunication services were not included in the calculation as they were in 2006.
Government Expenditure
The implementation of Government Expenditure in 2007 was marked by price stabilization policy, greater fiscal stimulus and continuation of poverty alleviation programs.
8 Finance Minister Regulation No. 43/PMK.03/2007 concerning the imposition of PPN and PPnBM on the Carrying out of Government Projects for the Rehabilitation and Reconstruction of Districts and the People’s Lives in the Province of Nanggroe Aceh Darussalam and the Nias Province of North Sumatra Post the earthquake and Tsunami Natural Disasters which were Funded by Overseas Grants.
Policy to safeguard price stability was carried out through the commitment to providing various types of subsidy. The policy to increase the stimulus was carried out through raising State Apparatus Income; improving the quality, efficiency and effectiveness of services and governance through raising the budget for Expenditure on Goods; increasing the budget for infrastructure in Capital Expenditure; along with increasing the education budget. To reduce the level of poverty, programs in the fields of education and health - especially for poor people - were maintained. With this policy direction, Government Expenditure in 2007 reached around 20% of GDP, or the same as in 2006, with the bulk (33%) used for Regional Spending which was followed by expenditures for Subsidies and Debt Interest (31%), around 27% for fiscal stimulus from the Central Government (Spending on Salaries, Spending on Goods and Capital Spending) and the remainder (9%), among other things, for poverty alleviation programs through the Social Aid budget. From all these components of Government Expenditure, only the components on Spending on Employees, Subsidies and Regional Spending experienced an increased share of GDP compared to 2006 (Chart 8.5). Meanwhile, the share of Capital Expenditure and Expenditure on Goods was still minimal and stable as it was in 2006, that is only around 1%-2% of GDP.
119
been carried out9. This condition was related to the
increased caution in carrying out Government auctions for the procurement of goods and services as well as steps to economize Ministry/Institutional spending (K/L) in anticipation of increased needs for payments of energy subsidies. At the regional level, the realization of Expenditures for the Regions was relatively in line with the target although overshadowed by payments for Special Allocation Funds (DAK) and Special Autonomy Funds and Adjustments (DOKP) that were below target.
In general, the increases in Central Government Expenditures were influenced by policy factors. Central Government Expenditures rose around 14% with the increase occurring in all expenditure components, except Other Expenditures. With regard to the civil service, the main policies included adjustments to the basic salary of state workers by around 15%, payment of the thirteen-month salary10 and adjustment of structural allowance
along with functional allowance. In the area of education, the education budget rose from the realized Rp29.3
9 A number of important points in Presidential Decree No. 8 Year 2006 and Presidential Decree No. 79 Year 2006 stated ministries and state institutions along with Regional Governments and leaders of SOE and BUMD can conduct the procurement process of goods/services before the budget document is approved for related activities which have already been allocated, with the stipulation they issue an appointment letter to supply goods/services (SPPBJ) and a signed contract for the goods/services is done after the budget document for activities/projects is approved. Beside that, the PP also regulates when certification is not required for officials making a commitment as well as allowing for direct appointment for auctions of projects up to Rp50 million.
10 Regulation of the Director General of the Treasury No.33/PB/2007 dated 13 June 2007 concerning 13 month Salaries/pensions/ allowances in the 2007 budget to Civil Servants, State Officials and Receivers of Pensions/Allowances.
trillion in 2005 to Rp45.3 trillion in 2006, and is expected to increase to Rp51.3 trillion in the 2007 APBN-P. This increase was related to Government efforts to fulfill the constitutional mandate to allocate at least 20% of the APBN for the education budget11. The increase in
Expenditure on Goods was used to assist developments in activities requiring support for operational cost and maintenance (around half of the Expenditure on Goods budget), to handle post-flooding expenditures, and to procure the bird flu vaccine. In the area of investment, the infrastructure budget rose from around Rp32.2 trillion in 2006 to around Rp43.8 trillion in 200712 which, among
other things, was used to speed up development of east flood canal and west flood canal to tackle floods in the Jabodetabek area, to construct Kuala Namu Airport in Medan, and Hasanudin Airport in Makassar.
In regard to subsidies, both energy subsidies and various other subsidies experienced an increase. Food subsidies rose from Rp10.8 million in 2006 to Rp15.8 million in 2007 due to an increase in the number of targeted poor households (RTM) receiving subsidies. Fertilizer subsidies rose in connection to increases in the maximum
retail price (HET) of fertilizer as of January 2007. This increase was due to the national program to boost rice production by two million tons which needs an additional 800 thousand tons of subsidized fertilizer. Meanwhile, subsidies on interest for program loans rose in order to support the increase of the volume of subsidized house construction, a program to subsidize bio-fuels energy
11 Source: Financial Notes for the 2008 APBN.
and a program to revitalize plantations. To guarantee the continuation of the aid program to the people which has been in effect for a few years, the Government increased the Social Aid budget. This budget increase was used for a program to support school operations (BOS), scholarships for gifted pupils (BKM) in the field of education, free health services in Puskesmas and government hospitals and appointed third-class private hospitals, and on direct aid projects in the field of health and education. Meanwhile, the realization of Other Expenditure was lower than in 2006, mainly because of the discontinuation of Direct Cash Aid program. Other Expenditure budget included funds for policy measures, national movement to rehabilitate the forests, activities which had not yet been budgeted, and also rehabilitation and reconstruction of Yogyakarta and Central Java.
Policies to maintain subsidies amidst external shocks meant that the realization of Central Government Expenditures exceeded the target. Absorption and increases in Central Government Expenditures – which were above the target – were mainly because of Subsidy payments, especially fuel (BBM) Subsidies and Electricity Subsidies. This increase in fuel subsidies was driven by greater disparities between the price of fuel fixed by the Government with its economic price along with the realization of subsidized fuel consumption which exceeded the quota, that is from 36 million kilo liters to around 38 million kilo liters (Chart 8.7). The increase in subsidized fuel consumption was also related to the slow progress made in the program to get people to switch from kerosene to LPG (realization was only around 20,638 kilo liters or 6% of the target.
Meanwhile, the increase in electricity subsidies was also influenced by the increasing disparity between Basic Electricity Tariffs as set by the Government and production costs which have continued to increase. This increase in electricity production costs was caused by rising fuel prices, the increase in the portion of fuel used in producing electricity and the increase in the price of fuel set by Pertamina (as a result of an increase in profit margin from 6.5% to 9.5%), along with an increase in electricity sales to the public compared to what was originally planned. The commitment to maintain subsidies demonstrates the role of the Government in safeguarding economic stability13.
At the regional level, transfers of Expenditure for the Regions increased in line with increased Government revenue and infrastructure needs. In general, the expenditure policy for the regions was directed to lessen the fiscal inequities between the central government and regional governments and between the regions, to lessen the inequities in public services between regions, to support fiscal sustainability in macro economic policy, to increase regional capacity in harnessing the potential of regional income, to increase efficiency in national resources, and to increase the transparency and accountability of the allocation of Expenditure for the Regions. Realization of regional Expenditure in 2007 was relatively stable compared to 2006, that is around 6.7%-6.8% of GDP. All components of the Regional Spending Budget rose except for Profit Sharing Funds (DBH). This reflects the decline in oil and gas
121
receipts which was due to lower domestic oil lifting. The increase in the General Allocation Fund (DAU) reflects the increase in net government revenue. The increase in Special Allocation Fund (DAK) reflects the increasing transfers of deconcentration funds, aids and the policy to place shortage of DAK payment in 2005 to this years’ DAK. Furthermore, the increase in Autonomous Fund and Adjustment (DOKP) was due to the allocation of adjustment funds for infrastructure. 30% of the DAK allocation was used in the fields of education, while another 30% was used in infrastructure; around 20% was used for health and the remainder was used for government infrastructure, maritime and fisheries, agriculture and environment. The realization of DAK and DOKP that were below target was due to, among other things, the delay in setting the APBD. This, in turn, resulted in delays in undertaking activities and absorbing funds.
Deficit Financing
Financing of the 2007 APBN deficit was relatively in accordance with the target, especially the financing sourced domestically. Three strategic steps for the financing included increasing the use of domestic source of financing, reducing outstanding debts and reducing ratio of debts toward GDP in a progressive manner, also fulfilling debt repayment obligations on time. Implementation of these three strategies were carried out smoothly such that the target for deficit financing sources originated domestically could be attained and that debt repayment was done on time. Up to the end of December 2007, the amount of rupiah and foreign currency SBN already issued had reached Rp99.8 trillion14. After taking into account the government bond
(SUN) maturity, the SUN buyback and the repayment of a portion of Government debts owed to Bank Indonesia (SRBI-01) (around Rp13.7 trillion), the net issuance of SBN reached Rp57.1 trillion, which was slightly below the 2007 APBN-P target of Rp58.5 trillion. From the point of view of assets sales, realization of the privatization program up to December was below target, whereas the banking asset sales from PT Perusahaan Pengelola Aset (PT PPA) was in line with the target. In 2007, the Government obtained funds from the SOE privatization program of around Rp3 trillion, slightly below the 2007 APBN-P target of Rp3.3 trillion. In December there were also payments for a number of SOE through PMN program of around Rp2.7 trillion, which exceeded the target of Rp1.3 trillion. As such, the net privatization proceeds obtained were around Rp0.3 trillion, or below the target of Rp2 trillion. Meanwhile, from the bank
14 Source: Bank Indonesia.
restructuring program, the State Asset Management Company (PPA) contributed around Rp2.4 trillion, exceeding the 2007 APBN-P target of Rp1.7 trillion. In regard to external sources, the withdrawals of foreign loans only reached around 81% of the APBN-P target because the policy matrix was not met.
The main source of foreign loans still originated from the World Bank and ADB. These loans were used to fund various development programs in nearly all economic sectors. Meanwhile, repayments on principal were carried out on time which actually resulted in net withdrawals of foreign loans that were below target. With net issuances of SBN exceeding the target, and the deficit being lower than the target, the position of the government account in Bank Indonesia experienced a slight increase. This was contrary to what was expected in the 2007 APBN-P where the Government account in Bank Indonesia had been initially expected to show a decline since it was used to repay the deficit. Similar to the two previous years, financing policy was marked by government expenditures to fund infrastructure through Public Private Partnerships (PPP) that amounts to around Rp2 trillion.
ORI SPN
Foreign Exchange
Bond
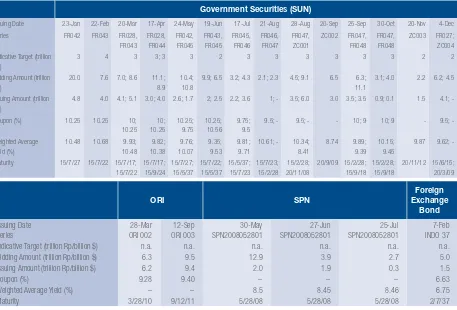
Issuing Date 28-Mar 12-Sep 30-May 27-Jun 25-Jul 7-Feb
Series ORI 002 ORI 003 SPN2008052801 SPN2008052801 SPN2008052801 INDO 37
Indicative Target (trillion Rp/billion $) n.a. n.a. n.a. n.a. n.a. n.a.
Bidding Amount (trillion Rp/billion $) 6.3 9.5 12.9 3.9 2.7 5.0
Issuing Amount (trillion Rp/billion $) 6.2 9.4 2.0 1.9 0.3 1.5
Coupon (%) 9.28 9.40 – – – 6.63
Weighted Average Yield (%) – – 8.5 8.45 8.46 6.75
Maturity 3/28/10 9/12/11 5/28/08 5/28/08 5/28/08 2/7/37
around Rp16 trillion of SUN which will mature in 2007-2012 to 2018-2025. This program gives room for the government to issue government securities (SBN) in shorter tenors in order to develop the SBN market and increase the confidence of investors and other market players toward the Government’s ability in managing its debt portfolio.
The success in meeting the financing target through issuance of SBN was supported by conducive macro economic conditions. As in 2006, the Government again faced a condition of oversubscription in nearly all of the SBN auctions in 2007. This condition reflects the confidence of market players in government macroeconomic policies and the prospects for fiscal
Table 8.2
Summary of Government Bonds Issued in Year 2007
Government Securities