AN ANALYZED MODEL OF CONSUMER PERCEIVED
VALUE IN SELECTING RETAIL SHOP FOR FRESH
PRODUCT
Mochammad Mukti Ali
1, Ujang Sumarwan
2,
Setiadi Djohar
3,
Eva Z. Yusuf
4Graduate School of Management and Business, Bogor Agricultural University, Indonesia1, Department of Family and Consumer Science, Graduate School of Management and Business, Bogor Agricultural University, Indonesia2, PPM School of Management, Indonesia3, Graduate
School of Management and Business, Bogor Agricultural University, Indonesia4
[email protected], [email protected], [email protected], [email protected]
Abstract
The purpose of this study was to analyze the factors that influence consumer perception of value in choosing where to shop for fresh product. The data obtained by the survey respondents using a questionnaire method 610 respondents in 20 retails shops. The selection of the consumer as a sample is using systematic random sampling technique with an interval of five. Analysis of structural equation model (SEM) is used to see the effect and the relationship between variables and indicators. The result illustrate that consumers in choosing where to shop for fresh product are influenced by consumer perceptions of the chosen shopping places. The result of this study can serve as an input for all that are associated with market management policies in an attempt to fix the market management to improve services to meet the desires and expectations of consumers in shopping behavior.
Keywords: Consumer behavior, Consumer Perceived Value, Systematic Random Sampling,
Structural Equation Model
INTRODUCTION
Background
Research of consumer behavior which related to shopping decision model and selecting a place to shop that is influenced by the mix of marketing and perception has been abundantly conducted. Leszczyc (2000), Raharjani (2005), Riorini (2005), Patmono (2007), Santoso (2007), Maemuya (2008), Rinaldi (2009), Sarkar (2011) using the marketing mix factors such as price, place, product and promotion in their researches and the results showed that the marketing mix affects consumers in making purchase decisions and shopping. Grewal et al. (1998), Kahn and Wansink (2004), Naiyi (2004), Berkah (2008),
Liljander et al. (2009), Gocek and Beceren (2012), Rzem and Debabi (2012) using the factors of consumer perceptions and the results showed that the consumer perception influenced shopping decision. Another group of researchers use consumer perceptions partially as a factor that influences consumer decision in selecting place to shop. Broniarczyk et al. (1998), Hoch et al. (1999), Gilmore et al. (2001), Tang et al. (2001) mentioned that the general results indicate that consumer perceptions affecting consumer decision in selecting place to shop.
12
2010). Consumer behavior in decision-making can be learned and it is important for managers of retail businesses (retailers) in establishing the appropriate and effective company's business strategy in attracting more consumers to come and shop at the same time. The purpose of this study was to analyze the factors that influence consumer perception of value in selecting retail shop for fresh product.
LITERATURE REVIEW
Consumer Behavior
Retail marketing strategy that is oriented to the consumer will always study and examine consumer behavior. Retail marketing success is determined by the ability of the company to explore the perception of consumers. Consumer behavior is a decision that requires the individual activity to evaluate, acquire, use or set of goods and services (Lounden and Bitta, 1988). Consumer behavior is the study of how the decision-makers (decision units), whether individual, group, or organizations are making purchase decisions or making products purchase transaction and consume them. Consumer behavior is not only the action or behavior when purchasing products (consuming process), but also about the behavior before buying product (purchasing process) and the behavior after purchasing product (post-purchase process).
Consumer Decision Model
Consumer decision consists of three stages; the first is input which is the external influence as information sources about products and affecting the value associated with the products, attitudes, and consumer behavior. The main input is the marketing mix activities and socio-cultural influences. The second is the process, how a consumer is making a decision. Psychological area is an internal influence that affects consumer decisions, including: motivation, perception, learning, personality, and attitudes of consumers. According to Schiffman and Kanuk (2000), decision consists of three stages: introduction to needs, pre-purchasing search and evaluation of alternatives. Consumers are aware of the need when faced with a problem. Many consumer decisions are based on a combination of past experience (internal
source) with marketing information (external source). The third stage is the output, which shows the two kinds of post- decision activities are interconnected, ie : purchasing behavior and post-purchase evaluation.
Consumer Perceptions and Decision in Selecting Place to Shop
Consumer decision to visit one of the retail stores of a particular network of retail stores and make purchases is a series of processes. The consumer decision process does not take place only at a certain time, but it is an activity that is carried out in several stages. This decision process usually begins with a needs analysis, followed by information search, alternative evaluation and decision-making. Consumers’ perceptions towards retail stores can influence their shopping intentions. A good consumer perception towards the retail store will generate the power of returning back to shop at the same retail stores in the next shopping period. Consumer perceptions of retail store will affect the decisions of shopping location (Siringoringo and Sugiarto, 2009). There is a significantly positive relationship between consumer’s perceptions towards shopping decisions. This consumer perception is the assessment of the store, including building design, layout, variety of available goods, consumer involvement, price factor, and desire to stay longer, and desire to be a fixed consumer (Berkah, 2008). Consumer perceptions affect shopping location decision through the preferences (Howell and Rogers, 1981).
Perceived Quality
Perception of quality can be conceptualized in two different contexts, namely product quality and service quality. The product quality is composed of seven dimensions: features, conformance with specifications, reliability, durability, serviceability, and fit and finish, whereas the dimensions of service quality are tangibles, reliability, competence, responsiveness, and empathy (Aaker, 1991).
intrinsic marketing cues associated with product. But in the real conditions, consumers often cannot use intrinsic cues in making decisions. Therefore, consumers evaluate the quality based on extrinsic cues from the outside of the product, such as price, developed a model of retail store image measurement scale which consists of three dimensions, namely: (1) general store attribute dimensions, (2) performance-related dimensions, and (3) person and service sales dimensions. The third dimension of retail store image is then developed into 10-items indicator of retail store image.
In research conducted by Amirani and Gates (1993), the store image is defined as the most important factor of the company success. Store image depends on the buying process and greatly influenced by the consumer experience. Physical ambient conditions, such as the store atmosphere, orderliness, and arrangement in the stores are known to influence consumer behavior. Generally, researchers agree that the physical and social environments which support services are the most important component of a retail store image. In addition, the physical and social environments have been known to affect taste and consumer emotions (Gocek and Beceren, 2012).
Perceived Shopping Utility
Perception of consumer shopping utility model that affects consumer decisions in the selection of stores affected by two components, namely by fixed utilities (benefits and fixed costs) and variable utilities (benefits and variable costs) (Tang et al. 2001). Wilson and Woodside (1991) describes that benefits still include the convenience of shopping from customs experience at the store (the knowledge of the store layout and location of the product) and the value that sticks to the service quality (parking space, cleanliness, and friendliness). The habitual experience explains why most of the buyers have a
strong preference for their main store (Tang et al. 2001). In addition, the buyer purchasing value is flexible (ie, ability to buy more when the price is low and buy less when price is high) (Tang et al. 2001). On the other hand, fixed costs are still driven by the time and effort involved in reaching the store.
Utility variable is the product of basic size and variable of utility unit. Benefits of variable units include values derived from loyalty rewards and discount price (Tang et al. 2001). In addition, a special category which is beneficial in shopping experience for shoppers. Specific category is familiarity which means shoppers might consider the expected price is lower for the products in the store, increasing the variable of utility unit, even when the other stores may charge the actual price for the same product. Variable unit cost is determined by the expected price, which is determined by the stores price format (Bell et al. 1998 in Tang et al. 2001).
Perceived Variety
There are three reasons someone chooses to shop at a particular store, which are place, price, and variety. Variety factor is important because: (1) consumers would rather go to the store and find what they want, (2) varieties offer consumers a choice when they are uncertain about their purchase, and (3) consumers want to consume different alternatives on different occasions. Consumers are more likely to choose a store that offers a high variety and organized display. Consumers can learn the variety tricks, thus they do not make bias choices based on the store environments (Hoch, 1999).
Perceived Risk
14
is low, high risk perception of consumer still will have negative effects on the consumer decision to buy goods (Johnson, et al, 2008).
According to Kaplan et al. (1974), perceived risk consists of 6 components, namely: financial risk, performance risk (functional), social risk, psychological risk, physical risk, and time risk (comfort). Perceived risk is a term that consists of various kinds of risks such as financial risk, performance risk, time risk, psychological risk, and social risk (Gocek and Beceren, 2012). Hicks (2005) suggested that when a consumer buys a product, they take risks. The price of the product plays a major role in the level of consumer risk perception. Therefore, this is the reason or cause of the efforts of consumers to buy products that more beneficial than the perceived risk (Gocek and Beceren, 2012).
Consumer Perceived Value
The concept of consumer value is very difficult to measure. The main reason why the consumer value is very difficult to determine is its subjective and dynamic natures. Each customer has their own opinion about what is valuable and when the perception of value is different in various stages of the consumption process, and then it is impossible to form a universal definition. The perception of value includes three main factors, namely: (1) quality, (2) price, and (3) convenience (Lemon et al. 2001). Convenience is related to the time and effort expended by the consumer during the purchasing process. Therefore, the consumer perceived value emphasizing values that are a combination of what is
acceptable to consumers and consumer sacrifice, not by the supplier (Khalifa 2004).
Consumer value is the consumer perception preference and evaluation of product attributes, performance attributes, and consequences arising from the use of facilitation to achieve consumer goals and objectives in the situation of use (Woodruff, 1997). Consumer value is defined as the relative preference (comparative, personal, situational) characteristics of the consumer experience (subjects) that interacts with several objects, namely: services, people, places, objects, events, or ideas. Consumer value is the fundamental basis for all marketing activities, and the high value is one of the main motivations for customer patronage (Holbrook, 1994).
The perception of value is an important factor in the purchase decision making process of consumers, and consumers will buy a product with a high value. Consumers will evaluate what they give and what they get from their subjective perceptions when they buy a product or service (Dodds and Monroe, 1985).
Conceptual Framework
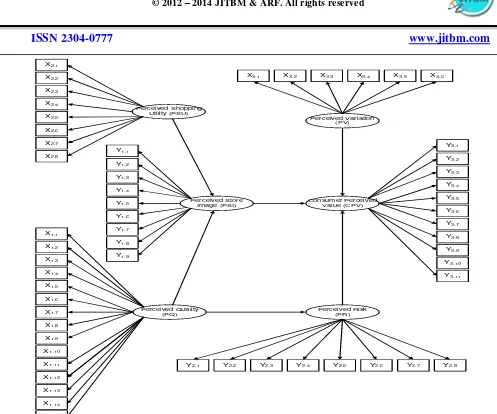
Based on the above description, a model of consumer decision in selecting a place to shop that influenced by consumer perception factors is shown in Figure 1. The model shows that the perception of consumer value in selecting a place to shop is jointly influenced by perception of shopping utility factors, perception of store image, perception of quality, perception of variation, and perceived risk to shopping place.
Perceived Store Utility (PSU)
Perceived Store Image (PSI)
Perceived Variation (PV)
Consumer Perceived Value in choosing shoping place
(CPV)
Perceived Quality (PQ)
Perceived Risk (PR) H1
H2
H4
H3
Figure 1 Frame Work of Consumer Decision Model in Selecting Retail Shop
Based on the conceptual of structural model of consumer decision in selecting place to shop above, the hypothesis of this study can be formulated as follows:
H-1: Perception of shopping utility (PSU) is positively associated with perception of store image (PSI).
H-2: Perception of quality (PQ) is positively associated with perception of store image (PSI).
H-3: Perception of quality (PQ) is positively associated with perceived risk (PR).
H-4: Perception of image store (PSI) is positively associated with perception of value (CPV).
H-5: Perceptions of variety (PV) is positively related to the perception of value (CPV).
H-6: Perceived risk (PR) is positively associated with perception of value (CPV).
RESEARCH METHODOLOGY
Research Design
The research was conducted in Bekasi Suburban region at West Java Province, Indonesia. The time duration needed to conduct the research was 10 months, started from early October 2012 to June 2013. The primary data was obtained by researchers with conducting a direct research in the field through consumer surveys with face-to-face interviews using questionnaires filled out by respondents as many as 610 people (consumers) in traditional markets and modern markets.
Sampling Technique
Consumers as the sample (respondents) were selected using systematic random sampling technique with a certain interval. Limitations of sample selection in the study used by the researcher to make respondents
have a common perception were: (1) consumers are in the productive age (17-50 years), (2) consumers have income/salary, (3) consumers are shopping for fresh product, and (4) consumers are domiciled in Bekasi. The dispersion/spread technique used 5-ranges interval, which was expected to minimize the intervention to respondents from other parties in filling out the questionnaires.
Variable Description and Measurements
The variables used in this study were the endogenous latent variables and exogenous latent variables. Endogenous variables in this study were the perception of store image (Y1), perceived risk (Y2)
and perception of consumers value (Y3). Exogenous
variables in this study were the perception of quality (X1), perception of shopping utility (X2) and
perception of variation (X3).
Perception of quality is the consumer’s perception of product or service superiority or quality from a retail thoroughly as a goal wanted by consumer. Perception of quality is measured using a scale developed by Dabholkar et al. (1996), which consists of 15 indicators/questions such as adequate facilities (X1-1),
hygiene (X1-2), layout (X1-3), service (X1-4), inventory
(X1-5), transaction services (X1-6), employees
knowledge (X1-7), transactions security (X1-8),
employees friendliness (X1-9), handling of return
goods (X1-10), employees sincerity (X1-11), complain
handling (X1-12), parking lot (X1-13), operating time
(X1-14) and payment systems (X1-15).
Perception of shopping utility is consumer’s perception of the utility options or benefits of a store that refers to shopping opportunity and shopping process. Perception of utility was measured using development scale from several literatures that was summarized in the research conducted by Tang et al. (2001), consisted of 8 indicators, namely: easy/strategic location (X2-1), spacious parking lot
(X2-2), payment duration (X2-3), integrated goods (X 2-4), nearby location (X2-5), discount (X2-6), price of
goods (X2-7) and goods availability (X2-8).
16
variety in shopping. The perception of variety was measured using a scale developed Broniarczyk et al. (1998), consisted of 6 indicators, namely: goods variety (X3-1), price variety (X3-2), spacious room (X 3-3), goods placement (X3-4), consistency of inventory
(X3-5) and favorite item (X3-6).
Perception of store image is consumer’s perception of attribute complexity or store characteristics that stands out and distinguishes it from other stores. Perception of store image was measured using a scale developed by Manolis et al. (1994), namely: consists of 9 indicators, namely selection of goods (Y1-1),
reputation (Y1-2), good impression (Y1-3), cultural
values (Y1-4), atrractive appearance (Y1-5), condition
of the building (Y1-6), lifestyle (Y1-7), good service
(Y1-8) and a good employee (Y1-9).
Perceived risk is consumer’s perception of uncertain condition about the negative consequences of shopping products or services in a store. The perceived risk was measured using a scale developed by Kaplan et al. (1974) and applied in the research conducted by Samadi and Nejadi (2009). Latent variable of perceived risk consisted of 8 indicators, namely: loss of costs (Y2-1), as expected (Y2-2),
without pressure (Y2-3), the influence of people (Y2-4),
disappointed (Y2-5), habit (Y2-6), negative effects of
goods (Y2-7), and shopping time (Y2-8).
Consumer perception of value is a relative preference of consumers and the evaluation of product or service of certain store with attribute performance based on experience interacting with some objects (stores). The perception of value was measured using a scale developed by Sweeney and Soutar (2001). Latent variable of perception of value was consisted of 11 indicators such as; comfortable place (Y3-1), fun place
(Y3-2), shopping pleasure (Y3-3), people judgment (Y 3-4), good impression (Y3-5), environmentally
acceptable (Y3-6), quality of goods (Y3-7), consistency
of quality (Y3-8), price (Y3-9), the corresponding
prices of goods (Y3-10), and economical (Y3-11).
Measurement scale used was 5-point Likert scales, where 1 means strongly disagree, 2 means disagree, 3 means undecided, 4 means agree, and 5 means strongly agree.
Method of Data Analysis
Perceived Shopping Utility (PSU)
Perceived Store Image (PSI)
Perceived Variation (PV)
Consumer Perceived Value (CPV)
Perceived Quality (PQ)
Perceived Risk (PR) X2-1
X2-2
X2-3
X2-4
X2-5
X2-6
X2-7
X2-8
Y1-1
Y1-2
Y1-3
Y1-4
Y1-5
Y1-6
Y1-7
Y1-8
Y1-9 X1-1
X1-2
X1-3
X1-4
X1-5
X1-6
X1-7
X1-8
X1-9
X1-10
X1-11
X1-12
X1-13
X1-14
X1-15
X3-1 X3-2 X3-3 X3-4 X3-5 X3-6
Y3-1
Y3-2
Y3-3
Y3-4
Y3-5
Y3-6
Y3-7
Y3-8
Y3-9
Y3-10
Y3-11
Y2-1 Y2-2 Y2-3 Y2-4 Y2-5 Y2-6 Y2-7 Y2-8
Figure 2 Structural Equation Model of Consumer Decision in Selecting Retail Shop
RESULT AND DISCUSSION
Based on the Lisrel software, we obtain the analysis result of construct validity and reliability test for each factor/indicator influence to the latent variable and its
18
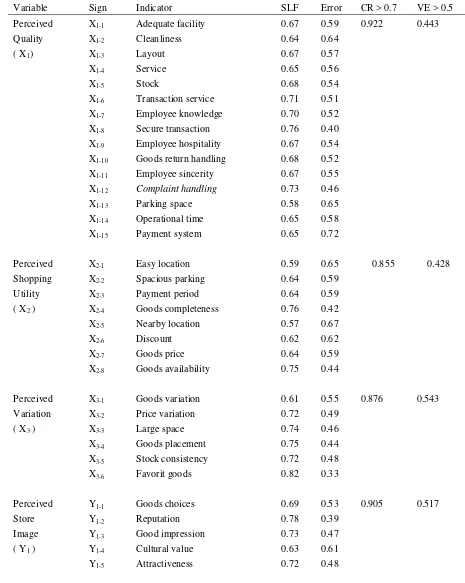
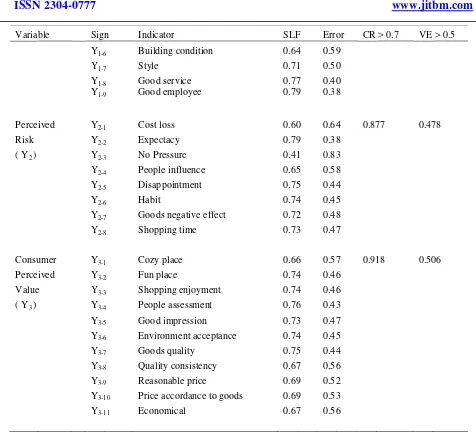
Tabel 1 Construct Reliability dan Varians Extracted Test Result
Variable Sign Indicator SLF Error CR > 0.7 VE > 0.5 Perceived X1-1 Adequate facility 0.67 0.59 0.922 0.443
Quality X1-2 Cleanliness 0.64 0.64
( X1) X1-3 Layout 0.67 0.57
X1-4 Service 0.65 0.56
X1-5 Stock 0.68 0.54
X1-6 Transaction service 0.71 0.51
X1-7 Employee knowledge 0.70 0.52
X1-8 Secure transaction 0.76 0.40
X1-9 Employee hospitality 0.67 0.54
X1-10 Goods return handling 0.68 0.52
X1-11 Employee sincerity 0.67 0.55
X1-12 Complaint handling 0.73 0.46
X1-13 Parking space 0.58 0.65
X1-14 Operational time 0.65 0.58
X1-15 Payment system 0.65 0.72
Perceived X2-1 Easy location 0.59 0.65 0.855 0.428
Shopping X2-2 Spacious parking 0.64 0.59
Utility X2-3 Payment period 0.64 0.59
( X2 ) X2-4 Goods completeness 0.76 0.42
X2-5 Nearby location 0.57 0.67
X2-6 Discount 0.62 0.62
X2-7 Goods price 0.64 0.59
X2-8 Goods availability 0.75 0.44
Perceived X3-1 Goods variation 0.61 0.55 0.876 0.543
Variation X3-2 Price variation 0.72 0.49
( X3 ) X3-3 Large space 0.74 0.46
X3-4 Goods placement 0.75 0.44
X3-5 Stock consistency 0.72 0.48
X3-6 Favorit goods 0.82 0.33
Perceived Y1-1 Goods choices 0.69 0.53 0.905 0.517
Store Y1-2 Reputation 0.78 0.39
Image Y1-3 Good impression 0.73 0.47
( Y1 ) Y1-4 Cultural value 0.63 0.61
Variable Sign Indicator SLF Error CR > 0.7 VE > 0.5
Y1-6 Building condition 0.64 0.59
Y1-7 Style 0.71 0.50
Y1-8 Good service 0.77 0.40
Y1-9 Good employee 0.79 0.38
Perceived Y2-1 Cost loss 0.60 0.64 0.877 0.478
Risk Y2-2 Expectacy 0.79 0.38
( Y2 ) Y2-3 No Pressure 0.41 0.83
Y2-4 People influence 0.65 0.58
Y2-5 Disappointment 0.75 0.44
Y2-6 Habit 0.74 0.45
Y2-7 Goods negative effect 0.72 0.48
Y2-8 Shopping time 0.73 0.47
Consumer Y3-1 Cozy place 0.66 0.57 0.918 0.506
Perceived Y3-2 Fun place 0.74 0.46
Value Y3-3 Shopping enjoyment 0.74 0.46
( Y3 ) Y3-4 People assessment 0.76 0.43
Y3-5 Good impression 0.73 0.47
Y3-6 Environment acceptance 0.74 0.45
Y3-7 Goods quality 0.75 0.44
Y3-8 Quality consistency 0.67 0.56
Y3-9 Reasonable price 0.69 0.52
Y3-10 Price accordance to goods 0.69 0.53
Y3-11 Economical 0.67 0.56
Construct Reliability (CR) and Variance Extracted (VE) Analysis
Table 1 above shows the coefficient estimation of the measurement model of all variables. The analysis result of the measurement model shows the CR (Construct Reliability) value of all variable is larger than 0.7 (CR > 0.7), and this means the indicator of each variable in the model consistently measures the latent variable. The analsysis result also shows the VE (Variance Extracted) value of some variable is larger or the same as 0.5 (VE 0.5) except the perceived quality variable (X1), perceived shopping
utility variable (X2) and perceived risk variable (Y2)
in this research shows a smaller value of less than 0.5
which means the variance of indicator that measure the latent variable is less than 50%. Overall, it can be concluded that the model construct was a reliable model.
Analysis of Overall Model
20
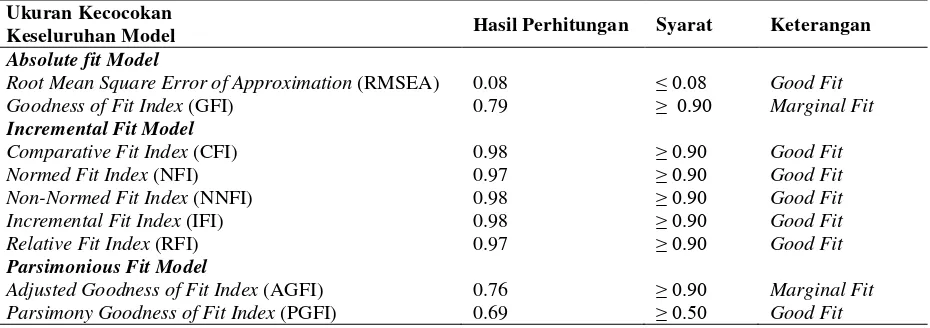
(Browne and Cudeck, 1993), so that it can be said that RMSEA is the most informative indicator of fit model measurement. Based on the research result, the
RMESEA was 0.08 and the GFI value was 0.79 so that overall, it is close to the absolute fit model criteria on the good level of test criteria.
Tabel 2 Result of model fitness analysis
Ukuran Kecocokan
Keseluruhan Model Hasil Perhitungan Syarat Keterangan
Absolute fit Model
Root Mean Square Error of Approximation (RMSEA) 0.08 ≤ 0.08 Good Fit
Goodness of Fit Index (GFI) 0.79 ≥ 0.90 Marginal Fit
Incremental Fit Model
Comparative Fit Index (CFI) 0.98 ≥ 0.90 Good Fit
Normed Fit Index (NFI) 0.97 ≥ 0.90 Good Fit
Non-Normed Fit Index (NNFI) 0.98 ≥ 0.90 Good Fit
Incremental Fit Index (IFI) 0.98 ≥ 0.90 Good Fit
Relative Fit Index (RFI) 0.97 ≥ 0.90 Good Fit
Parsimonious Fit Model
Adjusted Goodness of Fit Index (AGFI) 0.76 ≥ 0.90 Marginal Fit
Parsimony Goodness of Fit Index (PGFI) 0.69 ≥ 0.50 Good Fit
The incremental fit model measurement which compares the proposed models with the basic model frequently called as null model or independence model, consisting of some test tool in the fit as follows: (a) CFI, (b) NFI, (c) NNFI, (d) IFI, (e) RFI. Based on the research result, the value of CFI = 0.98; NFI = 0.97; NNFI = 0.98; IFI = 0.98 dan RFI = 0.97. Therefore, the model is said to be good because it is on the good level of test criteria.
The parsimonious fit model which compares the proposed model with the basic model where all variables in the model are free from ecah other or to combine the model with estimated coefficient necessary to obtain the fit on certain level. According to the parsimonious principle, it means to obtain the highest degree of fit for each degree of freedom, consisting of some test tools in the fit, which is (a) AGFI and (b) PGFI. AGFI is the same as GFI,
however it adjust the degree of freedom on a model. The size of PGFI is almost the same as GFI and AGFI however it is adjusted to the degree of freedom and data complexity.Based on the research result, the value of AGFI = 0.76 and PGFI = 0.69. Therefore, the model is said to be close to good because it is on the good level of test criteria.
Coefficient Analysis of Structural Model and Hypothesis
Figure 3 Structural and Measurement Model Test Result (standardized)
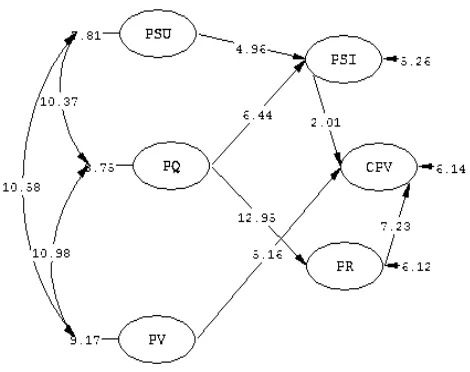
Figure 4 Structural and Measurement Model Test Result (t-value)
The estimation result and its coefficient test can be seen in Figure 3 and 4 .The model coefficient can be used as the estimation of contribution, or the influence of exogenous latent variable to the endogenous latent variable. From the above figure, it can be explained that perceived the shop image is
indicated to have direct relationship with perceived shopping utility (path coefficient = 0.42) and the influence is real because t value of 5.15 is larger than t table of 1.96. The perceived shop image is indicated to
22
value of 6.69 is larger than t table of 1.96. For the
perceived risk, it is indicated to have direct relationship with perceived quality (path coefficient = 0.92) and the influence is real because t value of 15.18
is larger than t table of 1.96. For the consumers'
perceived value, it is indicated to have direct relationship with perceived variance (path coefficient = 0.37) and the influence is real because t value of 5.28
is larger than t table of 1.96. In the above figure, it is
also explained that the consumers' perceived value is indicated to have direct relationship with the perceived shop image (path coefficient = 0.16) and the influence is real because t value of 2.01 is larger
than t table of 1.96, and the consumers' perceived value
is indicated to have direct relationship with the perceived risk (path coefficient = 0.46) and the influence is real because t value of 7.23 is larger than t table of 1.96.
The research result describes that the consumers perception consists of perceived shopping utility, perceived product variance, perceived quality, perceived shop image and perceived risk which influence the consumers' perceived value in choosing the place of shopping according to some researchers' opinion such as Broniarczyk, et al (1998), Hoch,et al. (1999), Gilmore, et al. (2001), dan Tang, et al. (2001).
Hypothetical Test Result
The Influence of Perceived Shopping Utility to the Perceived Shop Image
The research hypothesis stated that the perceived shopping utility is positively related to the perceived shop image. From the test result using SEM, the perceived shopping utility influenced positively and real to the perceived shop image (path coefficient = 0.42, t-value = 5.15). The correlation coefficient
between perceived quality and perceived shop image was 0.42. In other words, if the consumers' perceived shopping utility increased, then it will influence the level of consumers' perceived shop image to the place of shopping.
The utilitarian value that reflects the overall assessment from the functional benefit including the price saving, service exellence, time saving and selection. Price saving is the dimension of economic
value. The product offered with precise price shows that the quality is really in the consumer's mind. Service excellence is the dimension that involves the quality assessment for the service offered. Time saving is an important dimension, especially for the consumers which is in hurry (Lee and Overby, 2004). The Perceived utility shows that the consumers indeed has and utilizes shop image in the shop selection (Finn and Louviere, 1996). Shop image should consist of elements different from the retail marketing blend. The elements are: location, merchandise, shop atmosphere, consumer service, price, advertisement, personal selling, and sales incentive program. For each image of different retail shop, the consumers perhaps already have something in their mind. This is based on the important elements of retails blend. The retail's merchandise is the most that the perceived shopping utility influenced the perceived shop image. The higher the consumers' perceived shopping utility, the higher consumers perception to the shop image, therefore they are more excited to shop in that place. Therefore, the hypothesis that stated that the perceived shopping utility is positively related to the perceived shop image is acceptable.
The Influence of Perceived Quality to the Perceived Shop Image
The research hypothesis stated that the perceived quality is positively related to the perceived shop image. From the test result using SEM, the perceived quality influenced positively and real to the perceived shop image (path coefficient = 0.56, t-value = 6.69).
The correlation coefficient between perceived quality and perceived shop image was 0.56. In other words, if the consumers' perceived quality increased, then it will influence the level of consumers' perceived shop image to the place of shopping.
is not only the price but also brand name and shop name that positively influences the perceived product quality. The perceived quality is not always related with the real product quality; however, it refers to the consumers' perceived quality based on their experiences or the comparison to other competitors' product. Nevertheless, it is necessary to show that perceived quality does not only rely only on one experience, but also perception on some heuristics, such as price or physical attributes of a product (Rafael, Elena and Eva, 2007).
Based on the above description, it can be concluded that the perceived quality influenced the perceived shop image. The higher the consumers' perceived quality, the higher consumer’s perception to the shop image; therefore they are more excited to shop in that place. Therefore, the hypothesis that stated that the perceived quality is positively related to the perceived shop image is acceptable.
The Influence of Perceived Quality to the Perceived Risk
The research hypothesis stated that the perceived quality is positively related to the perceived risk. From the test result using SEM, the perceived quality influenced positively and real to the perceived risk (path coefficient = 0.92, tvalue = 15.18). The
correlation coefficient between perceived quality and perceived risk was 0.92. In other word, if the consumers' perceived quality increases, then it will influences the level of consumers' perceived risk in terms of the lesser consumers risk at the time they shop in that place.
The perceived product quality is influenced by distribution channel, brand image, country of origin, price, and certification (Lin and Kao, 2004). Additionally, extrinsic gestures that influence the perceived quality is price, warranty, advertisement, market share, and country of origin (Thakor and Katsanis, 1997). Hicks (2005) stated that whenever consumers buy a product, they take risk. The risk is considered to refer to the possibility of consumers experiencing uncertainty of the adverse consequence when deciding to buy a product or service (Dowling and Staelin, 1994). In order to reduce the consumer’s risk, the seller or shop is expected to sell a good quality product or service by providing quality assurance in form of warranty. In the marketing
literature, many researches has shown the use of certain risk reduction strategies such as brand reputation, product trial, and success warranty in order to reduce the consumers' perceived risks (Samadi and Nejadi, 2009).
Based on the above description, it can be concluded that the perceived quality influences perceived risk. The higher the consumers' perceived quality, the higher consumers' perceived risk in terms the less risk posed by the consumers, therefore they are more excited to shop in that place. Therefore, the hypothesis that stated that the perceived quality is positively related to the perceived risk is acceptable.
The Influence of Perceived Shop Image to the Consumers' Perceived Value
The research hypothesis stated that the perceived shop image is positively related to the perceived value. From the test result using SEM, the perceived shop image influenced positively and real to the perceived value (path coefficient = 0.16, t-value =
24
and reducing the perceived risk (De Wulf, et al., 2005).
Based on the above description, it can be concluded that the perceived shop image influenced the consumers' perceived value. The higher perceived shop image, the higher consumers' perceived value so that the consumer is more excited to shop in that place. Therefore, the hypothesis that stated that the perceived shop image is positively related to the perceived value is acceptable.
The Influence of Perceived Variety to the Consumers' Perceived Value
The research hypothesis stated that the perceived variance is positively related to the perceived value. From the test result using SEM, the perceived variety influenced positively and real to the consumers' perceived value (path coefficient = 0.37, t-value =
5.28). The correlation coefficient between perceived variance and consumers' perceived value was 0.37. In other words, if the consumers' perceived variance increased, then it will influence the level of consumers' perceived value to the place of shopping.
There are three reasons why consumers shop in certain shops: place, price, and variance. The factors of variance are important because: (1) consumers prefer to go to a shop and find what they need; (2) variance offers the consumer with choices when they are not certain on their purchase; and (3) consumers want to consume alternative products in different occasion. Consumers tend to choose shops that offer high variance with organized appearance. Consumers can learn about variance tricks so that they do not make a biased choices based on the shop environment (Hoch, 1999).
Based on the above description, it can be concluded that the perceived variance influenced the consumers' perceived value. The higher perceived shop image, the higher consumers' perceived value so that the consumer is more excited to shop in that place. Therefore, the hypothesis that stated that the perceived quality is positively related to the perceived risk is acceptable.
The Influence of Perceived Risk to the Consumers' Perceived Value
The research hypothesis stated that the perceived risk is positively related to the consumers' perceived value. From the test result using SEM, the perceived risk influenced positively and real to the consumers' perceived value (path coefficient = 0.46, t-value =
7.23). The correlation coefficient between perceived risk and consumers' perceived value was 0.46. In other words, if the consumers' perceived risk increased, in terms that the consumer is less posed to the risk, then it will influence the level of consumers' perceived value to the place of shopping.
The risk is considered to refer to the possibility of consumers experiencing uncertainty of the adverse consequence when deciding to buy a product or service (Dowling and Staelin, 1994). In other words, perceived risk is a level of risk perceived by consumers in making decision of the commodity purchase and their level of tolerance. Even if the risk is no longer in existence, or whenever the actual risk level is low, the high consumers' perceived risk will still create a negative influence to the consumers' decision in purchasing (Johnson, et al., 2008). When facing a purchasing situation, consumers feel certain levels of risk involved in their choices of certain brands and how to purchase them. A risk is considered a fundamental concept in the consumer’s behavior which implies that the consumers are experiencing pre-purchasing uncertainty for the type and level of expected loss from the purchasing and the use of product (Naiyi, 2004).
Based on the above description, it can be concluded that the perceived risk influenced the consumers' perceived value. The higher the level of consumers' perceived risk in this research result, then the consumers are less risky and the higher the consumers' perceived value they will be more excited to shop in that place. Therefore, the hypothesis that stated that the perceived risk is positively related to the consumers' perceived value is acceptable.
MANAGERIAL IMPLICATION
consumers are influenced by their perception on the selected place of shopping, both for the consumers in traditional or modern market. Choosing supermarkets (shopping place) is an interaction process between marketing strategy, individual characteristics, situational and the buyers. The selection of certain retails is the function of consumers' characteristics and retail characteristics. The consumers will sort out or compares the retail characteristics that are deemed to be match with the evaluation criteria of the core consumers. The consumers will not process this before they visit the retail shop, and if the experience provides positive impression to the consumers or satisfies them, a retail shop will be revisited without further reevaluation (Raharjani, 2010).
A stigma of modern market/retail causes the consumers to choose shopping in the modern market/retail compared to the traditional one can be clearly and easily visualized from the research result from the consumers' perception to the traditional and modern market/retails. The result result can be an input for the traditional and modern market/retails management to meet the expectation of the consumers in shopping. Additionally, the research result can also be an input for the stakeholders in relation with the policy of market management, in this case the regional and central government, in seeking to regulate and manage market management and improving services to the consumers.
The implication of this research in relation with the consumers decision in choosing the shopping place based on their perception can be explain in more structured way into two parts: a company as the market management and the government as the stakeholder.
The company as the market management
From the SEM analysis, it is found that the perceived shopping utility (path coefficient = 0.42, t-value = 5.15)
and perceived quality (path coefficient = 0.56, t-value =
6.69 and path coefficient = 0.92, t-value = 15.18) has
positively influenced the perceived shop image and perceived risk. Additionally, the perceived shop image (path coefficient = 0.16, tvalue = 2.01),
perceived risk (path coefficient = 0.46, t-value = 7.23)
and perceived product variance (line coefficient = 0.37, t-value = 5.28) has directly and positively
influenced the consumers' perceived value. This
shows that the better consumers' perception that has direct influence (perceived shop image, perceived risk, and perceived product variance) and indirect influence (perceived shopping utility and perceived quality) will increase the consumers' perceived value to the market/shop where they shop, so that they decide to shop in that place.
Based on the above analysis, a company as the market/shop management seeks to improve the service quality in all factors, both tangible and intangible according to the consumers expectation and even if necessary, beyond their expectation.
For the shopping utility factor, the company, in establishing and managing the market/shop should pay attention to the fixed utility aspect regarding the representative location both for the market/shop location as well as the goods to be purchased form the market/shop which should be easy and quickly reached by the consumers. The maket/shop should have a wide, secure and comfortable parking lot and should be supplied with a lot and sufficient good so that the consumers can buy them in the same place without going to the other shops. At the transaction and payment process, the market/shop should have a relatively quick method of payment so that the consumers will not waste their time waiting the payment transaction. Besides the fixed utility, the company as the market/shop management should also pay attention to the variable utility regarding the price and stocks availability. Market/shop should have a price strategy by giving a discount and the price of goods should suit the target consumers based on the affordability. Consumers should also be assured regarding the stocks availability for the purchasing.
26
expectation. The company as the market/shop management should pay attention to the interactional competence of the employees in serving the consumers during their dialogs and showing the polite and good attitude so that the consumers will feel safe and secure when doing transaction in the market/shop. When consumers experience problem during transaction, the employees should be capable in handling the consumers complaint with sincere attention and receive the return or exchange of the purchased goods. The company must have policy in running the market/shop that benefit the consumers in form of physical facilities and operational hours as market/shop image include general attributes of the shop, appearance, salesperson and service. The market/shop must have a strong building construction with attractive appearance so that the consumers can feel the market/shop suit the trend of their lifestyle and culture. Additionally, the market/shop must have the choices of high quality goods and satisfactory employees service so that the consumers will have a good impression the the service as well as the reputation of the market/shop where they purchase something.
As the market/shop management, the company should also pay attention to the product variance, which includes the aspects of product variance, display room and number of products. The market/shop must be supplied with sufficient goods with variance in number and size, price variance and the room to display the goods which are eye-catching to the consumers. The goods inventory must be kept secure and continuously monitored both for the daily goods or consumers' favorite items.
The next factors to be considered by the company as the market/shop management is the risk factor, which includes the financial risk, functional risk, social risk, psychological risk and physical risk as well as time risk. The consumers, in choosing the shop and goods, always avoid any risks. The company as the market/shop management should be able to assure the consumer that they are free from any risks during their shopping in the market/shop. Consumers expect
that when they are doing transaction in the market/shop, they will not suffer from financial loss due to the unsuitability of the purchased goods both in terms of function and the impact of usage so that they will not be disappointed and loosing their time while shopping. Consumers, during their shopping, will never be threatened by any parties, instead they are doing it because their habit in fulfilling their daily needs and the information from the close consumers both family and friends with good and exciting experience during their shopping in the market/shop.
From the above description, it can be concluded that during the formulation of business strategy to increase and attract the number of consumers, the company as the market/shop management shall pay attention to the factors and aspects that influence the consumers' perception and behavior in making decision regarding the shopping place
Government
Many traditional market/shop are managed by the government in form of regional-owned enterprise. The government as the market/shop management as well as the policy makers in the market operational should pay attention to the consumers expectation described in this research result. The government should be able to provide and manage the market/shop according to the consumers expectation by means of providing guidance and training to the employees of the company managing the market/shop.
regarding the physical feasibility of the market/shop including the means and infrastructures necessary for the market operation, audit to the quality of the goods and audit the the consumers service quality.
The government can establish a tripartite institution comprising of government, company and consumers which in this case is represented by the consumer institution. The tripartite institution functions to formulate and establish a method to improve the consumer service continuously so that they will never be disadvantaged in any forms and the company as the management still gain the profit.
CONCLUSION
Based on the SEM analysis result, the research showed that the consumers decision in choosing the shopping place is influenced by consumers' perceived value built based on five perceptions and is influenced by environmental (external) factors and internal (personal) factors including its aspects of shop utility factors (fixed and variable utility factor), quality factors (physical, reliability, personal interaction, problem solving and store policies), shop image factor (shop general attributes, appearance, salesperson and service), product variance factors (product variance, display room, number of products) and risk factors (financial risk, functional risk, social
risk, psychological risk, physical risk and time risk) From the analysis, it can be found that the consumers' perception to the traditional and modern market shows the difference in the degree of agreement to all perceptions related with their shopping place, influenced by both external and internal factors.
The analysis result on the consumers' decision model in choosing the shopping place using the measurement model analysis of each factor and fit analysis to all models as well as structural analysis to all respondents in the traditional and modern market showed that the model formulated and tested here is the best model both in the level of test criteria and is acceptable by giving the description on the consumers' perception which consists of perceived shop utility, perceived product variance, perceived quality, perceived shop image and perceived risk that influence the consumers' perceived value that later influence the consumers' decision in choosing the sopping place. If the model is analyzed using the basic model for each group of market using the same and different parameter assumption for both groups, the chi-square result and line coefficient with the level of significance shows the real and significant different between the parameter of line coefficient o the traditional and modern market model. Therefore, it can be concluded that the consumers' perception to the traditional and modern market is different in deciding the shopping place.
REFERENCE
1. Aaker, D.A. (1991). Managing Brand Equity.
New York, The Free Press.
2. Baker, J., Grewal, D. and Parasuraman, A. 1994). “The influence of store environment on quality inferences and store image.” Journal of Acdemy
of Marketing Science, Vol. 22, No.4, pp. 328-329.
3. Berkah. 2008. Pengaruh Persepsi dan Lingkungan Individu Pengunjung terhadap Keputusan Berbelanja di Mal (Suatu Survey terhadap Perubahan Perilaku Belanja Rumah
Tangga di Kota Pontianak). Jurnal Penelitian perceived quality: Perceptions of Saudi consumers toward products of the U.S., Japan, Germany, Italy, U.K., and France. Journal of Quality Management, 2(2), pp. 217-235.
28
9. Dodds, W. B. & Monroe, K. B. (1985). The effect of brand and price information on subjective product evaluations. Advances in Consumer Research, 12(1), 85-90.
10. Finn, A. and J.J. Louviere, “Shopping Center
Image, Consideration, and Choice: Anchor Store
Contribution,” Journal of Business Research, volume 35, March 1996, pp. 241-251.
11. Gilmore, Robert, et al. 2001. Consumer's Attitude and Retailers' Images in Creating Store Choice.
A Study of Two Different Side of The Same Story.
International Journal of Value - Based Management. Vol. 14 No. 3. 2001: 205-221 12. Gocek, Ikilem and Beceren, Yesim Iridag. 2012.
Assessment of the Effects of Store Image, Perceived Risk and Customer Relations on Customer Satisfaction in the Textile Industry. International Journal of Business and Social Science .Vol. 3 No. 9. May 2012: pp. 133-145. 13. Hoch, Stephen J., et al. 1999. “The Variety of
Assortment,” Marketing Science, Vol. 18:4, 527 -546.
14. Hoch, Stephen J., et al. 1999. The Ragam
Assortment. Marketing Science. Vol. 18 No. 4.
1999: 527-546.
15. Howell, Roy D. and Rogers, Jerry D., 1981. “Research Into Shopping Mall Choice Behavior.” Advances in Consumer Research, Vol. 8, pp. 671-676.
16. Johnson, M. S., Sivadas, E. and Garbarino, E. (2008). Customer satisfaction, perceived risk and affective commitment: an investigation of directions of influence. Journal of Service Marketing, 22(5), 353-362
17. Lemon, K.N., Rust, R.T., & Zeithaml, V.A. (2001). What drives customer equity. Marketing Management, 10(1), 20-25.
18. Lounden, David L dan Albert Della Bitta. 1998.
Customer Behavior, Condepts and Applications.
Third Edition. Singapore: Mc. Grown Hill Book Co.
19. Manolis, Chris, et al. 1994. Testing the Underlying Structure of s Store Scale. Education
and Psychologycal Measurement. 65: pp.
628-645.
20. Mazursky, D. and Jacoby, J. (1986), “Exploring the development of store images,” Journal of
Retailing, Vol. 62, Summer, pp. 145-65
21. Naiyi, Ye. 2004. Dimensions of Consumer’s Perceived Risk in Online Shopping. Journal of Electronic Science and Technology of China Vol.2 No.3, Sep 2004: pp. 177-182.
22. Rafael Bravo, Elena Fraj and Eva Martinez (2007). “Intergenerational influences on the
dimensions of young customer-based brand equity”, Journal of Young Consumer, Vol. 8, No. 1, pp. 58-64.
23. Raharjani, Jeni. 2005. Analisis Faktor-faktor yang Mempengaruhi Keputusan Pemilihan Pasar Swalayan Sebagai Tempat Berbelanja (Studi Kasus pada Pasar Swalayan di Kawasan Seputar
Simpang Lima Semarang). Jumal Studi
Manajamen dan Organisasi. Vol. 2 No. 1. Januari 2005: 1-15. Shopping. Business Intelligence Journal. Vol. 2 No. 2. August, 2009: pp. 261-275.
26. Schiffman, Leon G dan Leslie Lazar Kanuk. 2000. Consumer Behavior. USA: Prentice Hall. 27. Semeijn.J. , A.C.R. Van Riel, And A.B.
Ambrosini A B. 2004. Consumer evaluations of store brands:effect of store image and product attributes. Journal of Retailing and Consumer Services 11:247-258.
28. Siringoringo, Hotniar dan Toto Sugiarto. 2009.
Model Keputusan Lokasi Berbelanja. Jurnal of
Management and Business Review. Vol. 6 No. 1. January 2009: 43-55.
29. Siringoringo, Hotniar dkk. 2007. Model
Keputusan Lokasi Berbelanja. The 1st PPM
National Conference on Management Research “Manajemen di Era Globalisasi” Sekolah Tinggi Manajemen PPM, 7 November 2007. dimensions: issues and implications. Journal of International Consumer Marketing, 9(3), pp. 79- 99.
32. Van Herpen, Erica and Rik Pieters (2002), “The Variety of an Assortment: An Extension to the Attribute-Based Approach,”Marketing Science,
21 (Summer), 331–341.