28 CHAPTER III
RESEARCH METHOD
This chapter discusses about time and place of the study, research type, research
design, population and sample, variable of the study, Instrument, Try Out Instrument, Validity and Reliability of Instrument, Data Collection, and Data analysis.
A. Time and Place of the Study
This study had been done since October21th – December21th 2013 to collect all of the data. The data was gotten from the real condition of the eighth grade students of MTs Hidayatul Insan Palangka Raya. It is located at Sulawesi street. B. Research Type
This study used quantitative research to gather the numerical data. Quantitative research was research carried out by collecting numerical data from sample drawn from a certain population. Quantitative research is inquiry employing operational definitions to generate numeric data to answer predetermined hypotheses or question. Thus, it finally attempted to generalize the research findings to the whole population through statistical analysis.1
1
C. Research Design
In this study, the writer used Content Analysis. The study wanted to describe about the problems in using reported speech in simple sentences. According to Ary et al Content analysis is widely used in education. The following are some of the purposes of content analysis in educational research:2
1. To identify bias, prejudice, or propaganda in textbooks. For example, a researcher might analyze high school history texts in a particular school district to determine how often women are mentioned and how much discussion is given in each mention.
2. To analyze types of errors in students’ writings. For example, we could
look at students’ written work to classify spelling or grammatical errors
and their nature and frequency.
3. To describe prevailing practices. For example, we could identify the entrance requirements of Big Ten universities by analyzing their bulletins. 4. To discover the level of difficulty of material in textbooks or other
publications. For example, we could ask, “What is the vocabulary level of the fourth-grade social studies textbooks in this district?”
5. To discover the relative importance of, or interest in, certain topics. For example, we might analyze popular educational research textbooks to see the coverage given to qualitative research and changes in that coverage over time.
2
Content analyses may be done in an emergent design framework, or they may be done in a quantitative research framework with variables that are specified a priori and numbers that are generated to enable the researcher to draw conclusions about these specified variables.3
D. Population and sample
1. Population
Population is the whole of research subject. A population is defined as all members of any well-defined class of people, events, or objects.4 The writer chooses the eighth grade as research subject because the students had learned the material (reported speech). Thus, the writer chooses MTs Hidayatul Insan as the place of the study because of limited in power, time, and finance. The following table is shown the population of MTs Hidayatul Insan.
Table 3.1 the Number of Population
3
Ibid, p: 458 4
Ibid, p: 148
Class Number of Students
VIII Usman bin Affan 39
VIII Abu Bakar 28
2. Sample
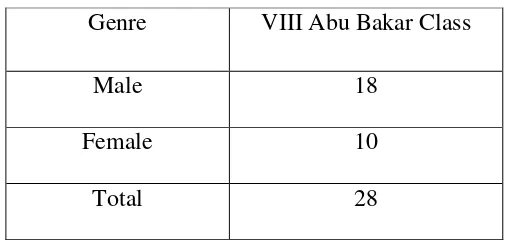
Sample is a group selected from a population for observation in study5.In this study the writer used Cluster sampling to choose the sample because the writer took based on established class. The cluster sampling can be seen in the following table.
Table 3.2 The Number of sample
E. Research Instrument
In a study, instrument as a tool for collecting data plays a very significant role in that it greatly determines the result of the study.
1. Research Instrument.
Because there is one variable, namely: the problem of reported speech. For measuring these variables, the writer used test as instrument for measuring them in research. In this study, it was used written test. In this case, the writer orders the students to change reported speech in Indonesia
5
Ibid, p: 649.
Genre VIII Abu Bakar Class
Male 18
Female 10
Language to reported speech in English Language. The test would be constructed in 22 items. It is consisted of three tenses. There are simple present tense, simple past tense and future tense.
2. Research Instrument of Try Out
The aim of instrument of try out is to know the test instruments are relevant to be given to the students. The writer would perform try out. It is used to know the validity of the test, reliability and level of difficulties of the test. The instruments try out would be tested to the other class of school of the population of the study but in the same level. The try out test would be administrated to the eight grade of Usman bin Affan class in MTs Hidayatul Insan Palangka Raya.
3. Research instrument Reliability
Reliability refers to the consistency of measurement- that is, how consistent
the score or other evaluation results are from one measurement to another.6 In this
study the writer will use split-half method. The reliability of test scores can also be
estimated from a single administration of a single form of a test. The test is
administered to a group of pupils in the usual manner and than is divided in half for
scoring purposes.7 The formula of Kuder and Richardson is used to measure
the reliability of the instrument.
6
Ibid.,p.86 7
( ) ( ( ) )
Where
K = the number of items in the test
M = the mean (arithmetic average) of the test scores
s = the standard deviation of the test scores.
The qualification of reliability as follows:
0,800 – 1,000 = Very high Validity
0,600 – 0,799 = High Validity
0,400 – 0,599 = Fair Validity
0,200 – 0,399 = Poor Validity8
( ) ( ( ) )
As follows:
K = 30
M = 15.5
8
s = 5.372
( ) ( ( ) )
(
)
= 1.034 x (1 – 0.259)
= 0.766
Based on the result above, it could be concluded that the result of reliability of KR21was 0.766. Based on the the qualification of reliability, if the value was on 0,600 – 0,799. There was high validity of instruments.
4. Research instrument Validity
Validity means what extent of accurate in a measure tool in doing the function. A measuring test or instrument has high validity when the instrument does the measure function or gives the result of measuring that is suitable with the function.9
According to Heaton, Validity is differentiated into three kinds, namely face validity, construct validity, and empirical or statistical validity. A test is said to have face validity if the test items look right to other testers, teachers, and students so that it looks like it is measuring what it claims to
9
measure. In addition to having face validity, test validity can be indicated by its construct. A test has construct validity; it is capable of measuring certain specific characteristics in accordance with a theory of language behavior and learning.10
5. Index of difficulty
The index of difficulty (or the facility value) of an item simply shows how easy or difficult the particular item proved in the test. The index of difficult (F.V.)is generally expressed as the fraction (or percentage) of the student who answered the item correctly. It is calculated using the formula: 11
F.V = N R
F.V = Index of the difficulties (Facility Value)
R = the number of correct answers (Represent)
N = the number of the students taking the test
To interpret the index of difficulty, it used Robert L. Thorndike and
Elizabeth Hagen’s interpretation.12
P< 0.30 = Difficult P 0.30-0.70 = Fair
10
J.B Heaton, Language Testing, London: Longman, 1987, p. 153 11
Ibid., p. 125 12
P> 0.70 = Easy
F. Data Collection Procedures
In collecting the data, the writer used some steps as follows:
1. The writer observed the location, the number of class, the number of students, and class activities.
2. After doing the observation, the writer determined the class into try out class and sample of research by using cluster sampling.
3. The writer organized research instrument.
4. The writer tried out research instrument on Thursday, 31st October 2013 at 10.00-11.20 at VIII Usman bin Affan Class.
5. The writer identified the students’ try out test.
6. The writer calculated the index difficulties of try out test. 7. The writer calculated consistency of reliability.
8. The writer reorganize research instrument.
9. The writer gave the test to students on Monday, 11st November 2013 at 10.00-11.20 at VIII Abu Bakar Class.
G. Data Analysis
To analyses the data finding, the writer used as follows: 1. The writer identified the students’answer.
2. The writer underlined the wrong word from the sentences.
3. The writer classified the students answer into surface strategy taxonomy. 4. The writer reconstructed answer into right sentences.